1. Introduction
Road accidents in Ukraine are significantly influenced by the condition of road surfaces, with 10–15% attributed to poor road quality. Similarly, in aviation, approximately 20% of accidents occur during acceleration and take-off, and 16% during landing, emphasising the importance of surface conditions. Current Ukrainian standards for assessing surface flatness and slopes rely on outdated and labour-intensive methods such as theodolites and tacheometers. These methods fail to account for certain irregularities and are often impractical during high-traffic operations.
According to the regulations in Ukraine, the evenness of airfield and road surfaces is assessed based on the difference in elevation during longitudinal levelling, the number of gaps under a 3-m rail, the indicators of push chamber and trailer installations, and slopes. The slopes, in turn, are measured using labour-intensive methods, including the use of a theodolite, tacheometer, rangefinder, level and measuring ruler. The main disadvantages of the longitudinal levelling method include its inability to account for irregularities with wavelengths of less than 10 m or more than 40 m and its high labour intensity. This approach is also selective, allowing for the estimation of unevenness wavelengths from 1 m to 3 m. However, it does not account for unevenness captured by the longitudinal levelling method, nor does it consider noise-causing frequencies.
One of the primary indicators used to evaluate the evenness of both airfield and road surfaces in Ukraine is determined by employing push meters. However, this method has significant limitations. As the pusher is a mechanical device mounted above the rear axle of a laboratory vehicle, the accuracy of its measurements is influenced by various factors, including the condition of the suspension, the ratio of sprung to unsprang masses of the vehicle, the vehicle’s speed, and the specific type of pusher used. Consequently, the current standards for evenness indicators of airfield and road surfaces in Ukraine are outdated and fail to provide an objective assessment of surface parameters. Updating these standards is crucial to enhance the safety of both flights and road traffic. The assessment of slopes and flatness of pavement surfaces is crucial for ensuring the safety, durability and performance of transportation infrastructure, including highways and aerodromes. Traditional methods for assessing surface conditions are often limited by their manual nature, cost and time consumption. In recent years, significant advancements have been made in the development of technologies aimed at improving the accuracy and efficiency of pavement surface evaluation.
Historically, the assessment of pavement conditions relied on visual inspections, manual measurements and static equipment. However, Muttuvelu et al. (Reference Muttuvelu, Wyke and Vollertsen2024) emphasised the limitations of manual inspection techniques for measuring pavement irregularities, which can result in subjective assessments and missed defects. Moreover, the inability to efficiently collect data across wide areas often leads to delayed or incomplete pavement condition assessments (Muttuvelu et al., Reference Muttuvelu, Wyke and Vollertsen2024). The profilograph method, widely used for measuring surface irregularities, also remains a standard in many countries (Liu et al., Reference Liu, Wang, Du, Yong, Yu and Sun2022). However, these methods are labour-intensive and prone to human error. Furthermore, they often lack the precision required for accurate slope and flatness measurements, especially in high-traffic areas like runways and highways. Traditional methods also fail to provide continuous data, leading to inefficient maintenance scheduling and a reactive approach to infrastructure management (Liu et al., Reference Liu, Wang, Du, Yong, Yu and Sun2022).
Meanwhile, mobile measuring systems equipped with laser scanning, lidar and photogrammetry technologies allow for more accurate and efficient pavement assessment. Thus, mobile laser scanning (MLS) systems can measure pavement profile data at high speeds while capturing a large volume of data (Zaremotekhases et al., Reference Zaremotekhases, Hunsaker, Dave and Sias2023). These systems can detect surface irregularities with an accuracy of up to millimetres, making them ideal for assessing both slopes and flatness. Zhu et al. (Reference Zhu, Gao, Huang, Bu and Jiang2023) demonstrated the use of MLS for the assessment of runway flatness in China, achieving significant improvements in measurement efficiency and precision compared with traditional methods. Thus, the integration of mobile units with onboard computational systems led to the development of systems capable of assessing pavement conditions dynamically.
Guan et al. (Reference Guan, Zhou, Liu, Ran and Yan2022) proved the use of mobile measuring modules combined with GPS and accelerometers to monitor road profiles on a global scale. The results indicated that mobile units were not only faster but also more accurate than traditional methods, reducing human error and increasing the frequency of measurements. According to Hauswirth et al. (Reference Hauswirth, Tsirantonaki, Fischli, Rabaiotti and Puzrin2024), lidar sensors offer unparalleled accuracy in detecting variations in slope and elevation, providing a three-dimensional (3D) representation of pavement surfaces. Photogrammetry techniques, particularly those using drones, are also used in pavement surface analysis due to their ability to cover large areas quickly and provide high-quality imagery that can be used for surface flatness assessment.
Another major area of development in the assessment of pavement flatness and slope is the use of data analytics and machine learning (ML) algorithms because the large volumes of data generated by modern measuring systems require sophisticated methods for data processing and interpretation. Roy et al. (Reference Roy, Baditha, Biswas and Kuna2024) highlighted the importance of data fusion. In other words, data from different sensors (e.g. lidar, photogrammetry, GPS) should be combined to provide a more comprehensive view of pavement conditions. ML techniques, including regression models, decision trees and neural networks, are employed to predict pavement deterioration and identify areas requiring repair or resurfacing. Thus, Deng et al. (Reference Deng, Xie, Li, Su, Han and Xiao2024) used ML algorithms to process data from mobile measuring systems and predict the rate of surface degradation based on factors such as traffic volume, climate conditions and slope measurements. The application of ML enables more accurate forecasting, helping to optimise maintenance schedules and reduce costs.
One of the key advancements in the analysis of pavement flatness and slopes is the use of spectral methods to assess surface irregularities. This method divides the pavement profile into different frequency ranges, allowing researchers to focus on specific types of irregularities such as macro-roughness, which significantly affects vehicle comfort and safety. The spectral approach can also isolate low-frequency roughness associated with long undulations from high-frequency micro-roughness that impacts tire performance (Ghani et al., Reference Ghani, Ismail, Azahar, Rahman, Azman, Yusoff and Rosyidi2022).
The integration of these technologies, coupled with improvements in filtering algorithms and sensor design, has the potential to revolutionise pavement quality control in road and airfield applications (Smolyanyuk and Kiyashko, Reference Smolyanyuk and Kiyashko2009). However, ongoing research and development are needed to refine these methods, expand their applicability, and ensure seamless integration into existing infrastructure management systems. International practices, such as the ICAO’s standards for runway slopes and profiles, provide benchmarks for safe and efficient transport infrastructure. These standards underline the need for advanced methods that combine accuracy with efficiency. The proposed research seeks to bridge the gap by introducing novel techniques and technologies tailored to both national and global needs. This study aims to address these shortcomings of the methods used to assess the evenness and slopes of the road and airfield pavement surfaces by developing innovative methods and modules for comprehensive slope and flatness measurement, incorporating MEMS (Micro-Electro Mechanical Systems) technology to align with global best practices.
To achieve this aim, the following objectives were set:
-
• to conduct an analysis of existing methods for assessing the evenness and slopes of the surfaces of road and airfield pavements;
-
• to improve the chosen method for assessing the flatness and slopes of airfield and road surfaces;
-
• to develop a mathematical model of the longitudinal profile of the coating under study, and develop an iterative method for restoring the profile of road and airfield surfaces with an assessment of the accuracy of the profile restoration;
-
• to assess the reliability of the diagnosis using the improved method.
2. Materials and methods
Field tests conducted at Kharkiv International Airport demonstrate the practical application of the proposed system. The measurements adhered to ICAO requirements, maintaining longitudinal slopes below the 0.008 threshold and transverse slopes above 0.015 mm. The system identified localised surface defects with a high resolution of 0.09 mm, offering a level of precision unattainable with traditional methods. The module’s ability to analyse a full spectrum of surface irregularities enabled targeted maintenance planning, highlighting its effectiveness and reliability (Savenko & Kiyashko, Reference Savenko and Kiyashko2011).
The indicator for the evaluation of the evenness by the difference of the height marks during the longitudinal levelling is obtained from the levelling data of the relative marks h, points on the surface of the pavement or the base of the road at the measuring points by a step of (5.0 ± 0.2) m. The length of the measuring section is chosen to be at least 400 m. The positions of the levelling rails should be on the same line, which is located at a distance of 0.5–1.0 m from the edge of the carriageway (DBN V.2.3-4:20015, 2015; DSTU 3587-97, 1997; DSTU B V.2.3-3-2000, 2000; P-G.1-218-113:2009, 2009). The measurement is made by placing the levelling rod in each of the marked marks in turn. Based on the levelling data, the relative marks and points of the airfield pavement surface are calculated (Figure 1).
Elevation difference for longitudinal levelling.

The deviations of points (except for the first and last within the measurement area) from the straight line connecting the preceding (i−1) and succeeding (i + 1) points on the coating surface are calculated using the formula:
 $$\delta {h_i} = \left| {{{{h_{i - 1}} + {h_{i + 1}}} \over 2}} \right| - {h_i},$$
where δh i is the deviation of points from a straight line; h i–1, hi, h i+1 are the relative marks of the previous, current and next points, respectively.
The longitudinal levelling method idealises the microprofile of the coating, resulting in a simplified profile with a 5-m step (Figure 2). By fitting a curve to this microprofile, a wavy profile is generated. This method does not account for irregularities with wavelengths shorter than 10 m or longer than 40 m, as defined by DSTU B V.2.3-3-2000 (2000). Additionally, it excludes associated noise frequencies above 200 Hz. Essentially, this approach is used to control construction quality by identifying deviations between the actual surface and the design, considering only irregularities with wavelengths greater than the wheel contact area (Pavlyuk et al., Reference Pavlyuk, Rybitsky, Lebedev and Ivanytsia2004).
Scheme of applying the rail to the surface of the coating and measuring the gaps using a wedge gauge.

The measurement section spans 300 to 400 m. Measurement processing involves identifying the percentage of gaps under the rail that exceed the maximum allowable value or fall below the minimum allowable value. Evaluating evenness in gaps under a 3-m rail accounts for irregularities with wavelengths between 1 and 3 m. According to Equation (2), this corresponds to frequencies ranging from 3.7 to 61.1 Hz, which are not captured by the longitudinal levelling method and do not include noise-inducing frequencies. Thus, evenness assessment should combine indicators for height differences in longitudinal levelling with the number of gaps under the 3-m rail. However, these assessments are not applied uniformly across the entire pavement section, but are selectively conducted over specific areas.
The main disadvantages of the longitudinal levelling method and the resulting evenness indicator include: complexity in evaluating evenness; higher safety requirements during measurements, such as those conducted on operational runways; and selective nature of the evenness assessment (Skrypets et al., Reference Skrypets, Krasnov, Smolych and Kireev2014a). As a result, this method is rarely used in practice. Moreover, the current DBN V.2.3-4:2015 does not provide a methodology for evaluating evenness using longitudinal levelling. In cases of runway repairs, this method becomes less reliable due to the need for additional measurements of existing vertical curve radii and adjustments to account for the curvature of the current profile. Current regulations (DBN V.2.3-4:2015; DSTU 3587-97; DSTU B V.2.3-3-2000; P-G.1-218-113:2009) primarily emphasise surface evenness, assessed using pushers, which remains the standard method for evaluating the condition of airfield and road surfaces in Ukraine.
Furthermore, the International Roughness Index (IRI) and the spectral density of dispersion are widely used to evaluate road surface evenness. This paper examines these indicators and the wavelengths they measure. According to Shilin et al. (Reference Shilin, Bieliatynskyi, Pershakov, Meiyu and Ta2022), the IRI is most sensitive to irregularities with wavelengths between 1.2 and 30.0 m, showing sensitivity peaks at 2.30 and 15.78 m, corresponding to frequencies ranging from 0.37 to 50.93 Hz. The IRI is more stable over time, provides a detailed and precise estimate of runway roughness, and is versatile, as it can be measured with various instruments. Consequently, it is a fundamental indicator for assessing surface evenness in many countries (Savenko and Kiyashko, Reference Savenko and Kiyashko2011).
Since the surface profile of road and airfield pavements is an ergodic random function of travel distance, it can be characterised using statistical metrics. A detailed characterisation is provided by the spectral density of dispersion, which captures both irregularity amplitudes and their wavelength distribution (Horb & Horb, Reference Horb and Horb2011; Bieliatynskyi et al., Reference Bieliatynskyi, Shilin, Pershakov, Meiyu and Ta2022c, Reference Bieliatynskyi, Shilin, Pershakov, Meiyu and Ta2022d). To estimate the spectral density of the variance in pavement profile ordinates, the following methods are commonly used: the standard method, which calculates the Fourier transform of the autocorrelation function of the pavement profile, as per the Wiener–Khinchin theorem; and a direct Fourier transform of the surface profile (Savenko & Kiyashko, Reference Savenko and Kiyashko2011). Unlike the IRI, the spectral density allows for the evaluation of surface irregularities across the entire wavelength range (Pavlyuk et al., Reference Pavlyuk, Tereshchuk, Lebedev and Shuryakov2014). Therefore, it is a critical indicator for ensuring the evenness of airfield and road surfaces during design, construction and post-repair evaluation (Figure 3).
Wavelength range of inequalities covered by measurement methods.

The slopes of airfield pavement structures are traditionally measured using labour-intensive geodetic methods, such as theodolites, total stations, range finders, levels and measuring rulers. For instance, the longitudinal slopes of the runway are measured at intervals of approximately 60 m, which corresponds to a gap of 8 slabs (each 7.5 × 7.5 m2). Within this interval, neither the slopes nor the irregularities of each individual slab are assessed (Skrypets et al., Reference Skrypets, Krasnov, Melnikov, Boyko and Sagidaev2013a; Bieliatynskyi et al., Reference Bieliatynskyi, Shilin, Pershakov, Meiyu and Ta2022a; Bieliatynskyi et al., Reference Bieliatynskyi, Shilin, Pershakov, Meiyu and Ta2022b).
In addition to traditional geodetic methods and equipment, special automated measurement devices are used for primary data collection. These include the TRRL static profile analyser, the manual Dipstick measuring device, the inertial evenness meter APL (which measures pavement slopes relative to the vehicle base) (Matsko, Reference Matsko2002; Yevdokimov, Reference Yevdokimov2016) and the longitudinal profile information analyser KJ.LAW (Zapateiro et al., Reference Zapateiro, Pozo, Karimi and Luo2012). The Dipstick profile gauge, developed and patented by Face Construction Technologies in the USA, provides more detailed measurements of the airfield pavement microprofile compared with traditional longitudinal levelling, as it captures surface samples with smaller steps. The device includes a battery-powered onboard computer that automatically records data and performs calculations to construct a profile by measuring the height difference between two points, typically 305 mm apart, though the measurement step can vary.
The most commonly used GM-type profiling system was developed by the South Dakota DOT in 1981 (Huft, Reference Huft1984). Initially, the GM-type profilometer employed a mechanical wheel pressed against the pavement surface. However, this wheel sometimes skipped over bumps or notches, causing inaccurate profiles that reflected the wheel’s movement through the air, rather than on the surface (Zhao et al., Reference Zhao, McDaniel and Wang2013). A more significant issue, according to users, was the risk of wheel damage. Modern GM-type profilometers replaced the mechanical wheel with non-contact sensors that use ultrasound, lasers, or optical imaging to measure height. By processing data from an accelerometer and height sensor, the measured pavement profile is calculated (Zapateiro et al., Reference Zapateiro, Pozo, Karimi and Luo2012). The reference profile is derived by converting vertical accelerations into instantaneous height, and the distance to the surface is measured by a non-contact sensor, such as a sonar or laser transducer, providing a sample of the pavement profile. The longitudinal distance is determined based on data from the vehicle’s speedometer (Sayers & Karamihas, Reference Sayers and Karamihas1998).
The measurement of these slopes is carried out using two laser height gauges spaced along the longitudinal axis of the frame at a distance X d. Signal processors of laser meters calculate their distance to the surface airfield Х В1, Х В2. To determine the longitudinal slopes θ, the following equation is used:
 $${\rm{\Theta }} = {{{X_{B1}} - {X_{B2}}} \over {{X_d}}},$$
Nevertheless, traditional techniques, such as longitudinal levelling and the 3-m rail method, are selective and fail to account for irregularities with wavelengths outside specific ranges (Kiyashko et al., Reference Kiyashko, Savenko and Kiyashko2014). For instance, longitudinal levelling excludes irregularities below 10 m or above 40 m, while the 3-m rail method is prone to human error and lacks comprehensive data on high-frequency irregularities. The pushmeter method, widely used in Ukraine, is influenced by external factors like vehicle suspension and speed, resulting in inconsistent results (Savenko and Kiyashko, Reference Savenko and Kiyashko2011).
To overcome these shortcomings, this study uses the MEMS technology as a compact, reliable and efficient solution for measuring irregularities and slopes. MEMS sensors were adopted due to their compact size, low cost and high accuracy in capturing minute changes in the angle of spatial orientation. In this regard, Hayama et al. (Reference Hayama, Sekiya and Nagai2022) explored the use of MEMS-based sensors for measuring pavement profile irregularities, achieving high-resolution data collection while maintaining portability and ease of use. The Kalman filter was applied to enhance the accuracy of MEMS measurements, compensating for noise and ensuring reliable data even in challenging environments. By integrating inertial measurement units (IMUs) with advanced filtering algorithms, such as the Kalman, Madgwick and complementary filters, the proposed system enhances precision and minimises noise (Skrypets, Reference Skrypets, Krasnov, Smolych and Kireev2014a).
BINS, which determines the location of the OKP-VU, consists of sensors made using MEMS technology. MEMS integrate microelectronic and micromechanical components. These devices are typically fabricated on silicon substrates through micromachining, similar to the process used for single-chip integrated circuits. Micromechanical elements typically range from 1 to 100 µm, while the MEMS microcircuit chip dimensions range from 20 µm to 1 mm (Figure 4).
MEMS structure.

MEMS are created by integrating mechanical elements, sensors and electronics on a common silicon platform. These components can be incorporated into a single product or fabricated in large quantities, similar to microcircuits. The use of microelectromechanical systems revolutionises various fields by merging silicon-based microelectronics with micromechanical technologies to create Systems-on-a-Chip (SoC). MEMS technology advances inertial navigation systems and integrated systems, enabling the development of smart products, enhancing micro-sensor capabilities and expanding design possibilities. The mathematical model of the longitudinal surface profile studied consists of irregularities modelled based on wavelength classification, adhering to ICAO standards for maximum surface slope values of airfield structures. These values depend on the airfield’s code designation and state building codes. Thus, the surface profile (P) of both airfield and road structures can be idealised and described by the following equation:
 $$P\left( x \right) = f1\left( x \right) + f2\left( x \right) + f3\left( x \right),$$
where f1(x) is the general slope of the surface under study (macro-roughness); f2(x) is micro-roughness and f3(x) is roughness.
The component of the total slope of the surface f1(x) is proposed to be calculated by the following formula:
 $$f1\left( x \right) = {\it{exp}}\left( { - {{{{\left( {x - m} \right)}^2}} \over {2{\sigma ^2}}}} \right) \cdot \sin \left( {{{2\pi } \over {{T_1}}}x + {\varphi _1}} \right),$$
where m is a random variable within 0.Z; σ2 is a random variable; φ1 is A random initial phase within (0.2π) and T 1 is a random variable of the period.
The modelling the slope component of the studied surface on a segment 2000 m long is presented in Figure 5.
Surface slope component.

As shown in Figure 5, the irregularities have a period of more than 100 m. Considering the amplitude of oscillations, the slope of the studied segment does not exceed 2%. These irregularities form the macroprofile (longitudinal profile) of the surface, affecting dynamics, driving modes and engine performance, but do not cause low- or high-frequency vibrations. Traditionally, equality is associated with the micro-roughness of coatings. However, the influence of roughness on the overall roughness indicator is not fully understood. On one hand, roughness should provide an adhesion coefficient and be minimal to maximise the contact area between the tyre tread and airfield pavement. On the other hand, it must be rough enough to enable efficient water removal from the contact area. Increasing roughness leads to higher rolling resistance and tyre wear. Using the developed mathematical model of the coating profile, it is possible to evaluate its parameters. By decomposing the measured profile into a spectrum of harmonic oscillations, each frequency component can be analysed (Figure 6).
Modelled surface profile spectrum.

With the inverse Fourier transform, each frequency component distributed over a short period of the studied section of the surface profile can be localised and identified as a pothole, and is not considered when estimating the equality coefficient. The studied surface profile of the coating is reconstructed from the range of frequency components of micro-roughness (without considering the components of local inequalities) and is used for further calculation of the coefficient of equality by simulating the movement of a quarter-car model.
The practical implementation of the proposed methods promises significant improvements in road and runway safety in Ukraine. The integration of MEMS technology addresses critical gaps in monitoring and evaluation by offering enhanced accuracy and efficiency. However, challenges such as high initial investment costs, the need for operator training and compatibility with existing infrastructure must be addressed. To mitigate these barriers, the study suggests phased implementation to distribute costs over time, alongside international funding support from organisations such as the World Bank or European Investment Bank. Training programs tailored to operators and engineers, coupled with intuitive user interfaces, can simplify the adoption process. Compatibility with existing infrastructure can be ensured through collaboration with stakeholders and alignment with ICAO and European Union standards. Pilot projects at key airports and highways are proposed to serve as models for broader deployment. The system’s portability further enhances its scalability, making it suitable for diverse environments, from urban roads to remote airfields.
3. Results
During the construction of new airports in Ukraine, ensuring high-quality runway pavement was essential, particularly compliance with roughness parameters, longitudinal and transverse slopes, as per current European and ICAO standards. Runway slopes are measured geodetically at intervals of approximately 60 m, covering approximately eight slabs (each measuring 7.5 × 7.5 m²). However, irregularities within individual slabs and their slopes are not directly monitored. To address this, the Department of Avionics, in collaboration with DPT Ukraeroproekt, developed an operational module for measuring longitudinal and transverse slopes as well as surface evenness. These measurements were applied during the construction of a new runway at Kharkiv International Airport.
Tests demonstrated the practicality of research in this area. Developing methods and instruments for measuring slopes and irregularities will enhance quality control of runway surfaces during construction and improve air transport safety. The measuring module consists of a movable platform operated manually. It features a movable KP-9 bracket mounted on the platform, enabling simulation of longitudinal and transverse slopes and calibration of the measuring device. The KP-9 base is attached with adjustable screws, which are used to level the base via a horizon sensor. A gyroscope, a device sensitive to angular velocity changes, forms a critical component of this system. MEMS gyroscopes, commonly used for such purposes, operate based on the Coriolis force. These devices contain a working fluid that moves reciprocally. When the substrate is rotated, the Coriolis force acts on the fluid, perpendicular to the axis of rotation and the fluid’s direction of motion (Figure 7),
 $Fk=2m[\bar{\textrm{V}} \times\bar{\unicode{x03A9}}]$
.
Mechanism of operation of the Coriolis force.

The sensors are mounted on a board located at the centre of the KP-9. The same board houses a microcontroller that processes sensor data and displays the measurement results on a liquid crystal display. This display simultaneously shows the longitudinal slope (pitch) and the transverse slope (roll), each measured within a range of ±90° (arc degrees) with a resolution of 0.1° or 6′. A voltage of +3.3 V powers two MEMS gyroscopes. The first, an LPR530AL gyroscope, measures angular velocity in the XY plane, while the second, an LPY530AL gyroscope, measures angular velocity in the XZ plane. Data from the gyroscope outputs are sent to the inputs of 4–6 microcontrollers. In addition, a +5 V voltage powers the LCD display (type LCDWX1602), which shows both the values and signs of the longitudinal (pitch) and transverse (roll) slopes. The stabilisers, MEMS accelerometers, gyroscopes and LCD display are integrated onto printed circuit boards enclosed within the KP-9 biaxial swivel bracket (Figure 8).
Functional diagram of the module.

The MATLAB software environment was used to integrate data and implement filtering algorithms, ensuring the experiment was not limited by computational constraints when calculating the orientation of the measuring platform (MP). The software processes raw sensor data. Digital IMUs, such as those with MPU-6050 and BNO055 sensors, avoid the limitations of analogue systems. However, IMUs incorporating the pr530al 3-axis angular velocity sensor and the ADXL 335 3-axis accelerometer require an ADC for data acquisition due to their analogue nature. The research algorithm involves manually rotating the IMU mounted on a swivel bracket at specific angles (ranging from −5° to +5° in this experiment). Data are recorded by pressing a button, triggering the software to log each measurement and incrementally expand the data array Δαi (the difference between measured and absolute values). The process is labour-intensive, requiring 1,000 measurements (i = 1,000) for each type of IMU, which takes approximately 3 to 3.5 h. The resulting dataset enables the construction of measurement error density distributions, facilitating the evaluation of error characteristics.
The following sections of the competition zone were studied experimentally:
-
• the initial 660-m section to determine the magnitude and direction of the longitudinal slope on one side;
-
• the flatness of slabs identified as defective using a 3-m ruler. Defective sections were removed and re-concreted.
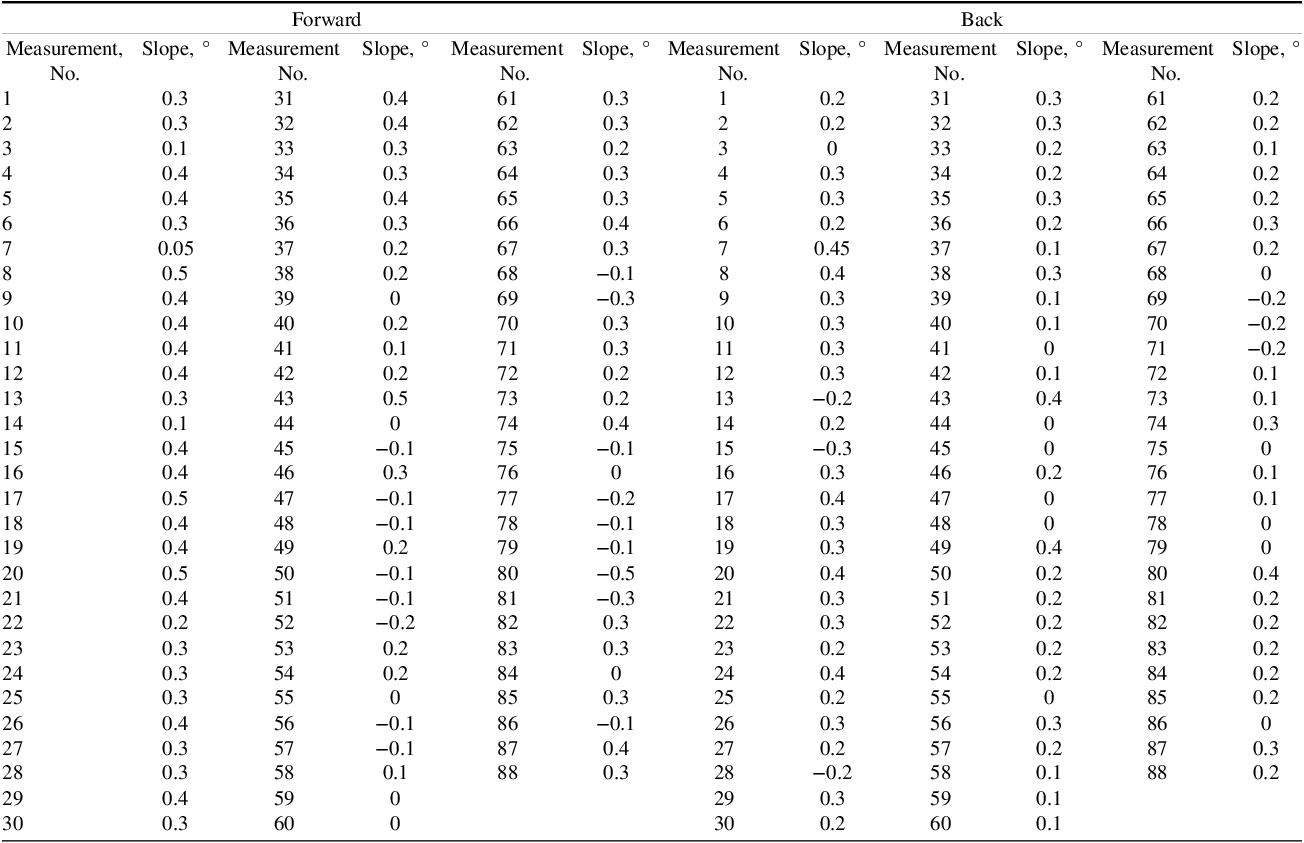
The experimental study of fragment No. 1 was conducted as follows. At the starting point of the runway’s initial section, the module was positioned and levelled 1 m from the runway axis. The module was then moved along the first slab in 1-m increments to its junction with the second slab, where the first measurements were taken. Subsequent measurements were performed at equivalent points on the following slabs. Before each measurement, the module was stopped for 10 s. The module covered a total path of 660 m in one direction, followed by a return with measurements taken at the same points. The forward and backward measurement data are presented in Table 1.
Measurement result of fragment No. 1.

The results of the longitudinal slope on the initial section measurements of the runway are as follows:
-
• longitudinal slope does not exceed 0.008;
-
• the longitudinal slope in the initial section within 416 m has mostly one direction, but there are sections (55/105 m; 130/160 m; 215/255 m; 345/380 m) where inequalities are found.
During the experimental study of fragment No. 2, a significant unevenness was detected at PK6 picket, 91 m to the right of the axis, using a ruler. To address this issue, the builders removed a section of the slab and re-concreted it. This repaired fragment was selected for post-repair analysis of surface irregularities and slope measurements, as it could not be assessed using geodetic methods. Table 2 presents the average results of the longitudinal and transverse slope measurements. The module was moved clockwise, making a 90° turn at each corner of the rectangle.
Measurement results for fragment No. 2.

The measurement results are as follows:
-
• the longitudinal slopes of the repaired fragment do not exceed 0.008 (28’) and comply with SNiP requirements;
-
• the transverse slopes exceed 0.015 (52’) and range between 1.2° and 0.75°;
-
• on the left side, one point with a slope of 0.75° was measured, which is 6’ below the allowable tolerance (Figure 9).
Figure 9.A fragment of a slab that needs repair.


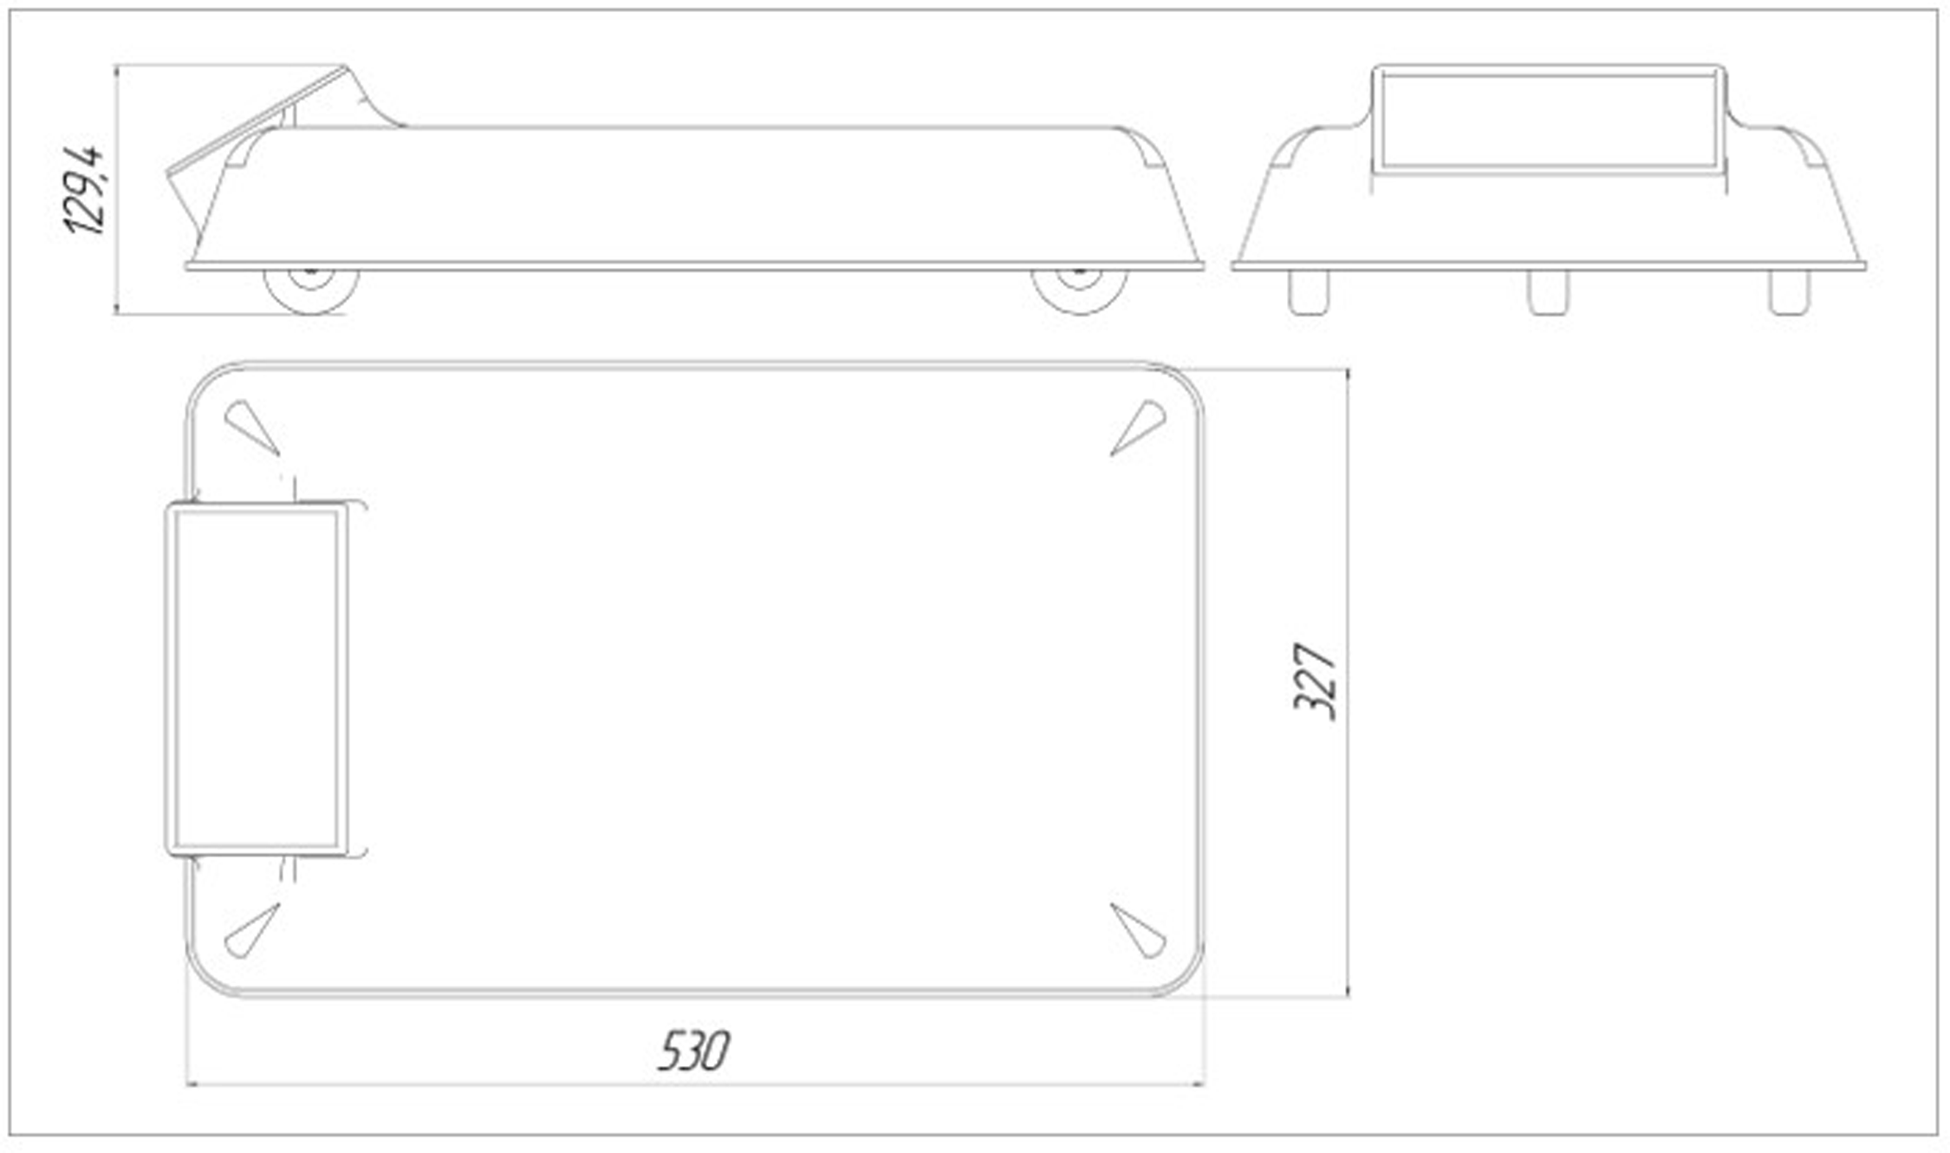
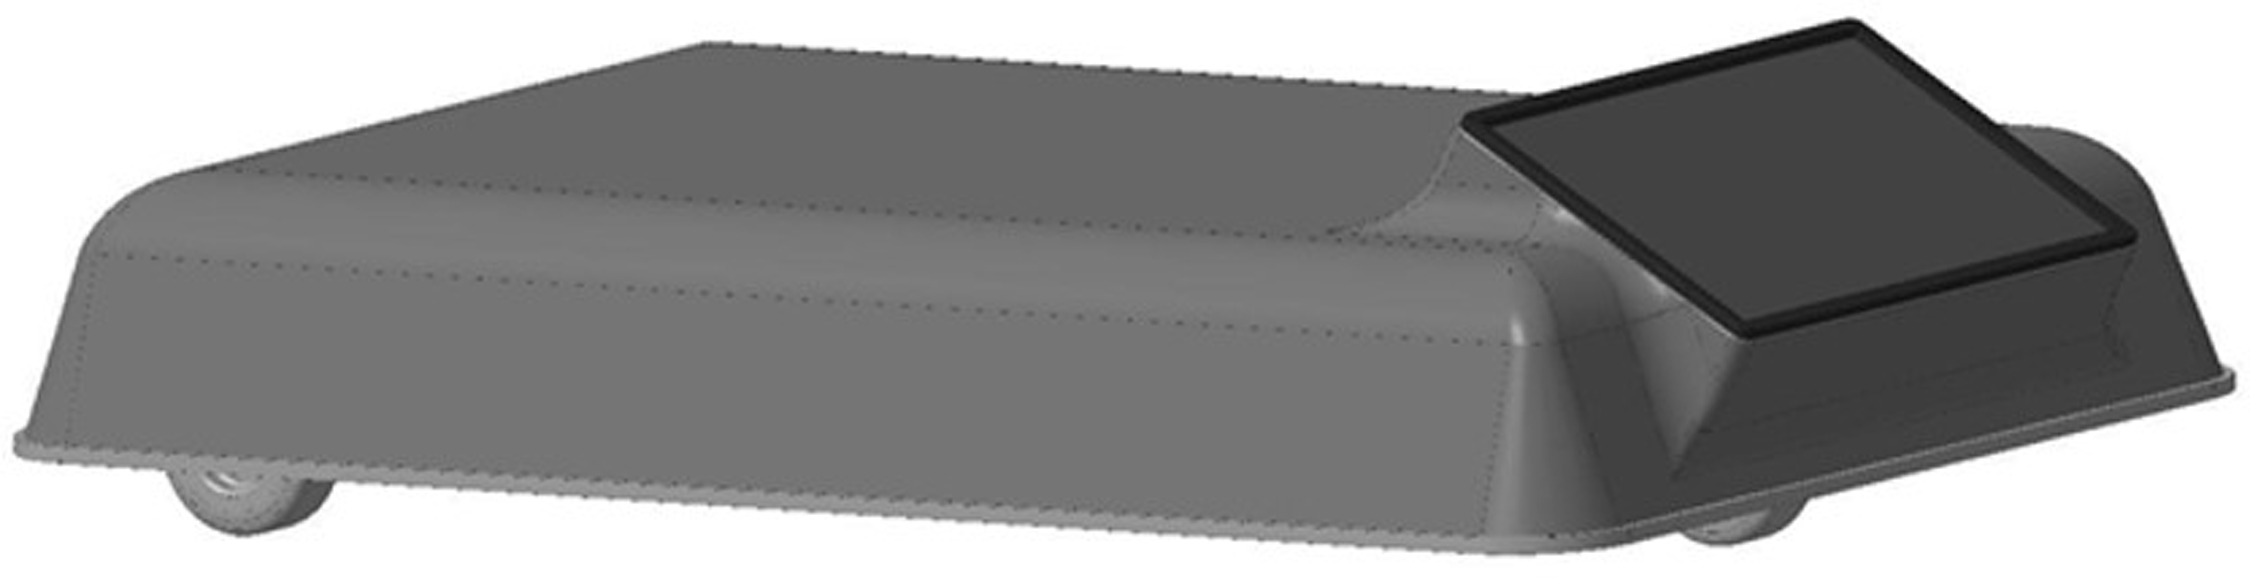
The module consists of a wheelbase operated by the user, equipped with a measuring unit and a monitor for displaying information (Figures 10 and 11).
Wheel base dimensions.

General view of the MP.

The measuring unit includes an IMU with MEMS sensors (accelerometer, gyroscope, magnetometer) model BNO055 (BOSCH), an angle position sensor (AS4850B) for measuring distance, boards that synchronise data from the MEMS sensors with the travelled path, an industrial PC (NP93) for data processing, and an SSD storage device.
The frame design of the MP features a welded aluminium profile, with the outer casing made through vacuum forming. A 7” LCD TFT 1024 × 600 FPV Monitor (Newest model) is recommended for installation.
Estimated specifications are as follows.
-
• Measurement accuracy: ±0.089° (5.3 arc min).
-
• Measurement range: ±30°.
-
• Dimensions: 530 × 327 × 129.4 mm.
-
• Automatic movement: None.
-
• Software for displaying slope angles: Yes.
-
• Software for automatic IRI coefficient determination: No.
-
• Device weight: No restrictions.
The project enables automatic movement of the mobile platform (MP) across the surface under study. This is achieved by installing electric drivers (stepper motor or servo), a control panel (Hobby King 2.4GHz 4Ch) and a Pixhawk-type MP control system (Skrypets et al., Reference Skrypets, Krasnov, Melnikov, Volkov, Volosheniuk, Smolych and Kireev2013b) on the wheelbase. A ground control station is required for remote data processing (Smolych et al., Reference Smolych, Kireev and Krasnov2014). The design of this ground control station, which supports data reception via radio communication and parallel processing, including building a 3D model of the measuring surface and normalising irregularities, is shown in Figure 12.
General view of the ground control station project.

Due to the limited width of the wheelbase, the MP cannot measure the full frequency range of profile irregularities, resulting in the loss of roughness measurement capability. Since the pavement profile roughness affects the friction coefficient, traffic safety, and the regularity and efficiency of flights, it is crucial to develop a device capable of addressing this issue. Therefore, a device based on the laser triangulation method was developed, which allowed non-contact measurement of road and airfield pavement irregularities in the roughness frequency range. The triangulation method calculates the distance based on the triangle relation using known system parameters. This method can measure both the relative change in distance from the sensor to the object and its absolute value. Moreover, the measured distance can range from a few micrometres (e.g. in microelectronics) to hundreds or thousands of metres (e.g. in geodesy).
The triangulation scheme can be conditionally divided into three parts, namely the radiation (or illumination) channel, the controlled surface and the receiving channel (Figure 13) (Guidi et al., Reference Guidi, Russo, Magrassi and Bordoni2010).
Schematic diagram of a triangulation meter.
Note: 1, radiation channel; 2, controlled surface; 3, receiving channel.

Figure 13 shows that the first part of the scheme is a radiation channel, consisting of a radiation source and an objective that forms a probing beam on the controlled surface. A laser diode is used as a radiation source. A lens consists of one or more optical lenses. The relative position of the lens and the laser diode determines the parameters of the radiation channel (Skrypets, et al., Reference Skrypets, Krasnov, Kireev, Smolych and Sagidaev2013c). The second integral part is the controlled surface. Each surface has the property of reflecting or scattering incident radiation. Diffuse radiation scattered by the surface of the control object is used in triangulation as a physical basis for obtaining information about the distances to this surface. The third part is the receiving channel, which consists of a lens and a photodetector. The lens forms an image of the probing spot in the plane of the photodetector. The larger the lens diameter, the higher its aperture ratio. In other words, the more intense and better the image of the spot is built. The scheme of the triangulation meter is as follows: the radiation channel 1 forms an image of a light spot on the controlled surface 2. Then, the scattered controlled surface enters the receiving channel 3.
Thus, an image of the illuminated area of the controlled surface (light spot) was created in the plane of the photodetector. When the controlled surface is displaced by ΔZ, the light spot in the plane of the photodetector is displaced by ΔX. The dependence of the displacement of the controlled surface ΔZ on the displacement of the light spot in the plane of the photodetector ΔX has the following form:
 $$\Delta Z = r \cdot {{\sin \varphi } \over {\sin - \varphi }},$$
where φ=arctg(A·∆X/(1+B·∆X)); A=sinβ/r´; B=−cosβ/r´; r is the distance from the controlled surface 2 to the lens of the receiving channel 3; r′ is the distance from the lens to the photodetector, with the controlled surface in the centre of the shift measurement range.
As shown in Figure 14, a laser line created with a cylindrical lens was used as a probing beam. After that, a line was formed on the photodetector that corresponds to the surface profile that was monitored.
Triangulation meter with laser line.
Note: 1, laser diode; 2, cylindrical lens; 3, controlled surface; 4, scanning line; 5, cleaning lens; 6, photodetector matrix.

The developed setup used a laser diode and a cylindrical lens as a radiation channel. As a result, a laser beam in the form of a thin line was formed on the surface of the coating under study. The receiving channel is a SONY DSC-H55 digital camera. This simplifies the design task, since the lens and photodetector (matrix) are made in a single housing (Skrypets, et al., Reference Skrypets, Krasnov, Smolych and Kireev2014b). By means of a laser emitter, a scanning line was created on a surface fragment. The plane of the laser beam is perpendicular to the fragment plane. The digital camera was located at a strictly specified angle to the plane of the laser beam. When photographing a fragment, a red line was visible on the photo, clearly describing its profile (Figure 15).
Laser line on a fragment of the investigated surface.

Therefore, the output signal of the developed meter was a digital image processed in the MATLAB environment using the standard Image Processing Toolbox programming package. After processing, numerous values for the depth of irregularities and their geometric parameters were obtained. By shifting a fragment of the surface relative to the scanning line, a three-dimensional model of the surface was built (Figure 16).
Three-dimensional model of the investigated surface.

The device was tested in the laboratory on a concrete surface fragment measuring 30 × 40 cm, with indentations (grooves) of varying depths (0.5–3 mm). The profile depth measurement accuracy was 0.09 mm. Therefore, the developed device allowed for comprehensive measurement of surface profiles on road and airfield pavements, covering the full range of irregularity waves. Therefore, a complex device was developed to measure slopes, flatness and roughness of the pavement surfaces.
4. Discussion
The safe operation of road and air transport depends on the evenness of road and airfield pavements, prompting many researchers to focus on assessing and substantiating their standard indicators. Notably, the Michigan Transportation Research Institute (UMTRI) team, including Sayers and Karamihas (Reference Sayers and Karamihas1998) and Zhao et al. (Reference Zhao, McDaniel and Wang2013), contributed significantly to this field. The methods for assessing the slopes and flatness of airfield structures and roadways, discussed in these studies, rely on measuring the angles between points on the surface profile. Therefore, the next logical step is to explore an alternative method for measuring the angle between two points on the surface profile. This method involves using MEMS, with spatial position sensors (Bieliatynskyi et al., Reference Bieliatynskyi, Shilin, Pershakov, Meiyu and Ta2022e; Bieliatynskyi et al., Reference Bieliatynskyi, Shilin, Pershakov, Meiyu and Ta2022f).
To determine the angular orientation of a system, it is necessary to evaluate the angle of deviation from the horizontal. Various MEMS sensors are commonly used to address this issue. The gyroscope measures angular velocity, which, when combined with known initial conditions, can be integrated over time to calculate the angular position of the sensor. High-precision gyroscopes, such as ring laser types, are too costly and bulky for many applications, so less accurate MEMS sensors are typically used. However, integrating gyroscope measurement errors leads to the accumulation of errors in the calculated orientation, meaning a gyroscope alone cannot provide an absolute orientation measurement. The accelerometer, which measures the Earth’s gravitational field, offers an absolute determination of orientation but is also susceptible to significant noise. To solve the problem of calculating a single value for the angular position, data from the accelerometer and gyroscope are filtered.
In this regard, the inclusion of advanced filtering algorithms enhances the module’s performance in various scenarios. Therefore, it is proposed to use the Kalman, Madgwick and complementary filters. The Kalman filter provides the highest accuracy during real-time applications, while the Madgwick filter proved effective in high-noise conditions. The complementary filter offered a practical alternative for simpler applications, demonstrating the module’s adaptability.
Thus, the Kalman filter is the foundation of most orientation determination algorithms. Its use demonstrates its accuracy and efficiency, though it has several drawbacks. Implementation can be complex and the linear regression of iterations requires a high sampling rate. Moreover, equations describing 3D rotational kinematics often involve large state vectors and may require an extended Kalman filter for linearisation. As a result, the Kalman solutions impose a significant computational load, motivating the development of alternative approaches. Many of these alternatives rely on fuzzy processing or a complementary filter, which combines accelerometer-based attitude determination at low angular velocities with gyroscope measurements at high angular velocities. Hence, this method is only effective under specific conditions.
In contrast, the Madgwick’s solution can be applied to systems with or without a magnetometer. The filter processes data from sensors, addressing accuracy issues and eliminating the need to set parameters based on the Kalman filter solutions. To represent orientation, the filter uses a quaternion, which describes 3D space position without the complications of Euler angles. For 3D measurement, sensors with three mutually orthogonal sensitivity axes are required (Skrypets et al., Reference Skrypets, Krasnov, Smolych and Kireev2014b). Accuracy in determining spatial orientation is crucial in aerospace, robotics, navigation, human motion analysis and human–machine interaction. While various methods exist for determining orientation, inertial systems offer a key advantage: they are self-sufficient, as their measurements are independent of the object’s motion, environment or location.
The practical implementation of the proposed methods can significantly enhance road and runway safety in Ukraine. The integration of MEMS technology addresses current gaps in monitoring and evaluation. However, several barriers must be addressed. The cost of developing and deploying advanced modules may be high. Proposed solutions include phased implementation and seeking international funding. Operators and engineers require specialised training. Training programs and user-friendly interfaces can mitigate this barrier. Compatibility with existing infrastructure and regulatory frameworks needs attention. Collaboration with stakeholders and alignment with ICAO standards are recommended. Suggested strategies include creating pilot projects, engaging international collaborators and leveraging government support to overcome these barriers.
The results of the study underscore the superiority of the MEMS technology over traditional geodetic methods. During the Kharkiv runway study, the module demonstrated exceptional precision in detecting both micro-roughness and macro-roughness. Measurement times were reduced by 50%, leading to substantial cost savings and operational efficiency. The system also provided detailed, actionable data for targeted maintenance, significantly enhancing cost-effectiveness and safety outcomes. The module’s portability and ease of operation make it a versatile tool for a wide range of applications.
The developed MEMS technology outperformed traditional geodetic methods in accuracy and ease of use. In the study carried out on Kharkiv runway, the module identified micro-roughness and macro-roughness with greater precision, reduced measurement time by 50% and provided detailed data that traditional methods could not capture. A cost–benefit analysis indicates that large-scale adoption could be economically viable within three years. Initial trials suggest significant reductions in labour costs and improved safety outcomes. The module’s portability and ease of operation make it suitable for widespread use in both urban and rural settings.
The effectiveness of modern measuring techniques for the assessment of pavement slopes and flatness is evidenced in different regions. For example, in Canada, the deployment of mobile measuring systems led to a 30% reduction in maintenance costs due to better planning and earlier identification of problems. Moreover, the U.S. Federal Highway Administration (FHWA) uses the International Roughness Index (IRI) to assess pavement smoothness, which could be integrated into Ukraine’s system to provide a clear benchmark. The FHWA supported the adoption of mobile measuring systems for routine pavement condition monitoring. Senseney and Suermann (Reference Senseney and Suermann2021) established that the introduction of mobile mapping systems resulted in a 25% reduction in long-term maintenance expenses, while improving the precision of flatness and slope measurements. Similarly, a large-scale project in Germany evaluated the performance of lidar-equipped mobile systems for highway assessments. Ahlefeldt et al. (Reference Ahlefeldt, Haxter, Spehr, Ernst and Kleindienst2021) established that lidar systems significantly outperformed conventional methods in terms of accuracy and data processing time. In the aviation sector, runway safety is paramount, and accurate assessment of runway flatness and slope is critical for preventing accidents. The results showed that this approach provided real-time, high-precision data and reduced the time required for runway inspections by over 50%.
Consequently, the analysis of projects or technologies successfully implemented in other countries strengthen the argument for adopting these methods in Ukraine. As a result, it is possible to develop a plan for implementing MEMS technology in Ukraine, consisting of four phases. The first one is the pilot projects and testing, which should take up to 12 months. At this stage, it is necessary to select high-priority regions (e.g. major highways, international airports) for initial pilot projects, prioritising areas with serious issues or safety concerns. Moreover, it is important to provide the necessary mobile measuring equipment and set up the data infrastructure. Apart from that, technicians, engineers and operators should be trained in using the new equipment and analysing the data. At this stage, data on pavement conditions is collected.
The second phase presupposes the evaluation and adjustment of the data, which should take 1–2 years. It involves the analysis of the data obtained during the pilot phase to identify trends, issues and any adjustments that need to be made to the technology or methods. After that, a detailed report should be provided on the findings. The next phase, which should last 2–5 years, is the nationwide rollout. Based on the success of the pilot projects, the use of mobile measuring systems should be expanded to other regions of Ukraine, including rural roads and secondary airports. After that, it is necessary to integrate the data into Ukraine’s national transportation monitoring system to create a comprehensive view of pavement conditions across the country. The final phase involves the continuous support and improvement. To achieve it, it is important to create long-term maintenance and calibration programmes to ensure the mobile units continue to operate at peak efficiency. In addition, it is crucial to upgrade software and hardware regularly to keep pace with technological advancements, ensuring that Ukraine’s infrastructure remains on the cutting edge.
5. Conclusions
The aim of the research was to analyse the shortcomings of the existing methods that are used to assess the evenness and slopes of the road and airfield pavement surfaces and develop innovative methods and modules for comprehensive slope and flatness measurement, incorporating MEMS technology to align with global best practices. As a result, this study introduces a novel approach to assessing slopes and flatness of road and airfield pavements using MEMS technology. The findings confirm the module’s superior performance compared with traditional methods, providing enhanced measurement capabilities and aligning with international standards. The proposed system offers a scalable solution for improving transport safety, with detailed strategies for phased implementation, training and stakeholder collaboration.
Moreover, a mathematical model of the pavement’s longitudinal profile was developed, represented as a set of irregularities, with wavelength values randomly generated from a range corresponding to real-world values, as specified by regulatory documents and ICAO recommendations. The spectral method for assessing road and airfield surface slopes and flatness was enhanced, enabling the division of the entire irregularity spectrum into frequency ranges for independent analysis. This method also allows for the reproduction of the surface profile without the macroroughness frequency components (with wavelengths of approximately 100 m), facilitating an assessment of the coating’s evenness.
Basis on the developed and manufactured laboratory setup, an algorithm for integrating data from MEMS sensors was determined through experimental studies. Thus, the best accuracy indicators were found for the Kalman filter, which was used to develop the layout of the MP. The possibility and expediency of using MEMS technologies for measuring the surface profile parameters of road and airfield pavements were substantiated.
A layout for the MP was developed to conduct research on runway fragments at an international airport. The findings confirmed that the slopes and irregularities of individual slabs and their fragments can be measured quickly and accurately without the use of geodetic instruments or rulers, simplifying the measurement process. However, the platform design lacks the ability to measure the entire frequency range of irregularities (e.g. roughness) due to the fixed wheelbase length. To address this, a device was developed that used the triangulation method to measure roughness with a resolution of 0.9 mm. An indicator-based approach for monitoring transverse slopes was created, based on current regulatory standards.
Despite these advancements, further improvements are necessary. Integrating automated roughness measurement into the system would expand its functionality, while optimising design and manufacturing processes could reduce costs. Enhancing user interfaces and visualisation tools will improve usability and accessibility. Future research will explore adaptive algorithms for real-time correction and cloud-based data storage for centralised analysis, ensuring that the system remains at the forefront of technological innovation. The integration of machine learning and AI into pavement monitoring systems further enhances their predictive capabilities, enabling better planning and maintenance. However, the adoption of these technologies faces challenges related to cost, infrastructure integration and data management. Future research should focus on overcoming these barriers while exploring the potential of emerging technologies to further improve pavement surface assessment.
Funding
This research project was supported by funding from the Science and Technology Department of Ningxia, the Scientific Research Fun of North Minzu University (No. 2020KYQD40).