Type 1 diabetes mellitus occurs because of autoimmune destruction of pancreatic beta cells causing insufficient insulin production and eventually hyperglycaemia. Both genetic and environmental factors lead to immune-mediated loss of beta cell function, which causes hyperglycaemia and lifelong insulin dependence. Reference Nathan, Genuth and Lachin1 The fact that more diagnoses are made in the fall and winter months indicates that there are seasonal changes. Unlike most autoimmune diseases, type 1 diabetes is slightly more common in men. Reference Atkinson, Eisenbarth and Michels2 Type 2 diabetes mellitus is a complex metabolic disorder that is related to several factors including genetic, social, environmental and behavioural factors. Reference Pulungan, Afifa and Annisa3 The prevalence of type 1 and type 2 diabetes mellitus is gradually increasing. With the development in the early diagnosis of cardiovascular diseases, it has become possible to prevent cardiac complications of diabetes in the early period. Cardiovascular diseases in diabetes patients manifest as macrovascular diseases involving cerebrovascular events, peripheral vascular disease, cardiac dysfunction and myocardial ischaemia, and these are the major causes of morbidity and mortality in both type 1 and type 2 diabetes mellitus. Reference Laing, Swerdlow and Slater4
Cardiovascular diseases are the most common cause of death in type 1 diabetes mellitus patients. It has been determined that cardiovascular diseases constitute about 67% of deaths in the third decade after the diagnosis of type 1 diabetes mellitus. Reference Orchard5 In a study, it was found that good glycaemic control in type 1 diabetes mellitus patients reduces the risk of cardiovascular diseases by 57%. Reference Nathan, Cleary and Backlund6 In another study, it was stated that each 1% reduction in haemoglobin A1c reduces the risk of coronary artery disease by 23%. Reference Prince, Becker, Costacou, Miller and Orchard7 Type 1 diabetes mellitus is also an important risk factor for coronary heart disease, heart failure, peripheral artery disease, atrial fibrillation, chronic kidney failure and stroke. It is also associated with an increased risk of death. Reference Vasiliadis, Kolovou, Mavrogeni, Nair and Mikhailidis8 The interval between the beginning of the QRS complex and the end of the T wave on an electrocardiogram reflects ventricular depolarisation and repolarisation. Cardiac electrical remodeling during ventricular repolarisation can cause fatal arrhythmias. The risk of sudden death in patients with type 1 diabetes mellitus is also increased. Accordingly, prolonged repolarisation has been thought to play a role in sudden death among patients with type 1 diabetes mellitus. Reference Weston9
Materials and methods
Study population
Sixty paediatric patients diagnosed with type 1 diabetes mellitus admitted to the paediatric endocrinology policlinic of our hospital between March 1, 2020 and September 1, 2020; and 86 healthy children admitted to our polyclinics with non-specific complaints who had no pathological findings, and were of similar age and gender compared to the patient group, were included in our study. Participants in the patient group with other endocrine disorders (such as hypothyroidism, Cushing and growth hormone deficiency), other known chronic diseases, congenital heart defect and a history of medication usage that could have an effect on heart function and cardiac rhythm were excluded from the study. Informed consent was obtained from all participants and/or their families. Ethics committee approval for the study was obtained from the ethics committee of our hospital.
Electrocardiography
12-lead electrocardiography was performed in all participants with a paper speed of 25 mm per second, after at least a 10-minute rest. ECG assessment was performed by two cardiologists. In all leads, resting heart rate, QRS duration, QT minimum (QT min), QT maximum (QT max), QT dispersion (QTd), QTc minimum (QTc min), QTc maximum (QTc max), QTc dispersion (QTdc), Tp-e maximum (Tp-e max), JT, JTc intervals, Tp-e maximum/QT maximum (Tp-e max/QT-max), Tp-e maximum/QTc maximum (Tp-e max/QTc max) ratios were measured as ECG parameters and mean values were calculated. The QT interval was defined as the distance from the beginning of the Q wave to the end of the T wave. If U waves were present, the QT interval was measured at the lowest point of the curve between the T and U waves. The RR interval measurement was used to calculate the heart rate, and to correct the QT interval (QTc) using the Bazett’s Formula. The QTc and corrected QT dispersion (QTdc) were calculated using the Bazett’s formula (QTc = QT/√RR). The QT dispersion (QTd) was determined as the difference between the maximum and minimum QT intervals in different leads. The Tp-e interval was defined from the peak of the T wave to the end of the T wave. The Tp-e intervals were measured from the precordial leads. The Tp-e/QT max and
Tp-e/QTc max ratios were also calculated. The JT interval, which is the distance from the beginning of the J wave to the end of the T wave, was calculated by subtracting the QRS duration from the QT interval; and the JTc was calculated by subtracting the QRS duration from the QTc interval, using the Bazett’s formula (JTc = JT / √RR). In the 12-lead electrocardiography of the patient and control groups performed while resting, resting heart rate, QRS duration, QT min, QT max, QTd, QTc min, QTc max, QTdc, Tp-e max, JT, JTc intervals, Tp-e max/QT max, Tp-e max/QTc max ratios; and in the echocardiography ejection fraction, fractional shortening, left ventricular end-diastolic diameter and left ventricular end-systolic diameter were measured. In addition, age, gender, height, weight, body mass index and blood pressure values were compared.
Statistical analysis
Continuous variables were expressed as mean ± standard deviation, and categorical variables as percentages. The Student’s t-test or the Mann–Whitney U test was used for the comparison of the continuous variables, and the Chi-square test was used for the comparison of the categorical variables. A p-value of <0.05. was defined as statistically significant in our study
Results
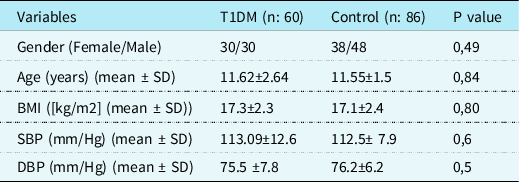
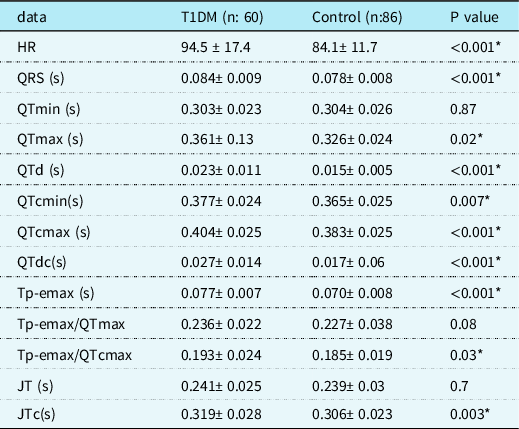
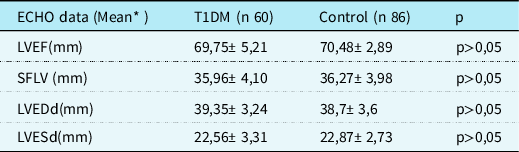
Sixty patients diagnosed with type 1 diabetes mellitus and 86 controls who were compatible with the patient group in terms of age and gender were included in our study. No significant difference was found between the patient and control groups in terms of mean age, systolic blood pressure, diastolic blood pressure, body mass index and gender (Table 1). The mean duration of diabetes in our patients with type 1 diabetes mellitus was 5.23 ± 1.76 years and the mean haemoglobin A1c levels were 9.63% ± 1.75%. The heart rate, QRS, QT max, QT dispersion, QTc minimum, QTc maximum, QTc dispersion, Tp-e maximum, Tp-e maximum/QTc maximum and JTc were significantly higher in the patient group compared to the control group (Table 2). There was no significant correlation between the duration of type 1 diabetes mellitus and haemoglobin A1c levels and the electrocardiographic data. Left ventricular ejection fraction, fractional shortening of the left ventricle, left ventricular end-diastolic diameter, left ventricular end-systolic diameter measurements of the two groups were compared according to the echocardiography findings and no statistically significant difference was found (Table 3).
Comparison of demographic data and laboratory findings of the T1DM control groups
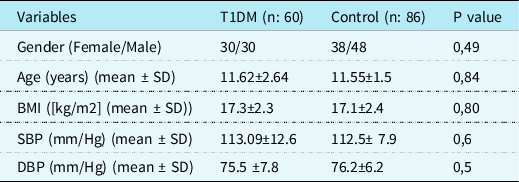
Mean ± standard deviation, n: number of patients,
BMI: Body mass index, SBP: systolic arterial blood pressure, DBP: diastolic arterial blood pressure
Comparison of electrocardiographic (ECG) data of T1DM and control groups ECG
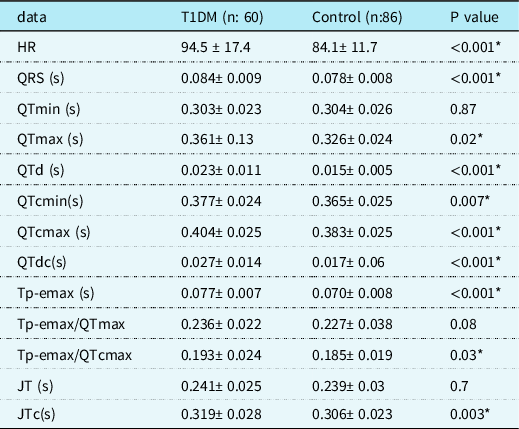
*Statistically significant
Mean ± standard deviation, n: number of patients, HR: Heart rate, QRS: QRS interval, QTmin: QTminimum, QTmax: QTmaximum, QTd: QTdispersion, QTcmin: QTc minimum, QTcmax: QTcmaximum, QTdc: QTc dispersion, Tp-emax: Tp-e maximum, Tp-emax/QTmax: Tp-emaximum/QTmaximum. Tp-emax/QTcmax: Tp-emaximum/QTcmaximum, JT: interval from the end of the QRS complex (J point) to the end of the T wave, JTc: corrected JT interval
Comparison of Echocardiographic (ECHO) data of T1DM and control groups
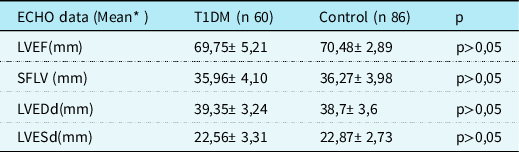
* Mean ± standard deviation
n: number of patients, LVEF: Left ventricular ejection fraction, SFLV: Shortening fraction of the left ventricle, LVEDd: Left ventricular end diastolic diameter, LVESd: Left ventricular end systolic diameter
Discussion
Although it is known that individuals with type 1 diabetes mellitus are at a high risk for cardiovascular disease, the underlying pathophysiology of the relationship between cardiovascular disease risk factors and type 1 diabetes mellitus is not fully understood. Adult patients diagnosed with type 1 diabetes mellitus are at risk for ventricular arrhythmias and sudden cardiac death. Reference Cox, AzeemA and etal10 The pathophysiological mechanisms behind arrhythmias in diabetic patients are not fully understood. Presence of reentry circuits, triggered activity and increased autonomy are considered as possible mechanisms for ventricular arrhythmias. Structural abnormalities caused by prolonged hyperglycaemia and increased fibrosis in the myocardium are also thought to cause arrhythmias. Reference Mandala and Di11 Myocardial fibrosis, and cell loss in the living myocardium can create a favourable environment for the formation of micro-reentry circuits. Ventricular arrhythmias can also be triggered by the disrupted electrical balance of the heart and the contribution of increased sympathetic activity. Reference Piers, Everaerts and Van der Geest12 Electrocardiography abnormalities such as high resting heart rate, abnormal shift in electrocardiographic axes, prolonged PR interval, prolonged QRS duration and prolonged QT interval are associated with cardiovascular risk. Reference O’Neil, Hoekstra and Pride13 Although many studies conducted in general population have shown an association between the corrected QT interval and all-cause mortality and cardiovascular death, the risk is higher in the more extreme QTc values. Reference Montanez, Ruskin, Hebert, Lamas and Hennekens14
QT, QTc and QTd have been used for predicting ventricular arrhythmic events and sudden death. Reference Vrtovec, Delgado and Zewail15 The QT interval represents the duration from the beginning of ventricular depolarisation until the end of repolarisation. The QT interval is an independent predictor of cardiovascular mortality in individuals with type 2 diabetes. Reference Cox, Azeem and Yeboah16 QTc increase has been shown in many cardiovascular and non-cardiovascular diseases. Reference Okin, Devereux, Howard, Fabsitz, Lee and Welty17 QTc prolongation is thought to be an independent marker of ventricular arrhythmias, sudden death and increased mortality in patients with type 1 diabetes mellitus. Reference Rossing, Breum and Major-Pedersen18 It has been shown that there is a positive correlation between QTc prolongation and age, the duration of diabetes, and poor metabolic control in adult patients diagnosed with type 1 diabetes mellitus. Reference Giunti, Bruno and Lillaz19 QTd, defined as the difference between the maximum and minimum QT intervals, represents the heterogeneity of ventricular repolarisation and is reported to be a predictor of ventricular arrhythmias. Reference Piccirillo, Magri and Matera20 Increased QTd has also been associated with sudden cardiac death. Tokatlı et al. reported prolonged QTd in patients with type 2 diabetes mellitus compared to controls. Reference Tokatli, Kilicaslan, Alis, Yiginer and Uzun21 Uysal et al. found QTc and QTdc prolongation in children and adolescents with type 1 diabetes mellitus. Reference Uysal, Ozboyaci, Bostan, Saglam, Semizel and Cil22 However, this prolongation was not found to be associated with the duration of the disease and glycaemic control, which can be explained by the relatively young age and short disease duration, as it was in our study.
The QT interval consists of depolarisation and repolarisation components and is also affected by the QRS duration. However, the JT interval is the component of the QT interval, which alone reflects ventricular repolarisation. It has been suggested that the JT interval may be a more specific marker of repolarisation than the QT interval. Reference Spodick23 The JT interval may also be affected by the heart rate. Therefore, it may be more convenient to use JTc. Alizade et al. have reported that prolonged JTc is associated with ventricular arrhythmias. Reference Alizade, Avcı and Fidan24
The Tp-e interval is the electrocardiography parameter that indicates ventricular repolarisation. It has been associated with ventricular arrhythmias and sudden death, even in patients with normal QTc. The Tp-e/QT ratio has also recently been used as a new electrocardiographic marker for repolarisation and has been reported to be associated with malignant ventricular arrhythmias. Reference Antzelevitch and Oliva25 Transmural dispersion of repolarisation, which is calculated as the interval between the peak and the end of the T wave on the electrocardiogram, has been associated with ventricular arrhythmias and sudden cardiac death. Reference Castro Hevia, Antzelevitch and Tornés Bárzaga26 Recent studies have shown that the Tp-e interval, Tp-e/QT ratio and Tp-e/QTc ratio can be used as an index of the distribution of repolarisation. Reference Kors, Ritsema van Eck and van Herpen27 In addition, these markers can be used as the electrocardiographic index of ventricular arrhythmogenesis and sudden cardiac death [26]. Previous studies have shown that the Tp-e interval and Tp-e/QT ratio are associated with an increased risk of malignant ventricular arrhythmias. Reference Castro Hevia, Antzelevitch and Tornés Bárzaga26,Reference Erikssen, Liestøl, Gullestad, Haugaa, Bendz and Amlie28
In a recent study conducted in adult patients, the heart rate, QTc, QTd, QTdc, Tp-e and JTc intervals, Tp-e/QT ratio and Tp-e/QTc ratio were significantly higher in type 1 diabetes mellituspatients compared to the control group, and a significant correlation was found between the type 1 diabetes mellitus duration and haemoglobin A1c levels and between the QTc, QTd, QTdc, Tp-e and JTc intervals and Tp-e/QT and Tp-e/QTc ratios. Reference Inanır, Gunes, Sincer and Erdal29 Although our patients were children, the QT max, QTd, QTc min, QTc max, QTdc, Tp-e max, Tp-e max/QTc max and JTc data were found to be significantly higher than the control group. However, we did not find a positive correlation between the electrocardiographic data and the type 1 diabetes mellitus duration and haemoglobin A1c levels since our patients were children, and the duration of diagnosis and follow-up was short. Nevertheless, we think that with increasing age, a correlation will be detected in our patients as it was in studies conducted in adults.
Conclusion
Arrhythmias and sudden cardiac death are more common in adult patients with diabetes mellitus than in the control group with the same age and gender. Therefore, physicians who undertake the follow-up and treatment of patients with diabetes mellitus should be aware of the increased risk of arrhythmias in their patients. However, this risk of arrhythmia is not certain in children diagnosed with type 1 diabetes mellitus. In our study, the fact that the data of QT max, QTd, QTc min, QTc max, QTdc, Tp-e max, Tp-e max/QTc max and JTc were significantly higher in the children with type 1 diabetes mellitus indicates that children with type 1 diabetes mellitus might be prone to ventricular arrhythmias. However, we believe that more studies on this subject, in which children are followed up for longer periods are necessary.
Limitations of the study
One of the limitations of our study; it was conducted as a single-centre study with a small number of patients. The results of our study and our thesis should be supported by studies with more populations. Another limitation may be that the electrocardiographic measurements were calculated manually rather than using computer-aided calculations. An important limitation is the lack of clinical follow-up of the patients for arrhythmias and sudden death. More studies with higher number of patients and longer follow-up periods are needed to increase the accuracy of the results.
Acknowledgements
None.
Financial support
This research received no specific grant from any funding agency, commercial or not-for-profit sectors.
Conflicts of interest
None.
Ethical standards
This article does not contain any studies with human participants or animals performed by any of the authors.
Authors’ contributions
MT and AA: Concept, patient management, radiosurgery, manuscript writing, review, critical evaluation, submission; EU and AK: Patient management, critical evaluation of manuscript; AK: Patient management, critical evaluation of manuscript, endocrinological management; SS, and MT: Radiotherapy, patient management; AA, and SS: Radiology support, patient management; MT and AK: Patient management, literature review; EU: Literature review and administration support. MT: will act as guarantor for this paper.