I. INTRODUCTION
SnO2 is a semiconductor oxide widely used as transparent conductive layers, oxidation catalysts, gas sensors, and other technologies. Reference Yamazoe1–Reference Park and Akbar3 The control of its microstructure upon synthesis and processing is therefore of key importance for the optimization of those devices. While processing conditions can be optimized by trial and error, a fundamental knowledge on the mechanisms and driving forces for mass transports can enable a more refined control of the microstructure and the development of new processing strategies. For SnO2, enabling high densification is particularly important for the fabrication of sputter targets. However, many reports have proposed that upon processing at high temperatures (sintering), SnO2 shows predominantly nondensification mechanisms, such as surface diffusion and evaporation–condensation mechanism. These mechanisms result in limited pore elimination and leading to difficulties in achieving high densities using conventional sintering on this material. Reference Gouvea, Smith, Bonnet and Varela4–Reference Maitre, Beyssen and Podor7
Leite et al. have shown that the oxygen atoms can desorb and rebond at the SnO2 surfaces at temperature above 600 °C, suggesting an active surface diffusion process, whereas the decomposition of SnO2 at temperatures around 1300 °C suggested that SnO2 was dynamically releasing oxygen atoms, suffering partial reduction to SnO and supporting the argument for an evaporation–condensation mechanism under that condition. Reference Leite, Cerri, Longo, Varela and Paskocima6 In a recent review by Batzill et al., it was also shown by a combination of experimental data on low energy He+ ion scattering spectroscopy (LEIS), low energy electron diffraction (LEED), scanning tunneling microscopy (STM), and density functional theory (DFT), that SnO2 surface planes indeed tend to lose oxygen atoms (reduction) under low chemical potential of oxygen (i.e., high temperature or low oxygen partial pressure). Reference Batzill, Katsiev, Burst, Diebold, Chaka and Delley8 Moreover, surface energies assessed by ab initio calculations from that work suggested that a reduced surface was more thermodynamically favorable than a fully oxidized (stoichiometric) surface at high temperatures. Reference Bergermayer and Tanaka9
The net surface energy decrease with increasing temperature predicted by Batzill et al. brings another possible explanation on the mechanisms behind the low densification behavior observed in tin dioxide. Reference Batzill, Katsiev, Burst, Diebold, Chaka and Delley8,Reference Bergermayer and Tanaka9 That is, the main driving force for sintering is the surface energy itself, so it is possible that the difficulty on densification of SnO2 is not only due to a nondensification mechanism, but also a thermodynamic condition inducing smaller sintering stresses.
The goal of this work is to provide direct experimental data on the thermodynamics of tin dioxide nanoparticles to evaluate if the predicted surface energy changes with temperature also apply during regular sintering conditions. Fully oxidized samples were compared with those quenched from sintering conditions, and interface energies (both surface and grain boundary) measured by both high-temperature oxide melt drop solution calorimetry Reference Navrotsky10–Reference Ma, Castro, Zhou and Navrotsky16 and water adsorption microcalorimetry. Reference Castro and Quach17 In addition, experimental assessment on the heat of adsorption of water on the surface of the SnO2 is reported and correlated with recent theoretical calculations. A discussion on the thermodynamic versus kinetic effects on the sintering of SnO2 is finally presented.
II. METHODOLOGIES
A. High-temperature oxide melt drop solution calorimetry
High-temperature oxide melt drop solution calorimetry has been extensively used to successfully assess the surface and grain boundary energies of oxides. Reference Navrotsky10,Reference Castro, Ushakov, Gengembre, Gouvea and Navrotsky13–Reference Ma, Castro, Zhou and Navrotsky16 The calorimeter used in this work is a custom-built Calvet-type twin microcalorimeter. Reference Navrotsky10 The principle of the methods is that samples with different interface areas are dissolved in a high temperature molten oxide solvent, and the heats are correlated to the interfacial energies by a thermochemical cycle. The cycle of this study is listed in details below:
 $$\Delta {H_1} =\; {\rm{Sn}}{{\rm{O}}_2} \cdot x{{\rm{H}}_{\rm{2}}}{\rm{O}}\left( {{\rm{hydrous}},\;{A_{\rm{S}}},{A_{{\rm{GB}}}},\;25^\circ {\rm{C}}} \right) \to {\rm{Sn}}{{\rm{O}}_{\rm{2}}}\left( {{\rm{dissolved}}\;{\rm{in}}\;{\rm{2PbO}} \cdot {{\rm{B}}_{\rm{2}}}{{\rm{O}}_{\rm{3}}}{\rm{,}}\;{\rm{800^\circ C}}} \right) + x{{\rm{H}}_{\rm{2}}}{\rm{O}}\left( {{\rm{gas,}}\;{\rm{800^\circ C}}} \right)\quad,$$
 $$x\Delta {H_{\rm{2}}} = x{{\rm{H}}_{\rm{2}}}{\rm{O}}\left( {{\rm{gas}},\;800^\circ {\rm{C}}} \right) \to x{{\rm{H}}_{\rm{2}}}{\rm{O}}\left( {{\rm{g}},\;25^\circ {\rm{C}}} \right)\quad,$$
 $$\Delta {H_3} =\; {\rm{Sn}}{{\rm{O}}_2}\left( {{\rm{anhydrous}},\;{A_{\rm{S}}},\;{A_{{\rm{GB}}}},\;25^\circ {\rm{C}}} \right) + x{{\rm{H}}_{\rm{2}}}{\rm{O}}\left( {{\rm{g}},\;{\rm{25^\circ C}}} \right) \to {\rm{Sn}}{{\rm{O}}_{\rm{2}}} \cdot x{{\rm{H}}_{\rm{2}}}{\rm{O}}\left( {{\rm{hydrous}},\;{A_{\rm{S}}},\;{A_{{\rm{GB}}}},\;25{\rm{^\circ C}}} \right)\quad,$$
 $$\Delta {H_{\rm{4}}} =\; {\rm{Sn}}{{\rm{O}}_{\rm{2}}}\left( {{\rm{bulk}},\;25^\circ {\rm{C}}} \right) \to {\rm{Sn}}{{\rm{O}}_{\rm{2}}}\left( {{\rm{dissolved}}\;{\rm{in}}\;{\rm{2PbO}} \cdot {{\rm{B}}_{\rm{2}}}{{\rm{O}}_{\rm{3}}},\;800^\circ {\rm{C}}} \right)\quad,$$
 $$\Delta {H_5} =\; {\rm{Sn}}{{\rm{O}}_{\rm{2}}}\left( {{\rm{bulk}},\;25^\circ {\rm{C}}} \right) \to {\rm{Sn}}{{\rm{O}}_{\rm{2}}}\left( {{\rm{anhydrous}},\;{A_{\rm{S}}},\;{A_{{\rm{GB}}}},25^\circ {\rm{C}}} \right)\quad,$$
 $$\Delta {H_5} = - (\Delta {H_1} + x\Delta {H_2} + \Delta {H_3}) + \Delta {H_4}\quad,$$
 $$\Delta {H_5} = \Delta {H_{{\rm{exs}}}} = {\gamma _{\rm{s}}}{A_{\rm{S}}} + {\gamma _{{\rm{GB}}}}{A_{{\rm{GB}}}}\quad,$$
where A S, A GB, γS, and γGB represent surface areas, grain boundary areas, surface energies, and grain boundary energies, respectively; x represents the adsorbed water content on surfaces per mole samples. Typically, oxide nanopowders are hydrated because of their intrinsically high specific surface and hydroscopic features. To get anhydrous surface energies, the contribution of water indicated in Eqs. (2) and (3) has to be known. Therefore, the excess enthalpies (ΔH exs) after water correction with respect to bulk SnO2 can be determined by ΔH 5 in Eq. (6). With good compositional and microstructural characterization, ΔH 5 can be unambiguously attributed to total surface and grain boundary energies, which were directly proportional to their respective interface areas, as expressed in Eq. (7). Since A S, A GB, and ΔH exs are experimental quantities, the unknown variables, γS and γGB can be calculated by their related expressions. Reference Castro and Wang15
B. Water adsorption microcalorimetry
Castro and Quach have developed a method to assess the surface energies of oxide nanoparticles by using water adsorption microcalorimetry. Reference Castro and Quach17 In this method, the heat of adsorption of water molecules on SnO2 nanoparticles (ΔH ads, kJ mol−1) is monitored as a function of the water coverage (adsorbed water amount on the surface). While one may expect a strong interaction between the surface and the water molecules at low coverage (close to anhydrous state), with a high enthalpy of adsorption, as coverage increases the energy of adsorption decreases. Eventually a thick layer of water is formed on the surface of the particle and the interaction energy between the surfaces and the water molecules is equivalent to the heat of liquefaction of water (−44 kJ mol−1). This experimental evidence suggests that the surface is on a liquid-like state, Reference Asay and Kim18 and therefore surface energy at that coverage must be equal to 0.072 J m−2, as in liquid water.
Anhydrous surface energy can then be calculated using Eq. (8): Reference Castro and Quach17
 $${\gamma _S} = \gamma _S^0 + \theta \cdot \Delta {H_{{\rm{ads}}}}\quad,$$
where θ is water coverage on the surface, γS is the surface energy at that given coverage, and
 $\gamma _S^0$
is the surface energy of anhydrous surfaces. Based on the equation, one may calculate the anhydrous surface energy if the coverage at which γS is equal to liquid-water surface tension is known. This is achieved by defining the coverage where the heat of water adsorption becomes −44 kJ mol−1 in a curve of heat of adsorption as a function of coverage. Note that defining the exact first point where the surface achieves 0.072 J m−2 is very critical for this model, since further adsorption results in the same heat of adsorption but no changes on the surface energy. That is, the contribution of the chemical potential change of water molecules themselves to the system is negligible with relation to the heat of adsorption at relatively low coverage, but increases at high pressures, such that Eq. (8) would be no longer valid.
1. Determining grain boundary area
One of the critical points on transposing the excess energies measured from calorimetry into interface energies is the accurate quantification of their areas. The grain boundary areas can be estimated by the difference between the total interfacial area, calculated from the crystallite sizes, and the surface areas as follows: Reference Costa, Ushakov, Castro, Navrotsky and Muccillo14
 $${A_{{\rm{GB}}}} = {{{A_{\rm{I}}} - {A_{\rm{S}}}} \over 2}\quad,$$
 $${A_{\rm{I}}} = {{6{M_{\rm{w}}}} \over {{\rho _{\rm{T}}} \cdot D}}\quad,$$
where A I is the total interface area available in the system estimated by the crystallite size, D is the average diameter of the grains, M w is the molecular weight, and ρT is the theoretical density of samples. Note that Eq. (10) assumes that the grains are isolated, identical, and spherical. While these conditions cannot be fully satisfied, relatively isotropic and a narrow size distribution (studied by TEM/STEM) can satisfactorily enable a spherical-like analogy of the system. Based on microscopic images of our SnO2 samples this simplification is justifiable as the projections of particles are satisfactorily spherical-like. For the sake of the exercise, if one assumes however the particles are dodecahedrons, and the crystallite size corresponds to the diameter of inscribed sphere inside the dodecahedron, comparing to spherical-like numbers, the grain boundary areas would only show a ∼0.15 to 1.5% difference, which is smaller than the error bar of the interfacial energies as detailed in Table II.
III. EXPERIMENTAL SECTION
A. Synthesis and characterization techniques
SnO2 nanoparticles were synthesized by a polymeric precursor method. Reference Deacon, Mahon, Molloy and Waterfield19–Reference Leite, Weber, Longo and Varela21 The metal cation precursor was tin (II) citrate prepared from citric acid (Sigma-Aldrich, 99%) and tin (II) chloride (Alfa Aesar, 99%) in molar ratio 1:2. Citric acid and ethylene glycol (Sigma-Aldrich, 99.8%) were mixing at 90 °C till entirely dissolved, then metal cation precursors were added at this moment. The molar ratio of metal ions, citric acid and ethylene glycol was 1:4:16. Nitric acid was added to the premixed solution until transparency was achieved, indicating full dissolution. The resulted solution was heated up to 140 °C for 30 min and NO x (yellow) gas evolved during polyesterification. The obtained resin had a dark brown color and was heated to 450 °C for 4 h for combustion of most polymeric chains and induction of oxide nucleation process. A carbon-rich powder was obtained and ground on an agate mortar. The sample was annealed at 500 °C for 15 h to remove the residual carbon compounds and finish nucleation and growth of particles.
As-synthesized nanoparticles were characterized by x-ray diffraction (XRD) to determine the crystallographic phase and to estimate the nanocrystalline sizes using a Bruker AXS instrument (model D8 Advance; Bruker AXS Inc., Madison, WI; Cu Kα, radiation λ = 1.5418 Å). Fourier transformed infrared spectroscopy (Equinox 55 FTIR spectrometer, Bruker Inc., Billerica, MA) was used to detect contaminations, especially the carbonate residual due to the non-fully combusted polymers.
For the calorimetric studies, two sets of samples were produced; one representing the powder-like fully oxidized state, and another sampling the effects of sintering condition. For the former we used (P1) the powder without further treatment (as synthesized, i.e., only treated at 500 °C for 15 h), (P2) as-synthesized further treated at 600 °C for 5 h, and (P3) as-synthesized further treated at 600 °C for 15 h. The different annealing conditions caused distinct levels of coarsening and grain boundary, leading to samples with different amounts of surface and grain boundary areas. These were required for the calorimetric tests.
Sintered sample (PS) was prepared at high temperature. The as-synthesized powder was compacted as pellets of 3 mm-diameter, under constant pressure of 767 MPa. Pellets had about 40 mg, with a ratio of diameter to height of around 1.5 (varied with pellet mass). Pellets were sintered at 1300 °C for 30 s in a tube furnace (Lindberg/Blue M, Asheville, NC). The temperature selection was based on the prediction of critical temperature for forced surface reduction from individual planes Reference Bergermayer and Tanaka9 :
 $${\rm{for}}\;{\rm{Sn}}{{\rm{O}}_{\rm{2}}}{\rm{(110),}}\;\log \;{P_{{{\rm{O}}_2}}} = - {{21538} \over {\left( {{T_{\rm{c}}} + 273} \right)}} + 12.92\quad,$$
 $${\rm{for}}\;{\rm{Sn}}{{\rm{O}}_2}(101),\;\log \;{P_{{{\rm{O}}_{\rm{2}}}}} = - {{13659} \over {\left( {{T_{\rm{c}}} + 273} \right)}} + 11.95\quad,$$
where
 ${P_{\rm{O}}}_{_2}$
is the partial pressure of oxygen in atm and T
c is the critical temperature in °C. The surfaces begin to reduce once the temperature is over the critical temperature. The critical temperature of SnO2(110) is ∼1300 °C, whereas for SnO2(101) is ∼800 °C at 1 atm of air. Interestingly, 1300 °C is a common SnO2 sintering temperature and significant weight loss is expected when temperatures are above it, supporting the surface reduction as well.
Reference Leite, Cerri, Longo, Varela and Paskocima6
The samples were not sintered at higher temperatures or longer times to limit coarsening, since high surface areas are needed for the water adsorption microcalorimetry.
The surface areas were measured by Brunauer–Emmett–Teller (BET) method using Micromeritics ASAP 2020 apparatus (Micromeritics, Norcross, GA). Samples were degassed and reoxidized at proper conditions described clearly in the next section, and evacuated 2 h at 25 °C before BET measurement. The grain sizes of all samples were determined by XRD, and further reconfirmed by transmission electron microscopy (TEM and STEM) (JEOL JEM 2100F/Cs and JEOL 2500SE, 200 kV). Grain sizes from TEM/STEM were averages measured by using ImageJ software and from at least 150 grains from each sample.
B. Interface energy from high-temperature oxide melt drop solution calorimetry
SnO2 nanopowders were prepared with different calcination procedures as detailed in Sec. III. A to obtain variable surface and grain boundary areas suitable for calorimetric analysis of the interfacial quantities according to the thermochemical cycle in Eqs. (1)–(7). A bulk sample for reference was prepared by sintering nanopowders at 1200 °C for at least 12 h, where “bulk” means coarsened samples that the interface areas/energies of samples and water content are small and negligible in the overall measurement.
All samples were loosely compacted as pellets of about 5 mg in mass and dropped from 25 °C into a molten lead borate (2PbO·B2O3) solvent kept at 800 °C for dissolution. Concurrently, oxygen gas was bubbling through the solvent continuously at 40 mL min−1 flow rate to improve the dispersion and dissolution of samples and to ensure that the dissolved metal ions are at the highest oxidation state. Oxygen was also flushed over the solvent to purge out the water vapor released from samples during the dissolution reactions. Eight specimens of each sample were dropped to obtain error bars.
To assure constant water content on the nanoparticles, all samples were exposed to controlled humidity and temperature room (24 °C, 50% humidity) for one week for equilibration. The water content (x in Eq. (2)) was determined by thermogravimetric analysis (TGA) (Netzsch STA 449 system, Netzsch GmbH, Selb, Germany) at 10 °C/min from 25 to 450 °C and dwell at 450 °C for 5 h. The heat contribution of water desorption (∆H 2) was measured by water adsorption microcalorimetry using a combination of Micromeritics ASAP 2020 Adsorption Analyzer and Setaram DSC111 Calvet microcalorimeter (Setaram Instrumentation, Caluire, France), allowing direct measurements of the heat of water adsorption at different surface coverage at 25 °C. The instruments and methodology are described in more detail by Ushakov et al. Reference Ushakov and Navrotsky22 and Castro and Quach. Reference Castro and Quach17 All samples were degassed with equivalent heat treatment to the BET method, and evacuated for 3 h at 25 °C before the water adsorption experiment.
From the thermochemical cycle [Eqs. (1)–(7)] it is evident that every sample will create an equation with two variables (interfacial energies) after all measurements are performed. In principle only two expressions would be necessary to solve them. However, considering the uncertainties on the measurements of A S, A GB, and ΔH exs, and the naturally small values of interface energies to be assessed, multiple expressions were obtained by testing more a number of samples, and linear regression analysis using least roots square method was used to determine accurate interfacial energies. Therefore, four samples with different interface areas (including coarsened sample), with eight points each, enabled 32 individual expressions based on Eq. (7). Error bars were determined from the fitting.
C. Surface energy from water adsorption microcalorimetry
The required instrumentation for this method is the same described for water adsorption experiments described in Sec. III. B. Measurements were performed at 25 °C using satisfied powder to produce a total surface area of 2 m2. The dose amount of water was kept at 2 µmol per dose and equilibrated for at least 1 h between each dose. Each individual sample was tested three times and error bar was determined from the average and standard deviation of three runs.
D. Surface conditioning
To evaluate the anhydrous surfaces of fully oxidized SnO2 in both water adsorption and drop solution calorimetry experiments, the samples were degassed under vacuum (<5 × 10⁻¹⁰ atm) at 450 °C for 2.5 h. This temperature was determined according to TGA analysis to assure no mass loss due to water content. Though this method generates the desirable anhydrous surface, it is possible to induce reduced SnO2 surfaces at such low pressure condition. Reference Batzill, Katsiev, Burst, Diebold, Chaka and Delley8 Theoretical calculations from Eqs. (11) and (12) suggest that the critical temperature for reduction is ∼680 °C for SnO2(110) and ∼370 °C for SnO2(101) under 5 × 10⁻¹⁰ atm of pressure, Reference Bergermayer and Tanaka9 indicating that (101) is most likely reduced in the particles after the treatment. To allow reoxidization of the samples, they were placed under 0.4 atm of pure oxygen at 450 °C, followed by cooling to room temperature under the same atmosphere. At this pressure, reduction is only expected to occur at ∼1343 °C for SnO2(110) and ∼832 °C for SnO2(101), which are much higher than 450 °C, what guarantees fully oxidized stoichiometric surfaces.
Note that samples for the drop solution calorimetry were also treated using an equivalent degassing and reoxidizing procedure. Even though an as-synthesized sample usually maintains stoichiometric surfaces while stored at standard ambient temperature and pressure, a similar heat treatment was performed for precaution and consistency, since energetics of surfaces area sensitive to small surface chemistry changes. After the degassing and reoxidized procedure, the samples were stored in a calorimetric suite for a week as mentioned before.
To keep the surface state found at the high temperature (sintering conditions) while transporting them to the calorimeter for surface analysis, samples were taken off from the furnace then immediately threw into a well-sealed fork tube back filled with >1 atm nitrogen. The fork tube was quickly inserted onto the water adsorption microcalorimeter and evacuated for 3 h at 25 °C. This was designed to avoid reoxidation and water rebonding upon exposure to air. The samples were then tested for water adsorption as described above. Surface area was measured after the adsorption experiment to avoid any surface contamination.
IV. RESULTS AND DISCUSSION
A. Structural characterization of SnO2 nanoparticles
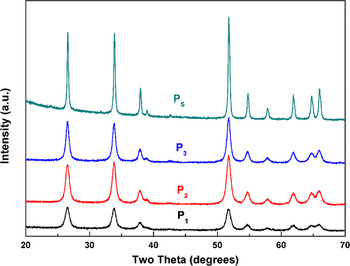
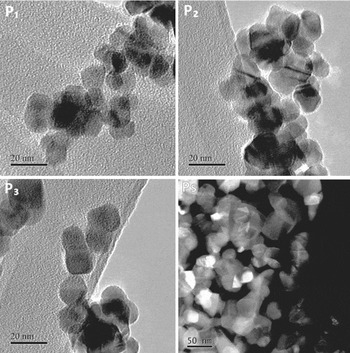
Figure 1 shows XRD patterns for the as-synthesized samples annealed through different heat treatments (named P1, P2, and P3), revealing SnO2 tetragonal phase (JCPDF# 41-1445), absence of second phases, and broad peaks due to small crystallite sizes. The morphology of SnO2 nanoparticles was observed by TEM and STEM as shown in Fig. 2. The images suggest relatively narrow size distribution and isotropic shapes. The clusters of nanoparticles suggest agglomeration, which is expected when using the polymeric precursor method, as described elsewhere. Reference Rufner, van Benthem and Castro23 The microstructure implies a significant area of grain boundary existing in each sample after annealing.
X-ray diffraction pattern of nanocrystalline tin dioxide synthesized by polymeric precursor method at different conditions. P1 is treated at 500 °C for 15 h, P2 was further treated at 600 °C for 5 h, P3 treated at 600 °C for 15 h, and PS was sintered at 1300 °C for 30 s.

The SnO2 nanoparticles annealed at different heat procedures: P1 at 500 °C for 15 h, P2 at 500 °C for 15 h then 600 °C for 5 h, P3 at 600 °C for 15 h, and PS at 1300 °C for 30 s. The morphology is observed from TEM and STEM images.

The grain sizes for each of the samples calculated from the surface area measured by BET, refinement of XRD peaks, and direct measurements from TEM/STEM images are listed in Table I. The grain sizes obtained from XRD patterns (GSXRD) increase from P1 to P3 systematically as expected (increasing temperature/time), and in good agreement with the observation of the TEM images (GSTEM). However, the grain sizes calculated from BET measurement (GSBET) were in average 10 nm higher as compared with either GSXRD or GSTEM. This is due to the significant agglomerations of particles that have conflicted with the premises of Eq. (10) that particles have to be isolated.
Grain sizes, interfacial areas, water content, and calorimetric data acquired for the different SnO2 samples. a

b Grain sizes are evaluated by BET measurement, XRD peaks, and TEM images, respectively. GSBET was back-calculated from A S by Eq. (10).
c A I is calculated from GSXRD by Eq. (10); A S is determined by the BET measurement; A GB is calculated by Eq. (9).
d Coverage is defined as number of water molecules per unit area, which can be evaluated from the total number of water molecules (derived from x) divides by total surface area (derived from A S) on a mole of SnO2.
e ΔH ds is the experimental result directly obtained from the high-temperature oxide melt drop solution calorimeter; ΔH ds = ΔH 1.
f
ΔH
anhydrous is the heat content after corrected the contribution of adsorbed water; ΔH
anhydrous = ΔH
1 + xΔH
2 + ΔH
3, where ΔH
2 is given as
 $- 29.05\;{\rm{kJ}}\;\mathop {{\rm{mo}}{{\rm{l}}_{{{\rm{H}}_2}{\rm{O}}}}}\nolimits^{ - 1}$
; ΔH
3 was determined by the integral of heat of water adsorption up to corresponding θ upon the data shown in Fig. 3(b).
g ΔH exs = ΔH ds,bulk − ΔH anhydrous = ΔH 4 – (ΔH 1 + xΔH 2 + ΔH 3).
The sintered sample (PS) showed consistent XRD pattern with as-synthesized samples as shown in Fig. 1. Short-term time sintering did not apparently change its composition or phase. Figure 2 shows its high-angle annular dark field (HAADF) scanning transmission electron microscope (STEM) image. It is apparent that more agglomerations and coarsening occur in the nanoparticles after sintering. The average grain size from a series of STEM images is 39.95 ± 12.78 nm, which is consistent with that obtained from XRD. The big uncertainty in the result from STEM is because of the broad size distribution and the difficulty in determining grain edges in the images due to the porosity. This uncertainty will not affect energetic measurements as detailed later in the text.
B. Heats of water adsorption
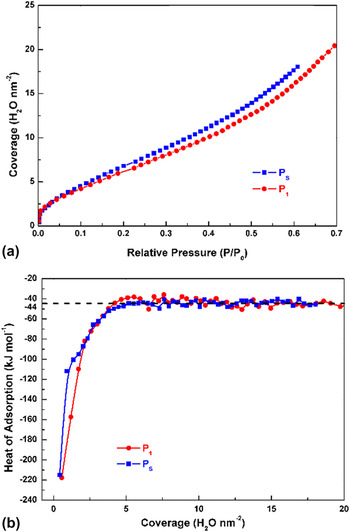
The energetics of water interactions with the fully oxidized (P1) and sintered (PS) SnO2 samples were studied by water adsorption microcalorimetry. Figure 3(a) shows the adsorption isotherm as a function of relative pressure for both samples. The isotherm curves of both samples displayed three clear adsorption stages, consistently with adsorption mechanisms proposed by Asay and Kim. Reference Asay and Kim18 The first stage (below 0.016 of relative pressure) exhibits a rapid increase of coverage with the increased pressure. This behavior indicates a strong chemical interaction between water molecules and anhydrous surfaces of samples, representing typically a dissociative behavior where water molecules split into hydroxyl groups. The second stage displays a smaller slope of the isotherm up to about 0.4 of relative pressure. The decrease of slope suggests that the influence of particles' surface on adsorbed water molecules becomes weaker as coverage increases. At this point, one expects a change from a chemisorption (dissociative) behavior to a physisorption (nondissociative or molecular) one. After that, the slope of isotherm raises again to the third stage up to higher pressure. At this pressure, the surface is expected to be in the liquid-water like state, as we are approaching the saturation vapor pressure, as supported by molecular dynamics. Reference Castrillon, Giovambattista, Aksay and Debenedetti24
(a) The adsorption isotherm of water and (b) the heat of adsorption plotted versus water coverage of fully oxidized and reduced samples. The black dash line marked in (b) points out the heat of adsorption of bulk water at −44 kJ mol−1.

Looking closer into the absorption behavior one notes that the curves overlap for low coverage (low pressures), but P1 shows a clear lower adsorption as pressure increases, suggesting that the onset points for the water adsorption transitioning behavior occur at lower pressures for PS than P1, therefore a different surface chemistry.
Figure 3(b) shows the heat of adsorption plotted versus water coverage for PS and P1. Both curves show high heat of adsorption at lower coverage, with a rapid drop with increasing coverage and leveling at −44 kJ mol−1 for coverage around 7H2O nm−2. This behavior is consistent with the three stages of the isotherm; with heats of adsorption consistent with a dissociative behavior with proton transferring to oxygen bridges on the surface of SnO2 as predicted by Bandura et al. at low coverage, Reference Bandura, Sofo and Kubicki25 and a systematic decrease and leveling in a liquid water-like state. The highest measured heat was −218 kJ mol−1 for P1 and −215 kJ mol−1 for PS. This corresponds to the anhydrous surface state being exposed to 2 μmol g−1 of water. At this point, the surface is high reactive as suggested by the measured heats, and suggests a fully dissociative behavior in both cases.
For comparison with theoretical calculations available in the literature, one needs to determine the heat of adsorption for a monolayer of water. Assuming a molecule of water typically occupies 25 × 10−20 m2, one may calculate the coverage corresponding to a monolayer, and after integration, the heats are −124 kJ mol−1 for P1 and −104 kJ mol−1 for PS. Theoretical calculations on heat of water adsorption for a monolayer coverage of a stoichiometric surface have been reported to be −134 to −170 kJ mol−1 for (110) surface with dissociative water behavior, Reference Batzill, Bergermayer, Tanaka and Diebold26 and −146 kJ mol−1 for (101), also with dissociative behavior. For molecular adsorption, adsorption energy on (110) is reported from −112 kJ mol−1 and −95.06 kJ mol−1 for (101). Reference Hahn, Tricoli, Santarossa, Vargas and Baiker27 The numbers are very consistent with the value measured from water adsorption calorimetry and suggest that the surface of the particle is a composition of planes and even at low coverage most likely showing a mix of dissociative and molecular adsorption behavior.
It is important to note that the results present here contrast with those recently reported by Ma et al. using similar experimental techniques. Reference Ma, Castro, Zhou and Navrotsky16 Their work supports the adsorption energy as −152 kJ mol−1 for the first dose (2 μmol g−1), which is about 70 kJ mol−1 smaller in modulus than the data presented here. By comparing the degassing procedures, one may note that Ma et al. have not considered a possible reduction upon degassing, as no reoxidizing step was used to assure stoichiometric samples. On the other hand, it is not straight forward to compare results of particles prepared from different techniques. That is, while we have used a polymeric precursor method to synthesize our samples, Ma et al. have used an oxidation procedure from metallic tin. The method of preparation is well known to affect exposed planes and surface conditions, such that a direct comparison cannot be made without appropriate in-depth microstructural analysis.
The less exothermic heat of adsorption for the PS samples at the monolayer coverage suggests a different surface chemistry. The hypothesis is that at this sintering condition SnO2 surface is most likely reduced. By comparing the diagram proposed by Bergermayer and Tanaka, Reference Varela, Whittemore and Longo5,Reference Bergermayer and Tanaka9,Reference Batzill, Bergermayer, Tanaka and Diebold26 (101) is expected to be severed reduced and (110) only slightly as the sintering conditions lie on the top of the predicted critical temperature and pressure for reduction.
The adsorption energy for the reduced (101) surface has been reported as ∼ −35 kJ mol−1 by theoretical calculations, Reference Bandura, Sofo and Kubicki25 which is significantly smaller as compared to the stoichiometric surface. This was attributed to the fact that dissociative adsorption is less likely to occur. On the other hand, other authors have reported that for the (110) surface, reduced conditions will benefit dissociative behavior. Reference Santarossa, Hahn and Baiker28 This is because upon exposure to water molecules, the reduced state is first oxidized. This scenario suggests that reduced states would have higher heats of adsorption as the energy for oxidation is exothermic, and contrasts with the data we have acquired. However, we believe that at the experimental conditions during water adsorption microcalorimetry, i.e., at room temperature, there will not be enough activation energy for the full oxidation process to take place. The measured −104 kJ mol−1 value for the sintered samples would be therefore a composition of partially reduced surfaces and stoichiometric ones.
C. Surface energies from water adsorption
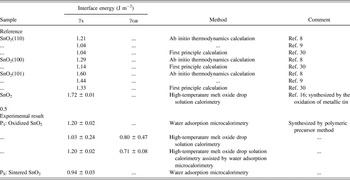
If the surface of the sintered sample shows signs of reduction, a different surface energy is expected. As proposed by Castro and Quach, Reference Castro and Quach17 the water adsorption calorimetry method can be used to determine surface energy, but the precise coverage where the surface begins to behave like bulk water must be determined. To quantify this point, we looked for a coverage corresponding to where the heat of adsorption leveled at −44 kJ mol−1 in Fig. 3(b). At this point, the second derivative of the adsorption isotherm curve is zero. Reference Castro and Quach17,Reference Al-Abadleh and Grassian29 The corresponding coverage is 10.13 H2O nm−2 for P1 and 5.68 H2O nm−2 for PS; the lower coverage of PS is in good agreement with the observation on isotherm curves that the transition region begins a small coverage on PS. By using Eq. (8), where γS was set as 0.072 J m−2, anhydrous surface energies for both stoichiometric and sintered (reduced) samples were listed in Table II. The surface energies of P1 and PS are 1.2 ± 0.02 J m−2 and 0.94 ± 0.03 J m−2, respectively, where the uncertainty of them is about 3%.
Surface and grain boundary energies of SnO2.

Other available data from the literature were also listed in Table II for reference. Ab-initio thermodynamics calculations have shown the surface energy of stoichiometric SnO2(110), (100), and (101) planes as 1.04–1.21, 1.29, and 1.44–1.60 J m−2, respectively. Reference Batzill, Katsiev, Burst, Diebold, Chaka and Delley8,Reference Bergermayer and Tanaka9 Other assessments of those energies upon first-principle calculation provide 1.04, 1.14, and 1.33 J m−2, respectively. Reference Oviedo and Gillan30 The trends are consistent with a lower energy for (110) surface, which suggests that during experiments, SnO2 particles are most likely composed by (110), as the thermodynamics will direct the probability of finding the planes as predicted by Wulff's figures. Reference Chiang, Birnie and Kingery31 Therefore, one can infer that the average surface energy of SnO2 particles is close to stoichiometric SnO2(110) or higher.
Ma et al. have reported on the surface energy of SnO2 nanoparticles using drop solution calorimetry. Reference Ma, Castro, Zhou and Navrotsky16 The result (1.72 J m−2) is considerably higher than most assessments in the literature or our present work. We believe that the difference was caused by a miscalculation of the interfacial area. For instance, a sample in Ref. Reference Ma, Castro, Zhou and Navrotsky16 was reported that its grain size is 7.5 nm corresponding to surface area around 8682 m2 mol−1. However, if one calculates its interface area by Eq. (10), one can get the number 17,347 m2 mol−1, much higher than its surface area. This indicates strong agglomeration between particles, and significant grain boundary area existence (∼4332 m2 mol−1 estimated by Eq. (9)). The enthalpy contribution from the grain boundary to the excess energy measured during oxide melt solution calorimetry cannot be ignored, and possibly led to the observed overestimation on surface energy.
The surface energy of the sintered sample (PS) calculated from the water adsorption using Eq. (8) is 20% lower than fully-oxidized/stoichiometric samples (Table II). This is consistent with the water adsorption energy, reinforcing the reduction of the surface under sintering conditions. The literature shows convincing experiments and calculations that the surface energy of the reduced surface is lower at high temperatures (highly negative oxygen chemical potential) and our results suggest that not only the surface was indeed reduced during sintering, but also the quenching procedure was successful in maintaining the reduced condition from the high temperature state. Note that during the measurement of surface energy using water dosage, there is an increase in the oxygen pressure for the water molecules, which suggest that a partial reoxidation can be taking place during the water adsorption experiment. As mentioned before though, because the experiment is carried out at room temperature, minimal reoxidation is expected. Moreover, even if oxidation occurs, the surface energy calculations are based on a thermochemical cycle, inferring that the surface energy calculations should not be affected.
D. Grain boundary energies from oxide melt drop solution calorimetry
Water adsorption microcalorimetry can satisfactorily assess the surface energy of oxide nanoparticles. However, it can give no information on grain boundary energies. Drop solution calorimetry can however assess both interfacial energies (grain boundary and surface) by a correlation of the heat of dissolution with the microstructure quantification. Reference Castro and Wang15 To do this, a set of samples with different interfacial areas is needed. For this purpose, P1 to P3 were prepared as described in the experimental section. Results of microstructural characterization and heat of drop solution are listed in Table I. The surface and grain boundary energies calculated using the thermochemical cycle described in the experimental section are listed in Table II.
To determine interfacial energies, the enthalpy of anhydrous samples (ΔH anhydrous) was assessed from the enthalpy of dissolution of SnO2 nanoparticles (ΔH ds) after proper water correction, and the excess enthalpy (ΔH exs) obtained by subtracting ΔH anhydrous from the dissolution enthalpy of bulk (coarsened) SnO2, 69.69 ± 1.17 kJ mol−1. A series of mathematical expressions correlating the microstructure (surface and grain boundary areas) of each sample and the excess enthalpy was built [Eq. (7)] and solved such that a unique solution for the surface and grain boundary energies was obtained by linear regression analysis. The surface energy is calculated as 1.03 ± 0.24 J m−2 and the grain boundary energy 0.80 ± 0.47 J m−2. The surface energy is consistent with the results from the water adsorption data, but with a larger error due to the small dispersion of interface areas. Similarly, due to the low grain boundary areas, the error for the grain boundary energy is more than 50%.
One of the reasons for the large errors in the calculations is that two unknowns are solved at the same time using the set of equations. To improve the results for the grain boundary energy, the reliable surface energy (smaller error) was imported from the water adsorption calorimetry experiments. A linear correlation between γGB and ΔH exs is then achieved:
 $$\Delta {H_{{\rm{exs,GB}}}} = \Delta {H_{{\rm{exs}}}} - \Delta {H_{{\rm{exs,S}}}} = \Delta {H_{{\rm{exs}}}} - {\gamma _{\rm{S}}} \cdot {A_{\rm{S}}} = {\gamma _{{\rm{GB}}}} \cdot {A_{{\rm{GB}}}}\quad,$$
where the excess enthalpies are exclusively related to surface or grain boundary energy as marked with subscripts “S” or “GB”, respectively. Solving, the grain boundary energy is 0.71 ± 0.08 J m−2, which lies within the uncertainty range of the result achieved without the imported surface energy, but with significant more accuracy. To the best of our knowledge, there is no available data on other literature for SnO2 to compare this number with. Terwilliger and Chiang have reported on the grain boundary energy of TiO2 doped with 1% SnO2. Reference Terwilliger and Chiang32 The data were acquired by grain growth study in the differential scanning calorimeter, and it was clear that there was a temperature influence on the grain boundary energy. For low temperature ranges (600–780 °C), it was reported to be 0.5–1 J m−2. This temperature range is consistent with those used to prepare samples P1, P2, and P3, and the energy measured here lies within their estimations.
Unfortunately, due to the special surface conditioning requirement for the sintered samples, it was not possible to perform reliable and meaningful drop solution experiment to acquire surface and grain boundary energies from the sintered samples (PS).
E. Dihedral angles on thermodynamics of sintering
According to the assessments of interface energies from the two calorimetric methods, the surface energy and grain boundary energy of reoxidized (stoichiometric) SnO2 is 1.20 ± 0.02 and 0.71 ± 0.08 J m−2, respectively. Moreover, the surface energy of SnO2 sintered at 1300 °C (reduced) is 0.94 ± 0.03 J m−2. As hypothesized, the results suggest that upon sintering conditions (high temperatures), there is an actual change in the predicted driving force for sintering as compared to room temperature. Temperature has been recently reported to affect the driving force for sintering in doped systems by ion migration. Reference Chang, Rufner, van Benthem and Castro33 In our case, we see that the surface redox state can also be affected by temperature and hence affect densification driving forces.
Conventional sintering theory suggests that sintering is driven by the surface energy and the local effect of curvatures in mass transport. Densification is therefore always thermodynamically favorable, but different mechanisms of mass transport would be responsible for nondensification behavior, as that described for SnO2 (evaporation–condensation and surface diffusion). However, our results suggest that for SnO2 there is a decrease in the driving force as well behind the observed behavior.
Though not typically considered in sintering models, the dihedral angle has been proven to play a significant role in the microstructure evolution during sintering. Lange et al. have demonstrated that during neck formation, particle arrays of the system may face an energy minimum, Reference Lange34 and the smaller the angle is, the sooner this minimum is reached. Kellet et al. also demonstrated that the sintering stress increases with increase in dihedral angles at whichever contact angle, revealing higher sinterability for samples with larger dihedral angle. Reference Kellett and Lange35 For SnO2, using the data presented here, one can calculate the dihedral angle at low temperatures and under sintering conditions. If the grain boundary energy is assumed to be equal for both stoichiometric and sintered samples, based on Young's relation, Reference Lange34 the dihedral angle for low temperature (oxidized) condition is 145.58°, and at the sintering condition it would be 135.6°. This implies that there is higher driving force for densification at lower temperatures than at higher temperatures due to the reduction of the surface in the latest.
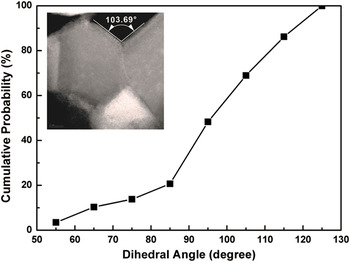
The assumption that the grain boundary energy is equal for the low temperature and high temperature condition is, however, not justifiable. This is because the grain boundary is also expected to suffer effects from oxygen deficiency, as demonstrated by Terwilliger and Chiang for TiO2 grain boundaries. Reference Terwilliger and Chiang32 Unfortunately, we could not measure the grain boundary energy of the sintered sample due to experimental limitations (small grain boundary area even after only 30 s of sintering, and instability of surface chemistry condition that would not allow a reliable drop solution experiment). Therefore, to assess the energetic contribution from the grain boundaries, instead of the usage of the calorimetric measurements, the contact/dihedral angle was measured directly from HAADF STEM images. Only clear contact angles were counted, as exemplary shown in the insert image in Fig. 4. The criteria for angle selection were no tilt and no overlapping grains. All details of analysis were shown in our previous work. Reference Chang, Rufner, van Benthem and Castro33 Note that it is particularly difficult to define if the contact angle has reached its equilibrium state (dihedral angle) or not. Ideally, the measurement of angles at different temperatures would allow a better definition if the angle is still changing or not (determining the dihedral angle). However, we faced a fundamental experimental issue: many reports have shown that SnO2 starts to evaporate at ∼1300 °C. Therefore, we cannot prolong sintering time at such high temperature to avoid the contact angles decreasing due to mass loss. On the other hand, the chemical diffusion coefficient of oxygen in tin dioxide at 1300 °C is 2.58 × 10⁻⁶ cm2/s. Reference Kamp, Merkle, Lauck and Maier36 Therefore, the theoretical diffusion length is 1.7 × 10⁵ nm after only 30 s. At this rate, significant mass flow is expected, reinforcing that based on the extremal principle the measured contact angle is probably very close to dihedral angle.
Cumulative counting of dihedral angle measure from STEM images for sintered sample (PS). The insert image shows a clear dihedral angle with no tilt and overlapping grains. The average dihedral angle is about 100°.

After analysis, the average contact angle on the sintered sample (PS) is 100 ± 18.76°; its cumulative frequency is shown in Fig. 4. Upon Young's relation, the back calculated grain boundary energy is 1.2 ± 0.24 J m−2, significantly higher than reoxidized SnO2 (0.71 ± 0.08 J m−2). This is in good agreement with the statement of Terwilliger and Chiang Reference Chiang, Birnie and Kingery31,Reference Terwilliger and Chiang32 who have measured the grain boundary of TiO2 doped with SnO2 and showed that the grain boundary energy for a nanocrystalline dense sample systematically increases with temperature. Though SnO2 is not so susceptible to reduction as TiO2, still shows observable change in the grain boundary energy as expected. This suggests highly stable pores and explains the low sinterability of SnO2 from a thermodynamic basis. Note that dihedral angles from the nonsintered samples could not be determined by this technique for comparison because the contact angles are not easily identifiable (obeying criteria of no tilt and no overlapping grains), making any attempt to measure them would be unreliable.
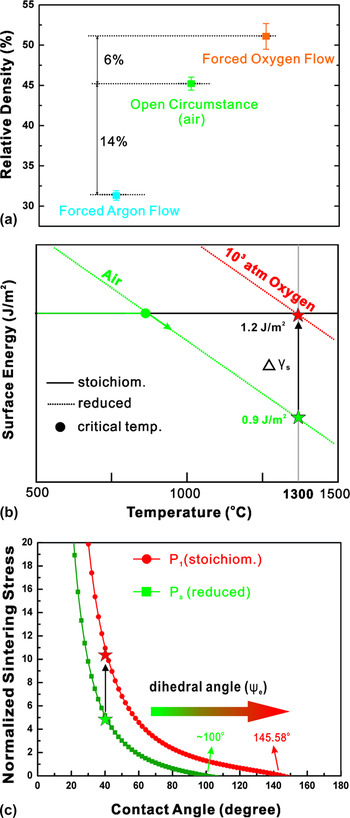
In fact, a simple practical experiment can prove the hypothesis of decreased driving force at high temperatures: comparatively sintering pellets at different atmospheres. Three sintering conditions were tested; one under air (like conventional sintering), another sintered under 42 mL/s pure oxygen flow, and the other sintered under pure argon flow at the same rate. All of them were heated up from 25 to 1300 °C at 5 °C/min, dwelled for 30 s, and then cooled down to 25 °C at the same rate. The densities were measured by Archimedes method. To obtain higher accuracy of density measurement, large pellets were used in this study (∼9.6 mm in diameter, ∼1.2 mm in thickness, ∼200 mg per pellet and 31% relative density for green density). The results are shown in Fig. 5(a). The one sintered with oxygen flow achieves higher density, at least 6% higher in relative density as compared with the sample sintered under air. In contrast, the pellet sintered under argon achieved density 14% lower than the one sintered under air.
(a) Relative density of SnO2 samples sintered under three different atmospheric conditions. One was sintered in air and the others under 42 mL/s pure oxygen or argon flow. To obtain error bar, each sample was measured three times. Relative densities were defined as the ratio of experimental densities to theoretical densities. (b) Surface energy depends on temperature with varying atmospheric conditions. The solid line and dash line represent the prediction of stoichiometric and reduced SnO2 surface energies, respectively. (c) The plot of normalized surface stresses versus contact angles. The arrow between two stars denotes the possible enhancement while applying extremely high oxygen pressure.

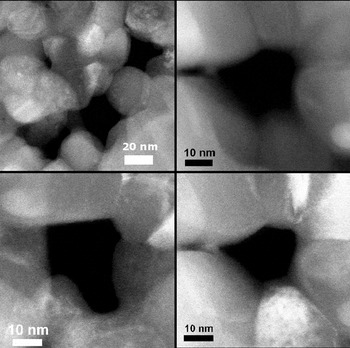
An important question at this point is how much of this change is actually caused by the dihedral angle change, and the answer can be found in calculated sintering stresses. As mentioned before, Lange et al. Reference Lange34,Reference Kellett and Lange35 have shown that a particulate system reaches a meta-equilibrium condition when the angle between two particles meets the dihedral angle. Hence, the sintering stress increases as the ratio of dihedral angles to contact angles increases, meaning higher sinterability for samples with larger dihedral angle. Figure 6 shows STEM images of sintered SnO2 showing isolated pores where apparently the contact angles are defining their stability, suggesting that indeed this mechanism could be playing a role in the densification behavior. An equation revealing the increased sinterability was deduced by Kellett and Lange, and for a linear array of spheres, it can be expressed as:
 $${{\rm{\sigma }}_{\rm{s}}} = {{{{\rm{\gamma }}_{\rm{s}}}} \over R}\left( {\cos {{\rm{\varphi }} \over 2} - \cos {{{{\rm{\varphi }}_{\rm{e}}}} \over 2}} \right){{1 + {\rm{co}}{{\rm{s}}^2}{{\rm{\varphi }} \over 2}} \over {{\rm{si}}{{\rm{n}}^2}{{\rm{\varphi }} \over 2}{\rm{cos}}{{\rm{\varphi }} \over 2}}}\quad,$$
where σ s is sintering stress; R is the sphere size normalized by its initial size; γs is surface energy; ϕ and ϕe represent contact and dihedral angle, respectively. Reference Kellett and Lange35 Figure 5(c) shows the calculated sintering stress as a function of contact angle using this equation and showing the decrease in sinterability with increasing dihedral angle. We have plotted considering the two angles determined by our experiments for SnO2, i.e., 145.58° and 100°, representing the stoichiometric and the sintering conditioned surfaces, respectively. A decrease in the sinterability is remarkable, such that for a given contact angle, for instance 40°, sintering stress decreases to half when comparing the two dihedral angles. The plot thus suggests that more stoichiometric samples (larger dihedral angles) will be more prone to densification, evidencing a strong effect of the atmosphere on the densification driving force.
STEM images of sintered tin dioxide pellets suggesting pore stability is a governing factor during densification.

The data in Fig. 5(a) (density for sintering under different atmospheres) are aligned with the predicted decrease in sinterability, showing higher densification for the oxygen rich atmospheres. From a practical point of view, it would be interesting to keep the stoichiometric condition at high temperatures to induce potentially higher densification. However, maintaining stoichiometry (large dihedral angles) is not elementary and exceedingly high oxygen pressures would be necessary. To quantify this, we have plotted the surface energy as a function of temperature as predicted by Eqs. (11) and (12) in Fig. 5(b). The plot shows that at low temperatures the surface energy is constant (stoichiometric value, 1.2 J m2) for any given atmosphere because the predicted surface energies for nonstoichiometric surfaces are larger. However, there are though critical temperatures, as indicated in the figure, at which the surface energy under reduced conditions is more stable. For instance, under air flow, above around 800 °C the net surface energy is expected to be smaller than the stoichiometric value. As the temperature increases further, the surface energy decreases more and finds the 0.9 J m−2 value at 1300 °C, as we have measured. Under argon, one expects an even lower temperature at which the surface energy is decreased, but under oxygen flow this is shifted toward the stoichiometric value.
Oxygen flow is however not close to enough to allow high sinterability of SnO2. Using the diagram in Fig. 5(b), a pressurized chamber with an oxygen pressure of 103 atm would be theoretically required to allow fully stoichiometric surfaces at 1300 °C. The predictions of higher densification for the samples under oxygen atmosphere are also consistent with previous results on the sintering of SnO2 compacts under argon versus oxygen atmospheres. Varela et al. Reference Varela, Whittemore and Longo5 have shown a decrease in average pore size for the oxygen atmosphere sintering condition, suggesting a change in the pore stability thermodynamics, that is directly dependent on the dihedral angle. Reference Kellett and Lange35
However, the change in atmosphere and temperature will also affect kinetic aspects of densification. Leite et al. suggested that three mechanisms act during sintering of SnO2, grain boundary/surface diffusion; lattice diffusion, and evaporation condensation. Reference Leite, Cerri, Longo, Varela and Paskocima6 At temperatures above 1300 °C, Hoening and Searcy have shown that the decomposition of SnO2 into tin and oxygen is very likely, evidencing an active evaporation/condensation mechanism at that condition. Reference Hoenig and Searcy37 An increase in the oxygen pressure is then expected to decrease the kinetics of evaporation by shifting the reaction equilibrium, suppressing this nondensification mechanism and enabling slightly higher densities.
The kinetic argument about the shifted densification behavior can be even strengthened if considering that in general the surface energy of oxides is expected to decrease with increasing temperature. This would be true even for materials that show densification behaviors upon sintering. For instance, Tsoga and Nikolopoulos have proposed an equation describing the surface energy decrease of yttria-stabilized zirconia (YSZ) as a function of temperature, Reference Tsoga and Nikolopoulos38 but it is well known that this system can be sintered up to high densities using conventional sintering techniques (pressureless under air). However, the difference between this case and SnO2 is the expected size of the change. For YSZ, a small shift is observed (∼0.1 J m−2) for an interval of temperature of 300 °C. For SnO2, an abrupt and significant drop on the surface energy (∼0.26 J m−2) is observed when the surface suffers partial reduction. Moreover, a change on the grain boundary energy is also expected due to local oxygen deficiencies, creating unfavorable dihedral angles, as suggested by the STEM images.
The very limited densities achieved in Fig. 5(a) suggest, however, that even if the sintering stresses are increased by a more favorable dihedral angle under high oxygen pressures (∼103 atm), it is unlike that high densities will be achieved under natural sintering. This is because temperature will increase significantly the defect generation, which will consequently increase the rate of nondensification mechanisms, which are independent on the dihedral angle and an intrinsic feature of tin dioxide as previously reported. Reference Leite, Cerri, Longo, Varela and Paskocima6 A more detailed study quantitatively addressing kinetics and thermodynamics aspects should be performed to clearly state the contribution of each to the nondensification behavior. We believe though that this paper presented the required tools for such studies by providing a quantitative thermodynamic description of SnO2 microstructure during sintering.
V. CONCLUSION
Surface and grain boundary energies of nanocrystalline SnO2 were assessed by two calorimetric methods: high-temperature oxide melt drop solution calorimetry and water adsorption microcalorimetry. Reoxidized (stoichiometric) samples showed surface and grain boundary energies of 1.20 ± 0.02 and 0.71 ± 0.08 J m−2, respectively. The sintered sample, at 1300 °C for 30 s, showed lowered surface energy, 0.94 ± 0.03 J m−2. This indicated that sintering conditions can cause reduction of the surface energy, and a change in the pore stability. Though we could not measure the grain boundary energy of the sintered sample, a direct observation from STEM shows a decrease in dihedral angle as temperature increases for SnO2, reinforcing the predicted pore stability condition. A direct demonstration of a change in the final density by changing the oxygen content during sintering atmosphere suggested that densification can be slightly improved if the thermodynamics is shifted. However, the still very low densities under any tested atmospheres suggest that nondensification mechanisms are mainly responsible for the microstructural evolution.
ACKNOWLEDGMENTS
This work was supported by the NSF grant DMR Ceramics 1055504. We also acknowledge Jorgen Rufner and Sanchita Dey for the support with TEM/STEM analysis.