INTRODUCTION
The role of abrupt climatic change in shaping cultural evolution and social development during the Holocene is a focal topic in paleoclimate research (Sinha et al., Reference Sinha, Kathayat, Weiss, Li, Cheng, Reuter and Schneider2019; Dong et al., Reference Dong, Li, Zhang, Ren, Li, Li, Xiao, Wang and Chen2021; Tan et al., Reference Tan, Dong, An, Edwards, Li, Li and Spengler2021). The nearly global cooling/drought anomaly between 4.2 and 3.9 ka, known as the 4.2 ka event, has been used to define a new stratigraphic stage, the Meghalayan Age (Bond et al., Reference Bond, Showers, Cheseby, Lotti, Almasi, deMenocal, Priore, Cullen, Hajdas and Bonani1997; Berkelhammer et al., Reference Berkelhammer, Sinha, Stott, Cheng, Pausata and Yoshimura2012; Railsback et al., Reference Railsback, Liang, Brook, Voarintsoa, Sletten, Marais, Hardt, Cheng and Edwards2018). Since Weiss et al. (Reference Weiss, Courty, Wetterstrom, Guichard, Senior, Meadow and Curnow1993) first identified the link between the 4.2 ka event and the collapse of the Akkadian Empire, several studies have also attributed the demise of civilizations such as ancient Egypt (Weiss and Bradley, Reference Weiss and Bradley2001), Mesopotamia (deMenocal, Reference deMenocal2001; Watanabe et al., Reference Watanabe, Watanabe, Yamazaki and Pfeiffer2019), the Indus valley civilization (Staubwasser et al., Reference Staubwasser, Sirocko, Grootes and Segl2003; Berkelhammer et al., Reference Berkelhammer, Sinha, Stott, Cheng, Pausata and Yoshimura2012), and Neolithic cultures in China (Wu and Liu, Reference Wu and Liu2004; Yang et al., Reference Yang, Scuderi, Wang, Scuderi, Zhang, Li and Forman2015; Xiao et al., Reference Xiao, Zhang, Fan, Wen, Zhai, Tian and Jiang2018; Cai et al., Reference Cai, Cheng, Ma, Mao, Breitenbach, Zhang, Xue, Cheng, Edwards and An2021) to the 4.2 ka event.
The Shijiahe culture based in the middle Yangtze River basin in south-central China was a socially complex Neolithic culture with a state-like civilization system (Han, Reference Han2016). Archaeological data suggest that it declined sometime between 4.1 and 3.9 ka (State Administration of Cultural Heritage of China, 2002; Zhong, Reference Zhong2019; Han, Reference Han2020b). Although the fall of Shijiahe culture is widely attributed to its military defeat by the Wangwan III culture (H. Wang, Reference Wang2013; Han, Reference Han2020a, Reference Han2020b), two pertinent questions remain: (1) The Shijiahe culture was stronger than Wangwan III culture, as evidenced by its large-scale sites, complicated sociopolitical structure, and solid defense system (Han, Reference Han2020b), so why did it lose to a relatively weaker state? (2) The archaeological excavations suggest that the Shijiahe sites featured advanced city walls and courtyard buildings (State Administration of Cultural Heritage of China, 2002), which were unique during the Neolithic period, so why did the post-Shijiahe culture not occupy these sites, instead inhabiting new sites at higher elevation (Zhong, Reference Zhong2019)?
Although the timing of the Shijiahe culture's demise coincides with cultural collapses in other regions, whether climatic change contributed to its downfall requires further investigation. The Holocene climatic records of the East Asian summer monsoon (EASM) indicate that the 4.2 ka event was characterized by a weaker monsoon in China with less monsoonal moisture reaching northern China (Wang et al., Reference Wang, Cheng, Edwards, He, Kong, An, Wu, Kelly, Dykoski and Li2005; Tan et al., Reference Tan, Cai, Cheng, Edwards, Gao, Xu, Zhang and An2018a). The climatic conditions in central and southern China during the time are, however, debated. For example, by comparing hydrological records from China, Tan et al. (Reference Tan, Cai, Cheng, Edwards, Gao, Xu, Zhang and An2018a) proposed a view of “wet in central and southern China and arid in northern China” during this period. Similarly, Zhang et al. (Reference Zhang, Cheng, Cai, Spötl, Kathayat, Sinha, Edwards and Tan2018) considered the northern Qinling Mountain–lower Yangtze River region to be the dry–wet boundary and suggested that south-central China experienced a humid period during the 4.2 ka event. Wu and Liu (Reference Wu and Liu2004) also demonstrated that frequent floods marked the 4.2 ka event in south-central China. In contrast, Sun et al. (Reference Sun, Liu, Wünnemann, Peng, Jiang, Deng, Chen, Li and Chen2019) and Liu and Feng (Reference Liu and Feng2012) concluded cold-dry conditions in central and southern China during the period. The sedimentary pollen and geochemical records from the Sanfangwan (Jia et al., Reference Jia, Ma, Zhu, Guo, Xu, Guan, Zeng, Huang and Zhang2017) and Tanjialing sites (Li et al., Reference Li, Zhu, Wu, Li, Sun, Wang, Liu, Meng and Wu2013) also indicate an arid period in the Jianghan Plain in south-central China during the 4.2 ka event, even though flood events were also reported in these records.
These discrepancies among studies stem largely from a lack of precisely dated paleorainfall records from south-central China. Although several speleothem records are available from central and southern China, for example, from the Sanbao (Dong et al., Reference Dong, Wang, Cheng, Hardt, Edwards, Kong and Wu2010; Cheng et al., Reference Cheng, Edwards, Sinha, Spötl, Yi, Chen and Kelly2016a), Lianhua (LH) (Cosford et al., Reference Cosford, Qing, Eglington, Mattey, Yuan, Zhang and Cheng2008; H. Zhang et al., Reference Zhang, Yu, Zhao, Feng, Lin, Zhou and Liu2013), and Dongge (DG) Caves (Yuan et al., Reference Yuan, Cheng, Edwards, Dykoski, Kelly, Zhang and Qing2004; Wang et al., Reference Wang, Cheng, Edwards, He, Kong, An, Wu, Kelly, Dykoski and Li2005), the climatic significance of these stalagmite δ18O records is highly debated and subject to multiple interpretations (e.g., moisture sources and pathways, upstream rainout, and regional rainfall) (Yuan et al., Reference Yuan, Cheng, Edwards, Dykoski, Kelly, Zhang and Qing2004; Maher and Thompson, Reference Maher and Thompson2012; Tan et al., Reference Tan, Cai, Cheng, Edwards, Gao, Xu, Zhang and An2018a). The δ13C and trace elements ratios (e.g., Sr/Ca, Mg/Ca, and Ba/Ca) in stalagmites, which reflect the local hydrological environment (Fairchild and Treble, Reference Fairchild and Treble2009; Xue et al., Reference Xue, Cai, Lu, Ma, Cheng, Liu and Yan2021; Zhang et al., Reference Zhang, Cheng, Sinha, Spötl, Cai, Liu and Kathayat2021), are thus better suited to reconstruct the local rainfall variability. In this study, we present a suite of stalagmite-based stable isotope (δ18O, δ13C) and trace element records (Sr/Ca, Mg/Ca, Ba/Ca) from Remi Cave, Hunan Province, aiming to reconstruct the monsoon precipitation variations in south-central China across the 4.2 ka event. Our data, together with the archaeological evidence from the region, can help to clarify the possible links between the demise of Shijiahe culture and climatic change.
STUDY AREA AND MATERIAL
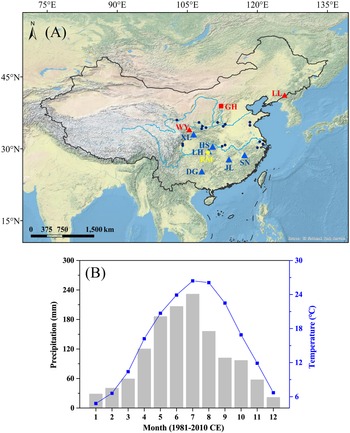
Remi Cave (RM, also called Wulong Cave, 29°13′36″N, 109°21′28″E, elevation 872.5 m) is situated in Longshan County of Hunan Province in the middle Yangtze River (Fig. 1A). The cave formed in Paleozoic carbonates in the Wulong Mountains. The study area has a subtropical humid monsoon climate. Meteorological data (1981–2010 CE) from Longshan station indicate the region is strongly affected by the EASM, with average annual air temperature and total precipitation of 16.1°C and ~1300 mm, respectively (Fig. 1B). The summer season rainfall contributes to more than 70% of annual rainfall at the site from April to September (Fig. 1B).
(A) Locations of Remi Cave (yellow circle) and other caves (triangles) and a lake (square) mentioned in this study: Lianhua (LH), Heshang (HS), Dongge (DG), Jiulong (JL), Shennong (SN), Xianglong (XL), Wuya (WY), Liuli (LL) Caves, and Gonghai (GH) Lake. The different colors reflect the wet (blue) and dry (red) conditions in China, respectively. The records of catastrophic floods during the 4.2 ka event are marked by small deep-blue dots. (B) Climatic setting of the study region with meteorological records from Longshan station. The gray bars and blue squares separately represent regional monthly average precipitation and mean air temperature during 1981–2010 CE.

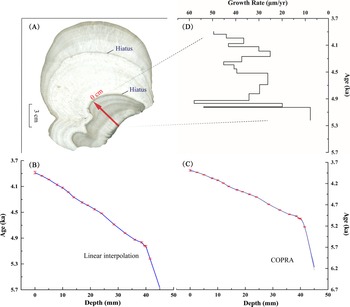
The cave is ~10 km long and contains two chambers, with the front chamber open to the public. A large number of stalagmites and stalactites are found ~200 m away from the cave entrance, with many stalagmites reaching heights above 5 m or even 10 m. A columnar-shaped aragonite stalagmite RM8, ~17 cm in length and 10–12 cm in diameter, was collected from the front chamber in 2016. After splitting and polishing, two potential hiatuses were observed at 4 cm and 10 cm depths, respectively (Fig. 2A). Here, we focus on the bottom part (RM8-2, below the second hiatus) of the stalagmite, as its growth time covers the 4.2 ka event.
(A) Polished section of stalagmite RM8 with two obvious hiatuses. The red arrow in A denotes the growth axis of RM8-2, whose age model is shown using a linear interpolation method (B) and as established by COPRA (C). The depth (0 mm) of the two models begins from the second hiatus. The age model based on linear interpolation (B) was used in this study. (D) The growth rate of RM8-2.

METHODS
A total of 19 subsamples for 230Th dating were drilled parallel to the growth planes of RM8-2, each weighing 30–40 mg. The chemical procedures used to separate Th and U followed those described by Edwards et al. (Reference Edwards, Chen and Wasserburg1987). The measurements were made on a multicollector inductively coupled mass spectrometer at the University of Minnesota, USA (13 measurements), and the Institute of Global Environment Change Xi'an Jiaotong University (6 measurements), following the procedure described by Cheng et al. (Reference Cheng, Edwards, Shen, Polyak, Asmerom, Woodhead and Hellstrom2013).
Subsamples for stable isotope (δ18O, δ13C) analyses were drilled along the central growth axis of RM8-2 at average intervals of 0.5 mm. A total of 91 subsamples were measured using an IsoPrime100 gas source stable isotope ratio mass spectrometer equipped with a MultiPrep system at the Speleological Laboratory at the Institute of Earth Environment, Chinese Academy of Sciences (IEECAS). Samples of the Chinese standard TB1 were analyzed every 10–15 subsamples to check data reproducibility. Measurement precisions was<0.1‰ for δ18O and<0.08‰ for δ13C with 2σ analytical errors. All stable isotope compositions are reported in per mil relative to Vienna Pee Dee Belemnite.
Ninety-one subsamples (each ~1 mg in weight) were also drilled for trace elements (Sr/Ca, Mg/Ca, Ba/Ca) analyses. The powders were dissolved in 2–4 mL 5% HNO3 before being measured on an Agilent 5110 Inductively Coupled Plasma Optical Emission Spectrometer (ICP-OES) at the Speleological Laboratory at IEECAS. One in-house standard, W2, was measured every 5 subsamples, and the precision of X/Ca is<1% (X refers to Sr, Mg, and Ba). In addition, highly resolved Sr and Ca counts were analyzed using the fourth-generation Avaatech X-ray fluorescence (XRF) core scanner at IEECAS with a scan resolution of 0.1 mm. The details of this noninvasive method were reported in Li et al. (Reference Li, Tan, Guo, Cai, Sun, Xue and Cheng2019b).
RESULTS
The 230Th dating results are listed in Table 1 and Figure 2B and C. The age of the RM8-6a subsample is not accurate, having a high 230Th/232Th ratio (Table 1), so this subsample was excluded from the study. The remaining 18 dates are all in stratigraphic order with dating uncertainties less than 0.2%. We established the chronological models of RM8-2 by linear interpolation and COPRA (Breitenbach et al., Reference Breitenbach, Rehfeld, Goswami, Baldini, Ridley, Kennett and Prufer2012), respectively (Fig. 2B and C). To facilitate comparisons with previous records (e.g., from LH, DG, and Heshang [HS] Caves), the age model based on linear interpolation was used in this study. The results show that RM8-2 grew between 5.667 and 3.885 ka (Fig. 2B). The growth rate of RM8-2 is also displayed in Fig. 2D.
U-Th isotopic compositions and 230Th ages of RM8-2.a

a Analytical errors are 2σ of the mean. U decay constants: λ238 = 1.55125 ×10⁻¹⁰, λ234 = 2.82206 × 10⁻⁶. Th decay constant: λ230 = 9.1705×10⁻⁶. Corrected 230Th ages assume the initial 230Th/232Th atomic ratio of 4.4 ± 2.2 ×10⁻⁶. Those are the values for a material at secular equilibrium, with the bulk earth 232Th/238U value of 3.8. The errors are arbitrarily assumed to be 50%.
b δ234U = ([234U/238U]activity – 1) × 1000.
c δ234Uinitial was calculated based on 230Th age (T), i.e., δ234Uinitial = δ234Umeasured × eλ234×T.
d Ages before 1950 CE.
e RM8-6a (in red) data are excluded from this study.
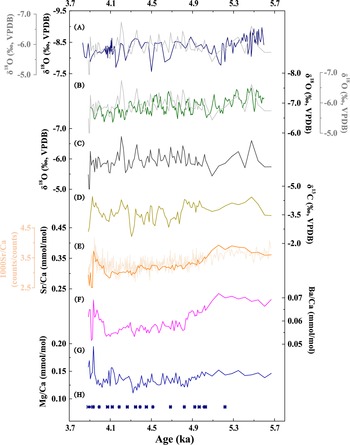
The stable isotope records have a temporal resolution higher than 15 years. RM8-2 δ18O values range from −6.74‰ to −4.73‰ and are relatively stable during 5.1–3.9 ka (Fig. 3A–C). The overall δ18O trend is broadly replicated in DG (Dykoski et al., Reference Dykoski, Edwards, Cheng, Yuan, Cai, Zhang, Lin, Qing, An and Revenaugh2005) and LH (H. Zhang et al., Reference Zhang, Huang, Pang, Zha, Zhou and Gu2013) cave records (Fig. 3A and B), suggesting the near-isotopic equilibrium deposition of RM8-2 according to the replication test (Dorale and Liu, Reference Dorale and Liu2009). RM8-2 δ13C values vary between −4.46‰ and −2.36‰. A gradually increasing trend is observed between ~5.475 and 4.307 ka. Afterward, the δ13C values exhibit a decreasing trend, superimposed with sharply fluctuating values, with two of the more depleted excursions at 4.207 and 3.925 ka (Fig. 3D).
Stable isotopes and X/Ca records of RM8-2. (A, gray), (B, gray) and (C) all show the δ18O sequence of RM8-2, whose overall variation pattern is parallel with stalagmite δ18O records from Dongge Cave (A, dark blue) (Dykoski et al., Reference Dykoski, Edwards, Cheng, Yuan, Cai, Zhang, Lin, Qing, An and Revenaugh2005) and Lianhua Cave (B, green) (Zhang et al., Reference Zhang, Huang, Pang, Zha, Zhou and Gu2013). The remaining records are δ13C (D), X-ray fluorescence (XRF)-scanned (E, light orange), and optical emission spectrometry–based Sr/Ca (E, dark orange), Ba/Ca (F), and Mg/Ca (G) of RM8-2. (H) Dating errors of RM8-2.

X/Ca values of RM8-2 range from 0.254 to 0.393 mmol/mol for Sr/Ca, from 0.111 to 0.195 mmol/mol for Mg/Ca, and from 0.052 to 0.072 mmol/mol for Ba/Ca (Fig. 3E–G). XRF-based Sr/Ca varies from 2.70 × 10⁻³ to 4.17 × 10⁻³, with an average value of 3.32 × 10⁻³. The mean temporal resolution is ~3.73 years. As illustrated in Figure 3E, the Sr/Ca ratios obtained by the two methods (XRF and ICP-OES) show similar trends, indicating the reliability of the high-resolution XRF scanning method (Li et al., Reference Li, Tan, Guo, Cai, Sun, Xue and Cheng2019b).
DISCUSSION
Interpretation of proxies
The climatic significance of δ18O of Chinese stalagmites has been intensely debated in recent years (Cheng et al., Reference Cheng, Zhang, Zhao, Li, Ning and Kathayat2019). The climatic interpretation of stalagmite δ18O in south-central China is particularly complex, and several mechanisms have been suggested as exerting influence on the δ18O of precipitation and stalagmites, including moisture sources and pathways (Maher and Thompson, Reference Maher and Thompson2012; Li et al., Reference Li, Tan, Cai, Jiang, Ma, Cheng, Edwards, Zhang, Gao and An2019a), upstream rainout (Yuan et al., Reference Yuan, Cheng, Edwards, Dykoski, Kelly, Zhang and Qing2004; Hu et al., Reference Hu, Henderson, Huang, Xie, Sun and Johnson2008), and regional and local rainfall amounts (Tan et al., Reference Tan, Cai, Cheng, Edwards, Gao, Xu, Zhang and An2018a). Given these complexities, we have mainly used the RM8-2 δ13C and X/Ca in this study to reconstruct the local hydroclimate.
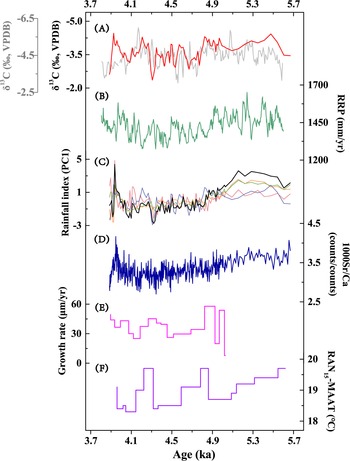
The δ13C values in speleothems can vary with soil CO2 concentrations and the dissolution of bedrock (Genty et al., Reference Genty, Baker, Massault, Proctor, Gilmour, Pons-Branchu and Hamelin2001). Their contributions to speleothem δ13C are further influenced by vegetation types and density above the cave, as well as the hydrological process in the cave system, for example, water–rock interaction (WRI) and prior aragonite or calcite precipitation (PAP/PCP) (Genty et al., Reference Genty, Blamart, Ouahdi, Gilmour, Baker, Jouzel and Van-Exter2003; McDermott, Reference McDermott2004; Tan et al., Reference Tan, Liu, Wang, Cheng, Zang, Wang and Ma2020b). The significant negative correlations of δ13C with X/Ca (r = −0.239, P<0.05 for Mg/Ca; r = −0.362, P<0.01 for Sr/Ca; r = −0.343, P<0.01 for Ba/Ca; N = 91; Fig. 4) exclude PAP/PCP processes as primary drivers of the δ13C variations (Novello et al., Reference Novello, Cruz, McGlue, Wong, Ward, Vuille and Santos2019). It is therefore likely that the RM8-2 δ13C variations were dominated by changes in vegetation coverage and biomass density above the cave, consistent with the explanations of speleothem δ13C from LH (Cosford et al., Reference Cosford, Qing, Mattey, Eglington and Zhang2009), which showed a variation trend similar to our records, despite differences in minor details (Fig. 5A). Those variations were further related to regional climatic conditions (e.g., temperature and precipitation changes) as demonstrated by modern investigations (Huang et al., Reference Huang, Lin, Wang and Chang2013; Liu and Qu, Reference Liu and Qu2019). In this process, rainfall amount plays an essential role. It was found that the net primary productivity of vegetation in south-central China continually declined due to decreasing rainfall during 2009–2012 CE (Huang et al., Reference Huang, Lin, Wang and Chang2013). On the other hand, the carbon cycle research in the underground river of the Dalong Cave (~150 km away from RM Cave) shows δ13C was negatively correlated with rainfall amount (Wang, 2013b). Under wet conditions, dense overlying vegetation produces more soil CO2 by enhancing plant roots’ respiration and increasing soil bioproductivity, resulting in lighter speleothem δ13C values (McDermott, Reference McDermott2004; Fohlmeister et al., Reference Fohlmeister, Scholz, Kromer and Mangini2011). Although the HCO3− concentration in seepage would increase and corrode more bedrock, its positive effects on δ13C values seem to be overridden by the soil CO2-derived negative effects (W. Wang, Reference Wang2013). For these same reasons, RM8-2 δ13C variations could reflect regional precipitation, with lower values indicating enhanced precipitation. Indeed, the RM8-2 δ13C profile varies inversely with the reconstructed regional precipitation, which was obtained by differencing coeval δ18O values of the HS and DG Caves (Hu et al., Reference Hu, Henderson, Huang, Xie, Sun and Johnson2008; Fig. 5B).
Cross-correlations between δ13C and X/Ca of RM8-2. (A) δ13C vs. Mg/Ca; (B) δ13C vs. Sr/Ca; (C) δ13C vs. Ba/Ca. Significant negative correlations occur between δ13C and the X/Ca of RM8-2.

Comparation of RM8-2 records with other climate reconstructions. (A) RM8-2 δ13C in red, and Lianhua (LH) δ13C in gray. (B) Reconstructed regional precipitation (RRP), which is obtained by differencing coeval δ18O values of Heshang (HS) and Dongge (DG) Caves (Hu et al., Reference Hu, Henderson, Huang, Xie, Sun and Johnson2008). (C) PC1 (black) of RM8-2 δ13C (purple), Mg/Ca (red), Sr/Ca (orange), and Ba/Ca (green) records as regional rainfall index. (D) X-ray fluorescence (XRF)-scanned Sr/Ca of RM8-2. (E) The growth rate of RM8-2. (F) RAN15-MAAT (mean annual air temperature) record, which is reconstructed from stalagmite HS4 and represents regional temperature change (Wang et al., Reference Wang, Bendle, Zhang, Yang, Liu, Huang, Cui and Xie2018).

Factors influencing X/Ca ratios in speleothems are diverse, including hydrological processes (e.g., WRI, PAP/PCP), temperature, and speleothem growth rate, among others (Treble et al., Reference Treble, Shelley and Chappell2003; Fairchild and Treble, Reference Fairchild and Treble2009; Tan et al., Reference Tan, Shen, Cai, Lo, Cheng and An2014; Xue et al., Reference Xue, Cai, Lu, Ma, Cheng, Liu and Yan2021). In previous studies, trace elements varying positively in tandem with δ13C were suggested to be caused by rainfall-related hydrological processes (Cheng et al., Reference Cheng, Spötl, Breitenbach, Sinha, Wassenburg, Jochum and Scholz2016b; Tan et al., Reference Tan, Liu, Wang, Cheng, Zang, Wang and Ma2020b; Xue et al., Reference Xue, Cai, Lu, Ma, Cheng, Liu and Yan2021). Specifically, under dry climate conditions, prolonged WRI could increase the dissolution of bedrock. At the same time, low CO2 pressure in overlying soil due to sparse vegetation cover promotes CO2 degassing and PCP. These two processes jointly push speleothem X/Ca and δ13C toward higher values (Fairchild et al., Reference Fairchild, Borsato, Tooth, Frisia, Hawkesworth, Huang, McDermott and Spiro2000; Fairchild and Treble, Reference Fairchild and Treble2009). Another issue is that Mg/Ca positively correlates with δ13C, but Sr/Ca shows an inverse variation when PAP rather than PCP occurred before stalagmite deposition (Fairchild and Treble, Reference Fairchild and Treble2009; Wassenburg et al., Reference Wassenburg, Scholz, Jochum, Cheng, Oster, Immenhauser and Richter2016; Ronay et al., Reference Ronay, Breitenbach and Oster2019). However, in this study, X/Ca ratios vary in the same direction, and their variation trends are in contrast to δ13C, which cannot be explained by either of these two mechanisms. These unusual variations may be related to the enhanced (weakened) WRI efficiency under wet (dry) hydrological conditions, because the higher (lower) HCO3− concentration in seepage due to increasing (decreasing) plant coverage and biomass under wet (dry) conditions would dissolve more (less) bedrock per unit time and carry more (less) trace elements into stalagmites. Meanwhile, when carbonate is oversaturated due to the ongoing and relatively rapid dissolution of bedrock, PCP would also occur, resulting in increased X/Ca in stalagmites. The investigation in the Dalongdong underground river confirms the critical roles of soil CO2 and rainfall amount on the X/Ca variations in underground water (W. Wang, Reference Wang2013). In addition, more trace elements in the overlying soil would be washed into stalagmites by heavy rainfalls. Given this, we suggest the X/Ca variations of RM8-2 could also reflect local hydrological conditions, with higher ratios reflecting increasing rainfall and therefore intensified vegetation coverage. The influence of temperature and growth rate on RM8-2 X/Ca seems minor, as they cannot make X/Ca variations so similar (Huang et al., Reference Huang, Fairchild, Borsato, Frisia, Cassidy, McDermott and Hawkesworth2001; Fairchild and Treble, Reference Fairchild and Treble2009; Fig. 5). The growth rate of RM8-2 varied in parallel with X/Ca because it may also be controlled by rainfall amount (Fig. 5), with higher rates occurring when rainfall increased.
Given the X/Ca and δ13C variations of RM8-2 all reflect local rainfall conditions, principal component analysis (PCA) was used to extract their common variations. It should be noted that inverse δ13C values were used during the process, as δ13C shows an inverse relationship with X/Ca. PC1 explains 57% of the variation and can be regarded as a rainfall index (Fig. 5C).
Hydroclimate in south-central China and regional comparison covering the 4.2 ka event
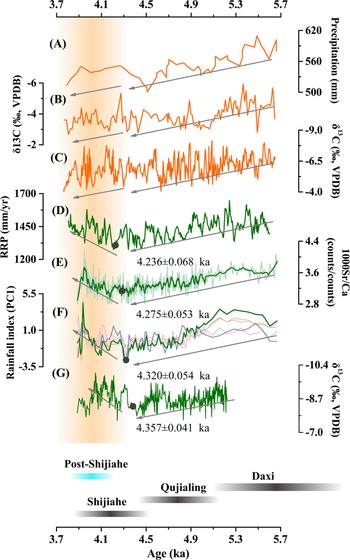
The rainfall index and Sr/Ca of RM8-2 decreased gradually from 5.6 to 4.3 ka, indicating a drying trend (Fig. 6). After that, their variation trends reversed at 4.3–4.2 ka, implying gradually wetter conditions during ~4.3–3.9 ka, which corresponds to the 4.2 ka event (Railsback et al., Reference Railsback, Liang, Brook, Voarintsoa, Sletten, Marais, Hardt, Cheng and Edwards2018). The inferred wet conditions over south-central China are supported by the reconstructed regional precipitation between HS and DG Caves (Hu et al., Reference Hu, Henderson, Huang, Xie, Sun and Johnson2008) and the climatic conditions revealed by the Shennong (SN) δ13C profile (Zhang et al., Reference Zhang, Cheng, Sinha, Spötl, Cai, Liu and Kathayat2021; Fig. 6). This is also consistent with the speleothem-based studies in Jiulong (JL) (Zhang et al., Reference Zhang, Cheng, Sinha, Spötl, Cai, Liu and Kathayat2021) and Xianglong (XL) Caves and may explain the faster growth rate of the stalagmite in the LH Cave during this period (H. Zhang et al., Reference Zhang, Huang, Pang, Zha, Zhou and Gu2013), in contrast with the pronounced dry conditions that were widely reported in northern China during the time (Chen et al., Reference Chen, Xu, Chen, Birks, Liu, Zhang and Jin2015; Yang et al., Reference Yang, Scuderi, Wang, Scuderi, Zhang, Li and Forman2015; Xiao et al., Reference Xiao, Zhang, Fan, Wen, Zhai, Tian and Jiang2018). For example, the pollen-based precipitation records at Gonghai Lake (Chen et al., Reference Chen, Xu, Chen, Birks, Liu, Zhang and Jin2015) and speleothem δ13C from Liuli (LL) (Zhao et al., Reference Zhao, Tan, Yang, Pérez-Mejías, Brahim, Lan, Wang, Li, Wang, Zhang and Cheng2021) and Wuya (WY) Caves (Tan et al., Reference Tan, Li, Wang, Cai, Lin, Cheng, Ma, Sinha and Edwards2020a) revealed drier conditions during 4.3–3.9 ka, continuing the decreasing rainfall trend from ~5.5 ka (Fig. 6). The drought may have triggered desertification in Inner Mongolia and fed the Hunshandake Sandy Lands (Yang et al., Reference Yang, Scuderi, Wang, Scuderi, Zhang, Li and Forman2015). During this period, dry conditions were also observed in central and western Asia (Carolin et al., Reference Carolin, Walker, Day, Ersek, Sloan, Dee, Talebian and Henderson2019; Tan et al., Reference Tan, Dong, An, Edwards, Li, Li and Spengler2021).
Comparison of stalagmite records from Remi (RM) Cave with other paleohydroclimatic records. (A) Pollen-reconstructed rainfall from Gonghai (GH) Lake (Chen et al., Reference Chen, Xu, Chen, Birks, Liu, Zhang and Jin2015). (B) Speleothem δ13C record from Liuli (LL) Cave (Zhao et al., Reference Zhao, Tan, Yang, Pérez-Mejías, Brahim, Lan, Wang, Li, Wang, Zhang and Cheng2021). (C) Speleothem δ13C record from Wuya (WY) Cave (Tan et al., 2020). (D) Reconstructed regional precipitation (RRP), which is obtained by differencing coeval δ18O values of Heshang (HS) and Dongge (DG) Caves (Hu et al., Reference Hu, Henderson, Huang, Xie, Sun and Johnson2008). (E) X-ray fluorescence (XRF)-scanned Sr/Ca records of RM8-2 (light green) and 10 year smoothed record (green, this study). (F) PC1 (green) of RM8-2 δ13C (purple), Mg/Ca (pink), Sr/Ca (orange), and Ba/Ca (gray) records as regional rainfall index. (G) Speleothem δ13C record from Shennong (SN) Cave (Zhang et al., Reference Zhang, Cheng, Sinha, Spötl, Cai, Liu and Kathayat2021). The gray arrows denote the trends of the sequences before and after ~4.3 ka. The trends are in opposite directions in D–G. The specific change points and 1σ error, which are measured by a parametric nonlinear regression technique (Mudelsee, Reference Mudelsee2009), are marked by the black dots and numbers in D–G. In addition, the vertical orange bar marks the 4.2 ka event. During the study period, the Daxi, Qujialing, and Shijiahe cultures flourished in the Hanjiang Plain region (horizontal black bar).

This dipole rainfall pattern in monsoonal China inferred from proxy records has been discussed earlier (Tan et al., Reference Tan, Cai, Cheng, Edwards, Gao, Xu, Zhang and An2018a; Zhang et al., Reference Zhang, Cheng, Cai, Spötl, Kathayat, Sinha, Edwards and Tan2018), but previous studies have drawn this conclusion based on limited records with large dating uncertainties and low resolutions. Here, our multiproxy records provide direct and robust evidence to confirm wet conditions in south-central China during the 4.2 ka event and also support the idea that the 4.2 ka event was not a synchronous global drought event (Railsback et al., Reference Railsback, Liang, Brook, Voarintsoa, Sletten, Marais, Hardt, Cheng and Edwards2018; Ön et al., Reference Ön, Greaves, Akcer-Ön and Özeren2021). It is worth noting that the 4.2 ka event recorded in RM8-2 proxies was not marked and rapid like that in other paleorecords such as the abrupt shift in KM-A δ18O (Mawmluh Cave) profile around 4.0 ka that was used to define the Meghalayan Age (Berkelhammer et al., Reference Berkelhammer, Sinha, Stott, Cheng, Pausata and Yoshimura2012). The absence of abrupt climatic change during the 4.2 ka event is also evident in the stalagmite records from Oman (Fleitmann et al., Reference Fleitmann, Burns, Mudelsee, Neff, Kramers, Mangini and Matter2003) and the western Chinese Loess Plateau (Tan et al., Reference Tan, Li, Wang, Cai, Lin, Cheng, Ma, Sinha and Edwards2020a), which revealed a gradual climatic change during the 4.2 ka event. Ön et al. (Reference Ön, Greaves, Akcer-Ön and Özeren2021) reanalyzed 14 paleoclimatic records from southeastern Europe and southwestern Asia that claimed to find abrupt climatic change during the 4.2 ka event and demonstrated that not all records show an abrupt drying anomaly. Some drying shifts lasted for several centuries, and some changes were insignificant (Ön et al., Reference Ön, Greaves, Akcer-Ön and Özeren2021). Moreover, some regional records even found no compelling evidence of the 4.2 ka event; for example, in the northern North Atlantic (Bradley and Bakke, Reference Bradley and Bakke2019) and Rodrigues Island (Li et al., Reference Li, Cheng, Sinha, Kathayat, Spötl, André and Meunier2018). The relatively inconspicuous feature of the 4.2 ka event in RM8-2 proxies is also evident in the reconstructed regional precipitation between HS and DG Caves (Hu et al., Reference Hu, Henderson, Huang, Xie, Sun and Johnson2008) and SN δ13C sequence (Zhang et al., Reference Zhang, Cheng, Sinha, Spötl, Cai, Liu and Kathayat2021; Fig. 6), suggesting it may be a common climatic signal in south-central China.
The dipole climatic pattern in China during the 4.2 ka event was likely induced by the weakened EASM and the counterbalance between the EASM and westerlies (Tan et al., Reference Tan, Cai, Cheng, Edwards, Gao, Xu, Zhang and An2018a). As the paleo-dust record in Japan Sea revealed, the westerlies shifted to a relatively northern position during 5.6–4.3 ka (Nagashima et al., Reference Nagashima, Tada and Toyoda2013). The decreased EASM intensity that was modulated by the Northern Hemisphere summer insolation dominated the declining rainfall trend in both northern and southern China during this period (Wang et al., Reference Wang, Cheng, Edwards, He, Kong, An, Wu, Kelly, Dykoski and Li2005; Zhang et al., Reference Zhang, Brahim, Li, Zhao, Kathayat, Tian and Baker2019; Tan et al., Reference Tan, Li, Wang, Cai, Lin, Cheng, Ma, Sinha and Edwards2020a). Afterward, EASM intensity weakened further (Wang et al., Reference Wang, Cheng, Edwards, He, Kong, An, Wu, Kelly, Dykoski and Li2005), but the westerlies shifted southward and strengthened somewhat due to the weakened Atlantic Meridional Overturning Circulation (Broecker, Reference Broecker1994; Mayewski et al., Reference Mayewski, Meeker, Twickler, Whitlow, Yang, Lyons and Prentice1997; Nagashima et al., Reference Nagashima, Tada and Toyoda2013). These changes caused the migration of the moisture-carrying summer monsoon to the south and resulted in the contrasting conditions in the south (wet) and north (dry) of China (Tan et al., Reference Tan, Cai, Cheng, Edwards, Gao, Xu, Zhang and An2018a).
Superimposed on the overall increasing precipitation during 4.3–3.9 ka, there are several multidecadal-scale pulses of wet conditions recorded in the rainfall index and Sr/Ca of RM8-2 and in the reconstructed regional precipitation (Hu et al., Reference Hu, Henderson, Huang, Xie, Sun and Johnson2008) and SN δ13C profile (Zhang et al., Reference Zhang, Cheng, Sinha, Spötl, Cai, Liu and Kathayat2021; Fig. 6). The two most remarkable pluvial pulses in our records occurred at 4.25–4.12 and 4.0–3.9 ka (Fig. 6). These observations are consistent with the magnetic-based peatland (Dajiuhu) and speleothem (HS Cave) records from the middle Yangtze River (Xie et al., Reference Xie, Evershed, Huang, Zhu, Pancost, Meyers and Gong2013; Zhu et al., Reference Zhu, Feinberg, Xie, Bourne, Huang, Hu and Cheng2017). Additionally, paleohydrological investigations have identified unambiguous paleoflood sediments at archaeological sites (Chengdu Plain, Jinsha, Zhongqiao, Maqiao, Taihu basin) around the upper, middle, and lower reaches of the Yangtze River (Yu et al., Reference Yu, Zhu, Song and Qu2000; Zhang et al., Reference Zhang, Zhu, Liu and Jiang2005; Zeng et al., Reference Zeng, Ma, Zhu, Song, Zhu, He, Chen, Huang, Jia and Guo2016; Jia et al., Reference Jia, Ma, Zhu, Guo, Xu, Guan, Zeng, Huang and Zhang2017; Wu et al., Reference Wu, Zhu, Ma, Li, Meng, Liu, Li, Wang, Sun and Song2017; Fig. 1), which likely coincide with the pluvial pulses inferred from our records within the margin of age errors.
Moreover, a large body of evidence suggests that floods also swept across the Yellow River region during this period. For example, a highly resolved and accurately dated stalagmite study from WY Cave revealed two megafloods at ~4.2 ka and ~4.0 ka in the middle-lower Yellow River region (Tan et al., Reference Tan, Shen, Cai, Cheng and Edwards2018b), consistent with paleoflood slackwater deposits in the branches (Damajia, Qishuihe, Jinghe, Weihe, Beiluohe, and Yihe Rivers) of the Yellow River (Huang et al., Reference Huang, Pang, Zha, Zhou, Su and Li2010, Reference Huang, Pang, Zha, Su and Jia2011, Reference Huang, Pang, Zha, Zhou, Su, Zhang, Wang and Gu2012; Ma et al., Reference Ma, Dong, Chen, Meng, Wang, Elston and Li2014; Shen et al., Reference Shen, Yu, Zhang, Zhao and Lai2015; Y. Zhang et al., Reference Zhang, Huang, Pang, Zha, Zhou and Gu2013, Reference Zhang, Huang, Pang, Zha, Zhou and Wang2015) and archaeological sites in Henan Province (Zhang and Xia, Reference Zhang and Xia2011; Fig. 1). The evidence confirms the legend of the Great Flood and the Xia dynasty to some extent (Tan et al., Reference Tan, Shen, Cai, Cheng and Edwards2018b). This also indicates that extreme climate events are independent of general climatic conditions. Heavy rainfalls could also occur in a dry climate setting.
The 4.2 ka event and the collapse of Shijiahe culture
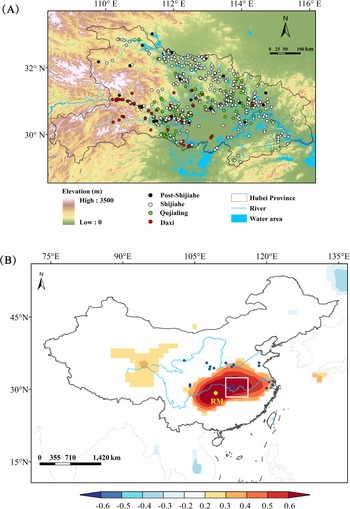
Paleobotanical evidence for rice was found in the middle reaches of the Yangtze River as early as the Pengtoushan culture period (9.0–8.0 ka) (Zhang, Reference Zhang1996), which evolved into rice-dominated agricultural settlements around Jianghan Plain in Hubei Province (State Administration of Cultural Heritage of China, 2002). During the study period, Hubei Province was home to the Daxi (6.3–5.1 ka), Qujialing (5.1–4.5 ka), and Shijiahe cultures (4.5 ka to 4.1–3.9 ka) in succession (Fig. 7A). The development and settlement of these cultures are described in detail by the State Administration of Culture Heritage of China (2002). The projection of the settlement sites onto a modern digital elevation model (DEM) shows that Daxi sites were situated in higher-elevation lands in western Hubei (Fig. 7A). Post-Daxi culture, the Qujialing sites migrated basinward/eastward, where rivers and lakes are located, and the Shijiahe sites expanded further toward the north and south relative to the Qujialing culture (Fig. 7A). Meanwhile, the number of the sites of these two cultures increased. Previous studies suggested that these variations were primarily controlled by the hydroclimatic changes in the region (Zhu et al., Reference Zhu, Zhong, Zheng, Ma and Li2007; Xie et al., Reference Xie, Evershed, Huang, Zhu, Pancost, Meyers and Gong2013). There is a significant correlation in annual precipitation between Hubei Province and the area around the RM Cave. Therefore, our rainfall reconstruction from the RM Cave potentially provides the rainfall history of Hubei (Fig. 7B). Our data show a long-term trend to drier conditions during 5.6–4.3 ka. The shift of the settlements to the riparian zone seems to correspond with the gradual decreasing rainfall trend during this time, as the rivers and lakes in the floodplain in central and eastern Hubei may have shrunk (Zhu et al., Reference Zhu, Zhong, Zheng, Ma and Li2007). More land surfaces in the floodplain were exposed and became suitable for habitat (Zhu et al., Reference Zhu, Zhong, Zheng, Ma and Li2007). This is supported by the trend of deceasing sea level during this time, inferred from the total sulfur content results from Tougou-ike Lake in Japan (Kato et al., Reference Kato, Fukusawa and Yasuda2003). Hence, people moved to the lower lands for water. With the aid of DEM, Xie et al. (Reference Xie, Evershed, Huang, Zhu, Pancost, Meyers and Gong2013) estimated that more than 47% of the Qujiangling and Shijiahe sites were situated in lowlands, 15% higher than the sites of the Chengbeixi culture (7.8–6.9 ka, an early Neolithic culture) when regional conditions were wet. These cultures flourished in the hilly lowlands during 5.8–4.3 ka. For example, archaeological excavations suggest that Qujialing culture was characterized by developed farming, sophisticated artifacts, and unique courtyard buildings (State Administration of Cultural Heritage of China, 2002). This was a milestone for prehistoric Chinese civilization, and its impacts expanded to central and southern Henan, southeastern Shaanxi Province, and northern Shanxi Province (Meng, Reference Meng2011). The Shijiahe culture, which succeeded the Qujialing culture, is thought to have developed a state-like civilization system (Han, Reference Han2016). Yasuda et al. (Reference Yasuda, Fujiki, Nasu, Kato, Morita, Mori and Kanehara2004) suggested that the aridification of the climate resulted in a population explosion in the river valleys and the appearance of urban civilization in the region. This is in contrast with the view that the drought climate, which was unfavorable for rice cultivation, triggered the collapse of Shijiahe culture in the Late Neolithic period (Liu and Feng, Reference Liu and Feng2012).
(A) The settlement sites in Hubei Province during Neolithic times, including Daxi, Qujialing, Shijiahe, and post-Shijiahe cultures. The distribution of the sites during the post-Shijiahe culture was revised from Zhong (Reference Zhong2019). The information for the sites during other cultural periods can be seen in the State Administration of Cultural Heritage of China (2002) and Xie et al. (Reference Xie, Evershed, Huang, Zhu, Pancost, Meyers and Gong2013). The digital elevation model (DEM) of the region is also displayed in A, with the data downloaded from Geospatial Data Cloud: http://www.gscloud.cn. (B) The spatial correlation between annual precipitation around Remi (RM) Cave (yellow dot) and the averaged CRU TS4.0 precipitation anomaly (detrend) during 1951–2019 CE (download from https://www.ncdc.noaa.gov). The scale on the bottom shows the correlation coefficients represented by different colors. The small deep-blue dots mark the records of catastrophic floods during the 4.2 ka event. The white box in B marks the region of A.

We suggest that unlike northern China, where drought conditions pushed cultures such as the Xiaoheyan (5.0–4.2/4.0 ka) and Longshan cultures (4.5–4.0 ka) (Cai et al., Reference Cai, Cheng, Ma, Mao, Breitenbach, Zhang, Xue, Cheng, Edwards and An2021; Zhao et al., Reference Zhao, Tan, Yang, Pérez-Mejías, Brahim, Lan, Wang, Li, Wang, Zhang and Cheng2021), into recession in the late mid-Holocene stage, decreasing precipitation in south-central China was in general beneficial for cultural development. This mechanism has been used to explain the unprecedented prosperity of the Baodun culture (Zeng et al., Reference Zeng, Ma, Zhu, Song, Zhu, He, Chen, Huang, Jia and Guo2016; Jia et al., Reference Jia, Ma, Zhu, Guo, Xu, Guan, Zeng, Huang and Zhang2017) and the well-known Liangzhu culture (Zhang et al., Reference Zhang, Zhu, Liu and Jiang2005; Zhang et al., Reference Zhang, Cheng, Sinha, Spötl, Cai, Liu and Kathayat2021) in the lowlands of the upper and lower reaches of the Yangtze River in the 5.0-4.3 ka dry period.
After 4.3 ka, the regional climate transitioned gradually to wetter conditions, as evidenced by our speleothem data, which is consistent with the expansion of Yunmengze Lake in the floodplain (Zhou, Reference Zhou1994) and the increasing sea level in Japan (Kato et al., Reference Kato, Fukusawa and Yasuda2003). This may have threatened the majority of Shijiahe sites in low-lying lands. The floods during the 4.2 ka event may have also impeded the development of Shijiahe culture, although archaeological data show that water management systems to prevent floods appeared in some Qujialing and Shijiahe sites (e.g., Taojiahu, Xiaocheng, Menbanwan) (Liu, Reference Liu2021). As a result, the Shijiahe sites were greatly reduced and subsequent sites were located on higher-elevation land during 4.1–3.9 ka (Fig. 7A). In addition, a growing number of archaeological studies found the characteristics of artifacts (e.g., pottery, jade ware) changed drastically during this time compared with the early to middle Shijiahe stage, integrating new features from Wangwan III culture from the central plain (Han and Yang, Reference Han and Yang1997; He, Reference He2006). Hence, some archaeologists defined this culture system to be post-Shijiahe culture (Meng, Reference Meng1997) or named it after the archaeological sites, such as Sanfangwan culture (Wang, Reference Wang2007) and Xiaojiawuji culture (He, Reference He2006). This implies cultural exchanges occurred in the region during the Late Neolithic period, which are thought to be related to the Yu's Battle against Sanmiao Ethnic Groups (Han, Reference Han2020a, Reference Han2020b). Indeed, many archaeologists and historians have suggested the people of the Shijiahe culture were probably the Sanmiao tribe, and people of the Wangwan III culture were the Yu tribe (Han, Reference Han2020a, Reference Han2020b and references therein). It is plausible that Yu took advantage of the climate transition to expand southward and defeat the Sanmiao tribe, accelerating the fall of the Shijiahe culture (Li et al., Reference Li, Zhu, Wu, Li, Sun, Wang, Liu, Meng and Wu2013; Jia et al., Reference Jia, Ma, Zhu, Guo, Xu, Guan, Zeng, Huang and Zhang2017).
Similar climate deterioration was also identified in the upper and lower reaches of the Yangtze River during the 4.2 ka event, but their effects were different. Similar to the variations seen at Shijiahe sites, the archaeology and paleoclimatic studies in the Chengdu Plain indicate that Baodun settlements were forced to migrate from low-lying areas to higher elevations due to frequent floods (Zeng et al., Reference Zeng, Ma, Zhu, Song, Zhu, He, Chen, Huang, Jia and Guo2016; Jia et al., Reference Jia, Ma, Zhu, Guo, Xu, Guan, Zeng, Huang and Zhang2017). However, Liangzhu settlements, which were based in the Yangtze delta, had no buffer to protect them from floods. Catastrophic paleofloods or rising sea levels have been widely and directly connected to the demise of Liangzhu culture by archaeologists (Zhang et al., Reference Zhang, Zhu, Liu and Jiang2005; Zhang et al., Reference Zhang, Cheng, Sinha, Spötl, Cai, Liu and Kathayat2021). This implies that topographic features play an important role in cultural development.
CONCLUSIONS
Our study suggests that south-central China experienced a gradual dry-to-wet transition at ~4.3 ka, which is consistent with other records from southern and central China but in contrast to climatic conditions in northern China. However, both northern and southern China experienced several intense pluvial periods during the 4.2 ka event, leading to more than two megafloods in the Yellow River and Yangtze River regions. Taking into account the archaeological evidence and the DEM, we suggest that the development of rice-cultivating prehistoric cultures (Daxi, Qujialing, and Shijiahe cultures in succession) in Jianghan Plain was highly dependent on regional hydroclimatic conditions during the low-productivity stage, as well as regional topographic features. The settlement sites expanded in the river valley in the dry climate period of 5.6–4.3 ka. However, they were damaged afterward by enhanced rainfall and frequent floods. At the same time, the Wangwan III culture from the central plain attacked them, leading to the final collapse of the Shijiahe culture.
Financial Support
This research was supported by the Strategic Priority Research Program of Chinese Academy of Sciences (XDB40000000), the National Key Research and Development Program of China (2017YFA0603401), and the PIFI Program of Chinese Academy of Sciences (2020VCA0019). The dating work was partially supported by the U.S. National Science Foundation (1702816 to R.L.E.).