INTRODUCTION
In democratic societies, the level of redistribution is decided by the people through public deliberation and the election of governments which propose redistribution policies to find majorities. Public deliberation about redistribution can focus on different aspects, e.g. on the minimal necessary income or the proportional burden to be taken by individuals to reduce income inequality. This study analyzes whether the level of redistribution a society agrees upon can be manipulated by the way in which the issue of redistribution is presented. Specifically, we test if it makes a difference whether subjects have to decide on either a tax rate or a minimal income while the redistribution mechanism itself remains unchanged. In both instances, we utilize a simplified version of the Meltzer–Richard model which rests on proportional taxation providing an equal lump-sum payment for each group member (Meltzer and Richard, Reference Meltzer and Richard1981).
The Meltzer–Richard model has become the basic framework applied to explore redistribution in democratic societies (Alesina and Giuliano, Reference Alesina, Giuliano, Benhabib, Bisin and Jackson2011). Various studies utilize the Meltzer–Richard model to set up laboratory experiments on voting and redistribution with the focus on measuring preferred redistributive tax-levels (see Kittel et al. (Reference Kittel, Paetzel and Traub2015) for a review). Recent contributions by Esarey et al. (Reference Esarey, Salmon and Barrilleaux2012a) and Barber et al. (Reference Barber, Beramendi and Wibbels2013), for example, set up a laboratory experiment on voting and redistribution to disentangle the role of insurance vs. redistribution motives when people decide upon tax levels.
Independent from this strand of literature, group deliberation experiments conducted by Frohlich et al. (Reference Frohlich, Oppenheimer and Eavey1987a, Reference Frohlich, Oppenheimer and Eavey1987b) and Frohlich and Oppenheimer (Reference Frohlich and Oppenheimer1990, Reference Frohlich and Oppenheimer1992) indicate that people favor certain minimum income arrangements for redistribution. In these experiments, which were guided by the idea of exploring the empirical validity of elements of Rawl’s (Reference Rawls1971) theory of justice, subjects choose between alternative income distributions behind the veil of ignorance, i.e. they choose an income distribution not knowing where they will end up in the income distribution. Interestingly, the majority of subjects favor income distributions that combine the maximization of the average income with a moderate guaranteed minimum income (Michelbach et al., Reference Michelbach, Scott, Matland and Bornstein2003; Traub et al., Reference Traub, Seidl, Schmidt and Levati2005).Footnote 1 Even though the theoretical reasoning and experimental designs are quite different from this study, these findings highlight subjects’ propensity to aim for a secure basic income.
Existing research on the role of framing in taxation (Seidl and Traub, Reference Seidl and Traub2001; Cubitt et al., Reference Cubitt, Drouvelis and Gächter2011; Willinger and Ziegelmeyer, Reference Willinger and Ziegelmeyer1999) considers how frames affect individual perceptions of different tax schemes (see Chong and Druckman (Reference Chong and Druckman2007) for a review). This study, however, focuses on the redistributive consequences of frames when subjects have to decide about a collectively accepted level of redistribution in an anonymous group setting. We argue that a tax frame leads to different perceptions and therefore to different levels of redistribution than a minimum income frame. Our design allows us to analyze if the two different frames have an effect on the ideally preferred level of redistribution and also if the framing effect survives a purely numerical deliberation process that can be found in collective decisions.
As pointed out by Konow (Reference Konow2009), context determines the relative importance of normative principles individuals apply to distributional decisions. We presume that the tax rate vs. minimal income frame provides such a context by pointing toward different fairness concepts. Making decisions about a tax rate leads subjects to think about redistribution mainly in terms of equality and equity, whereas making decisions about a minimum income leads subjects to think about redistribution issues in terms of social need. Thus, we hypothesize that when subjects have to collectively find a minimal income, redistribution is higher because subjects consider less to what extend this minimum income implies relatively high tax rates. Conversely, we hypothesize, that subjects do not take fully into account that higher tax rates also imply higher transfers when they decide about a tax rate. However, this paper is not dedicated to analyze the transmission channel of how the different normative principles have an effect on the preferred level of redistribution. We expect that the difference outlives the deliberation process and finally leads to a higher implemented level of redistribution when subjects decide about a minimal income.
REDISTRIBUTION MECHANISM
Building on previous theoretical (e.g. Meltzer and Richard, Reference Meltzer and Richard1981) and experimental work (e.g. Kittel et al., Reference Kittel, Paetzel and Traub2015), we define a mechanism of redistribution for N individuals with endowments x 1, . . ., xN as
 $$\begin{equation}
y_i = (1-\tau )\,x_i + \tau \, \bar{x}
\end{equation}$$
where yi
is the income of individual i after redistribution under the implemented tax rate τ. The average income is denoted
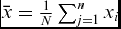 $\bar{x} = \frac{1}{N}\sum _{j=1}^n x_i$
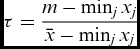
. If instead of a tax rate a minimal income m is implemented, the necessary tax rate to achieve m is computed by
 $$\begin{equation}
\tau = \frac{m - \min _j x_j}{\bar{x} - \min _j x_j}
\end{equation}$$
when the minimal income is within its natural bounds
 $\min _j x_j \le m \le \bar{x}$
.
Each tax rate corresponds to a minimal income and vice versa. The collective decision problem to settle on τ or m is identical regarding the social choice of a final distributional outcome. Hence, if differences occur, these differences are the result of a framing effect. Henceforth, we refer to a decision about τ as the TAX frame and a decision about m as the MIN frame.Footnote 2
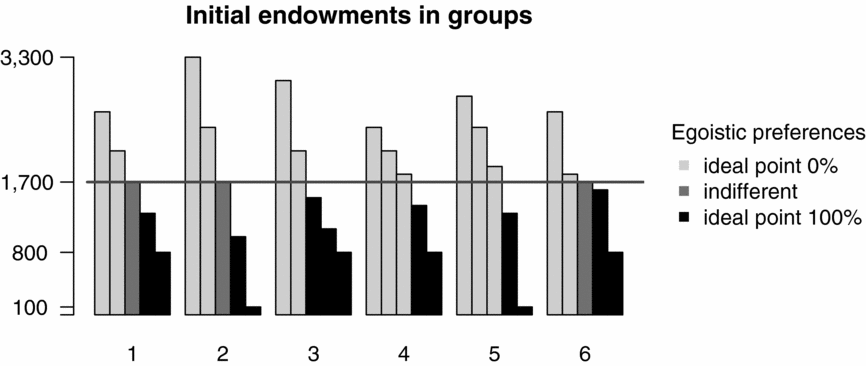
Individuals with an endowment below average (
 $x_i < \bar{x}$
) maximize their income through full redistribution (τ = 100%), which is their rational choice under egoistic preferences. Correspondingly, endowments above average (
 $x_i > \bar{x}$
) lead to a preference for no redistribution τ = 0%. Individuals with endowments of exactly
 $\bar{x}$
are indifferent because they will receive the average income under any tax rate. The distributional conflict in the group is thus polarized except for indifferent individuals.
In this one-dimensional conflict decided by majority rule, the individual with the median preference is pivotal. Hence, under egoistic payoff maximizing preferences, any non-equal distribution of endowments falls into one of three categories: (i) a majority for full redistribution, (ii) a majority for no redistribution, (iii) the median voter is indifferent. Indifferent voters can flip a coin or decide with regard to their social preferences (Camerer, Reference Camerer2003; Höchtl et al., Reference Höchtl, Sausgruber and Tyran2012; Traub et al., Reference Traub, Seidl and Schmidt2009). Under the premises of egoistic payoff maximizing preferences, other social preferences become relevant for the collective decision only if the median voter is indifferent.
EXPERIMENTAL DESIGN AND PROCEDURES
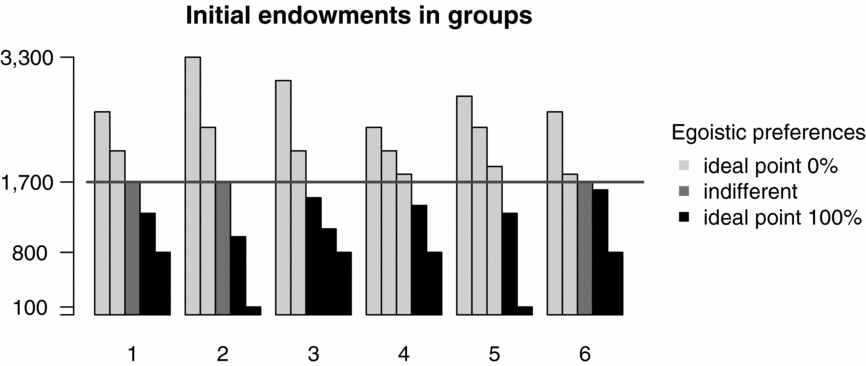
In each of totally six rounds, subjects were randomly assigned to groups of five. In each round, subjects received endowments from the pre-specified distributions via random assignments as displayed in Figure 1. Each distribution has an average endowment of
 $\bar{x}=1,700$
. The laboratory experiment conducted with z-tree (Fischbacher, Reference Fischbacher2007) consisted of the following stages:Footnote
3
-
1. Information about endowments and ideally preferred decision. Subjects were informed about their own endowments and the endowment of all other group members and about the average endowment (1,700 tokens in each round). Further on, subjects were privately asked to enter their ideally preferred minimum income or tax rate, respectively. Only valid values were accepted. The MIN frame instructions told subjects these were values between the endowment of the poorest group member and the average income. The TAX frame instructions stated that tax rates could be between 0% and 100%.
Figure 1Distributions of Endowments Used and Predictions on Subjects Egoistic Preferences.

-
2. Communication stage. Each subject had to make 10 proposals which appeared in a five-column table visible to all group members. The first proposals appeared in the table after the last group member confirmed its proposal. All other proposals appeared immediately after confirmation. A subject could enter its proposal number i + 1 only when all subjects had entered i proposals. The endowments were displayed throughout the whole communication stage. Subjects could only communicate by numbers to coordinate their final decisions.
-
3. Collective decision stage. After the 10th proposal, a decision box appeared where subjects had to enter their final decisions privately. A group decision was achieved when at least three subjects decided for the same number (majority rule). The net income was then computed using the redistributive mechanism explained in Section 2. If the group failed to reach a collective decision, the income was either 50% of the endowment or half of the average endowment whichever was lower.
-
4. Information payoff. Subjects were informed about the result of the collective decision and about their total net income at the end of the sixth period. The payoff in Euro was defined by a subject’s average earnings over six periods with an exchange rate of €0.005 per experimental token.
Subjects were recruited from the University of Oldenburg using the software ORSEE (Greiner, Reference Greiner2015). Implementing a between subjects design (two sessions for each frame) and a total of four sessions with 20 subjects each, delivered a dataset of 480 individual observations, six from each subject. The dataset is publicly available (Lorenz et al., Reference Lorenz, Paetzel and Tepe2015).
RESULTS
The dependent variable is the level of redistribution which we quantify as the tax rate τ. Groups decided implicitly about τ via Equation (2) in the MIN frame and directly in the TAX frame. Individuals’ preferred τ is stated by subjects when they saw their own endowment, the average endowment, and the endowments of the other four members of the group, but before any communication, decision, or implementation.
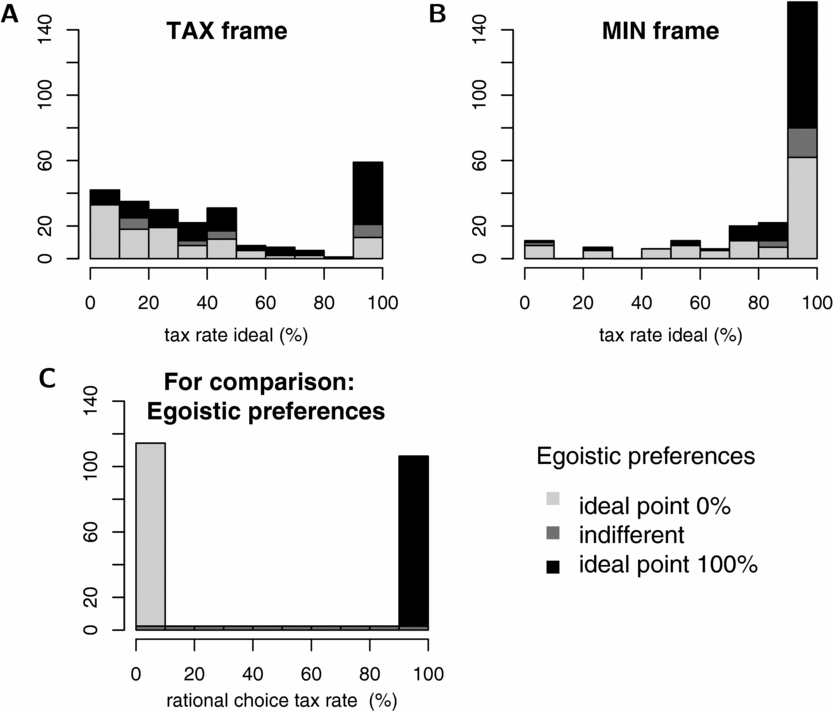
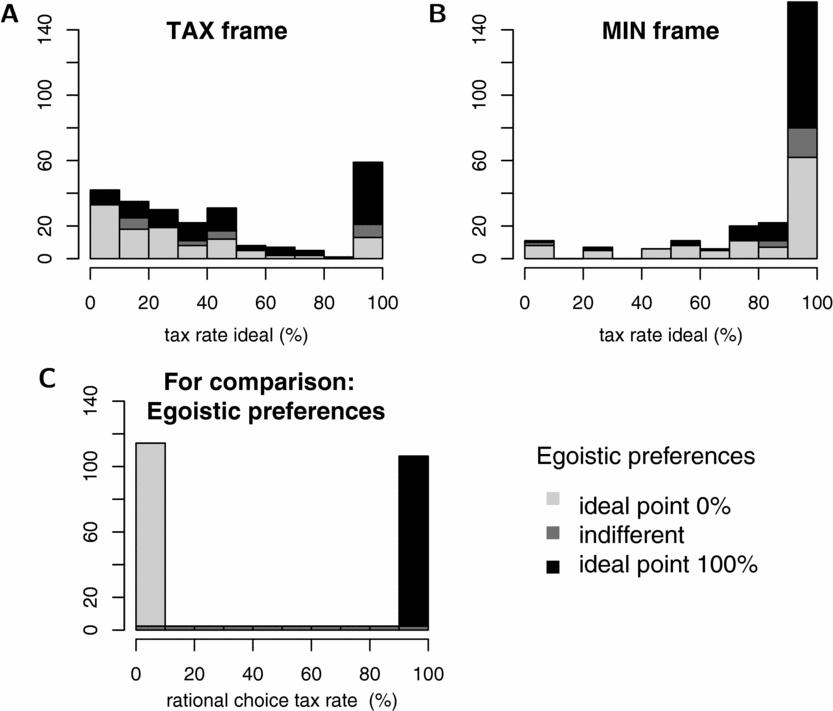
The ideally preferred tax rates of individuals in the TAX frame was on average 48% while the implicitly preferred tax rate in the MIN frame was 86%. This substantial difference is accompanied by large variation as shown in the histograms in Figure 2 A and B. The large bar close to 100% in the MIN frame shows that more than half of the ideally preferred minimal incomes are identical to the average income (146 out of 240, 61%). In the TAX frame, these are less than a quarter (59 out of 240, 25%); 67% of all ideally preferred tax rates are below or equal to 50%. This shows a strong framing effect when subjects are asked about their ideally preferred levels of redistribution.
Ideally Preferred Tax Rates. Histograms for the TAX (A) and the MIN (B) Frame with 240 Observations Each. (C) shows Rational Egoistic Preferences in the Same 240 Cases Based on the Distributions in Figure 1. Bin Intervals are Right-Closed. Example: 50% Belongs to Bin (40, 50].
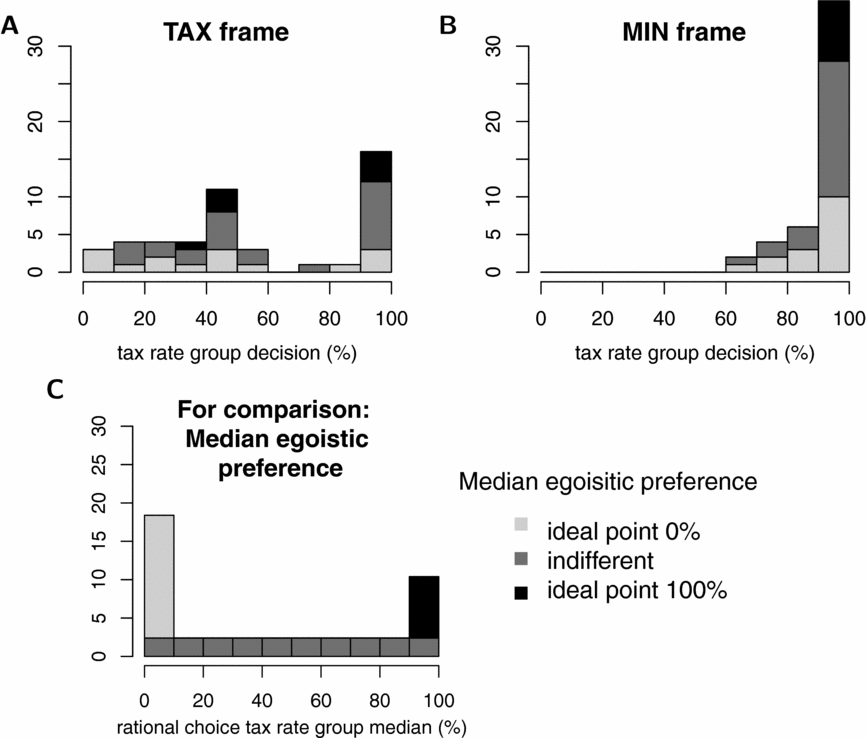
The framing effect outlived the deliberation process, after which at least three subjects had to decide for the same value of τ (or m, respectively) to achieve a group decision and avoid an individual loss for all. All groups but one achieved a group decision. (The failing group was in the TAX frame.) Histograms are shown in Figure 3 A and B. The average implemented tax rate in the TAX frame was 60% while it was 95% in the MIN frame.
Tax Rates Implemented in Groups. Histograms for the TAX (A) and the MIN (B) Frame with 48 Groups Each. (C) Shows Rational Egoistic Preferences of the Median Member of Groups for the 48 Groups.
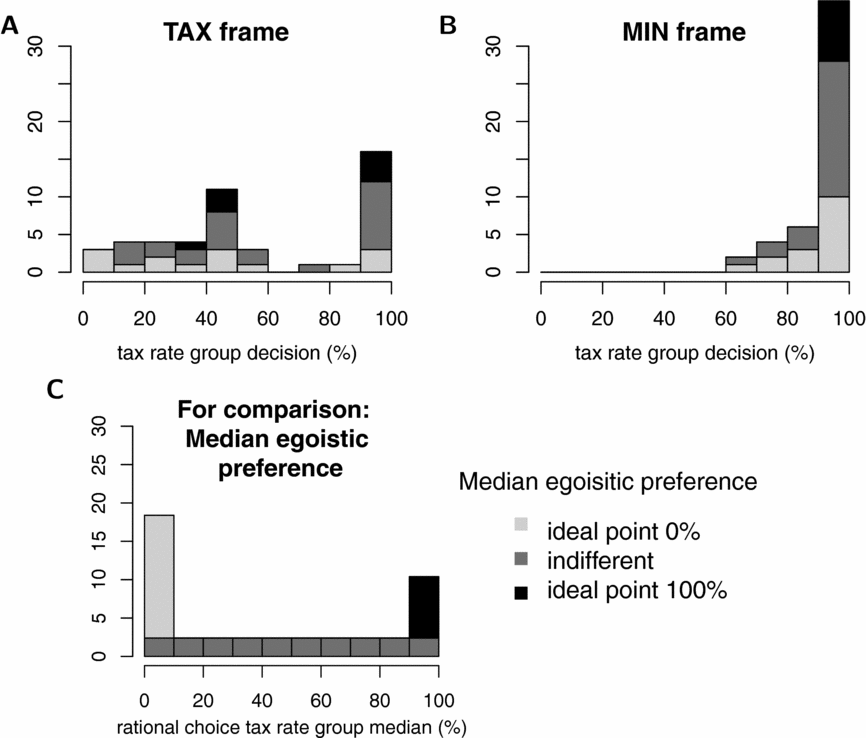
Comparing Figure 2 A and B with C and Figure 3 A and B with C shows that egoistic preferences can neither explain ideally preferred tax rates nor group decisions in either of the two frames.
When periods are pooled, the means of the ideally preferred tax is significantly higher in MIN than in TAX among treatments (t-test: t = 12.576 with p < 0.001 and Mann–Whitney: z = 10.641 with p < 0.001). Moreover, the means of the ideally preferred tax for each single distribution is also on a significantly higher level in frame MIN than in TAX (p < 0.001).
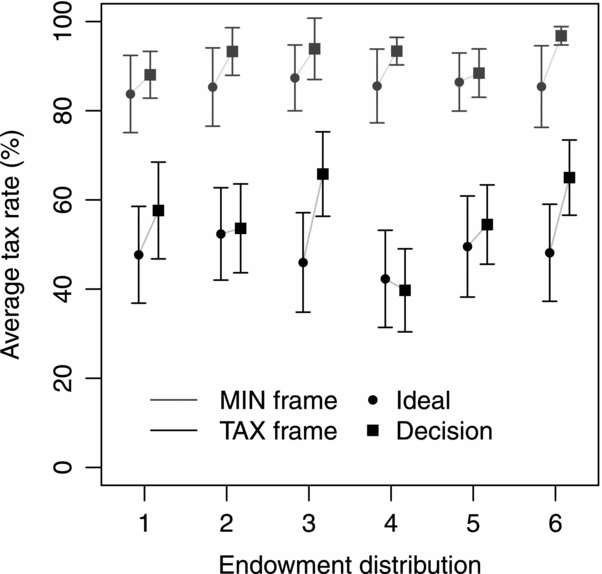
Figure 4 shows the means of the individually ideally preferred tax rates and the mean of the individual decisions grouped by the six different distributions. It is clearly visible that a framing effect exists over all distributions tested.
Mean of Ideally and Individually Preferred Tax Rates and Final Decisions Grouped by the Different Distributions of Endowments. Error Bars are 95%-Confidence Intervals (i.e. 1.96 Standard Errors Around the Mean). Each Connected Pair of Data Points Represents Means of the Same 40 Subjects.
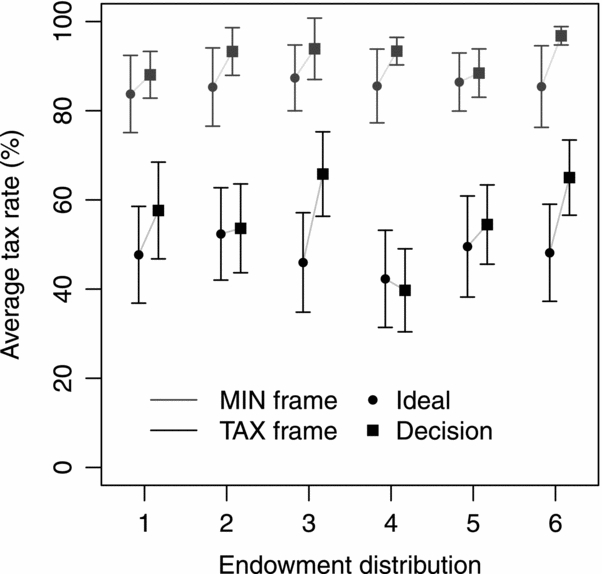
The means of the implemented tax is significantly higher in the MIN frame than in the TAX frame (pooled over all periods; t-test: t = 14.412 with p < 0.001 and Mann–Whitney: z = 11.287 with p < 0.001). Moreover, the means of the implemented tax rates for each single distribution is, at least on a p < 0.001 level, significantly higher in frame MIN than in TAX.
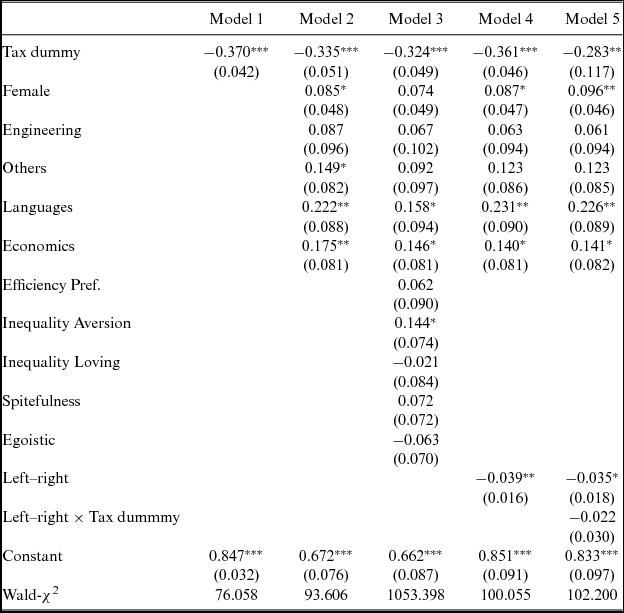
In a series of auxiliary regressions, we controlled for the effect of subjects’ socio-demographic characteristics (obtained from a post-experimental questionnaire) and subjects’ social preferences (obtained from a pre-experimental test using the measurement device suggested by Kerschbamer (Reference Kerschbamer2015)). It turns out that, independently of the selected model (OLS, Fixed, or Random) and different compositions of controls, the treatment-dummy for a participant in the TAX frame is always negative and significant and varies only by a small amount between regression models. See the model with random effects regressions in Table 1.
Determinants of Ideally Preferred Tax Rate
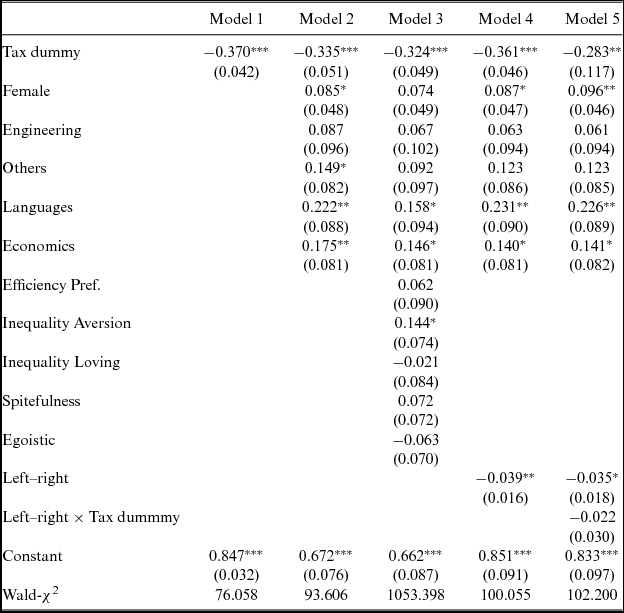
Table notes: N = 480. Dependent variable: Ideally preferred tax rates of individuals from [0,1]. Standard errors are clustered on individual level. Random-effect specification on the subjects level. *p ⩽ 0.10, **p ⩽ 0.05, ***p ⩽ 0.01. Standard errors in parentheses.
Additionally, we controlled for the effect of subjects’ stated political ideologies, measured on a 10-point left–right scale. Corroborating previous research by Esarey et al. (Reference Esarey, Salmon and Barrilleaux2012b) and Barber et al. (Reference Barber, Beramendi and Wibbels2013), we find that ideological left–right orientation has a substantively small but statistically significant negative effect on the ideally preferred tax rate. Entering a multiplicative interaction term between political ideology and the TAX dummy reveals that the effect of political ideology is not conditioned by the framing treatment. Thus, stated political ideology affects the level of the individually preferred tax rate but it does not mitigate or resolve the framing effect.
CONCLUDING DISCUSSION
Individual and majoritarian group decisions about the level of redistribution differ substantially between a minimal income and a tax rate frame. Framing the decision about a redistributive tax in terms of a minimal income increases the ideally preferred level of redistribution. This framing effect outlives a numerical deliberation process and leads to the implementation of a higher level of redistribution. We interpret these laboratory observations as evidence in support of what Konow (Reference Konow2009) proclaims as fairness depending on the eye of the beholder. If the eye of the beholder is focused on agreeing on a minimal income, the willingness to redistribute is higher than when it is focused on taxation. Our experiment can not fully disentangle if this is because MIN and TAX trigger different fairness concepts per se or if this comes through a misperception of the consequences of decisions, where either the burden of necessary taxation or the benefit of the transfer is underestimated.
This study explored the role of framing in the political economy of redistribution with exogenous endowment. Previous research on redistribution, however, indicates that pro-social behavior is affected if earned endowments are used instead of randomly assigned endowments (e.g. Kittel et al., Reference Kittel, Paetzel and Traub2015) or uncertain endowments (e.g. Saito, Reference Saito2013). This poses the question of whether the framing effect would change with endogenous endowments. We consider framing as a vehicle to manipulate the mental representations of reality (e.g. general redistribution vs. basic security). Framing thereby triggers the prevalence of different normative views on how to behave in certain situations (e.g. distributional justice vs. need-based justice). Under these premises, we expect that endogenously determined endowments lower the ideally preferred and the implemented level of redistribution but do not alter the magnitude of the framing effect itself. The empirical exploration of this expectation is left to further research.
The two mechanisms MIN and TAX are experimental vehicles that do not have one-to-one equivalents in real-world politics. There are no systems in which the redistributive tax rate is determined by a desired minimal income. There are also no systems, in which the revenue of a certain tax is directly transferred back to tax payers as equal lump-sums. Nevertheless, there is no doubt that both parameters, the income of the poorest and the level of taxation, are constantly at the top of the political agenda and heavily discussed outcomes of policy decisions. In real-world politics, the causal link between the income of the poorest and to what extent it is funded through spending taxpayers’ money is certainly less comprehensible to voters than in our laboratory democracy. In this respect, it is even more compelling to see that even if a simple direct relation between taxation and benefits exists, framing provides an effective tool to alter individual and collective decisions on redistributive taxation.
From a normative perspective, the framing effect can be regarded as a problem, because equal societal choices on redistribution are steered in fundamentally different directions only through a different way of presenting these choices. In real elections, voters typically decide on more abstract ideological positions of parties (left vs. right), where the desired level of redistribution is typically seen as a very important determinant of the ideological position (Downs, Reference Downs1957; Inglehart and Klingemann, Reference Inglehart, Klingemann, Budge, Crewe and Farlie1976; Sartori, Reference Sartori1976). In this context, our results confirm that it might be crucial for election results which policy frame is more salient in public debate (Chong and Druckman, Reference Chong and Druckman2007). Changing the frame in which the issue of redistribution is deliberated provides leverage to manipulate the final outcome of groups’ redistributive decisions. The effects we find, therefore, may explain why political debates of social vs. liberal economic policies often center on drawing the discourse to different policy frames; with liberals emphasizing the tax frame and socialists pronouncing the minimal income frame.