



1 Introduction
When a bluff body is immersed in a cross-current, an unsteady wake with vortex shedding can develop. If the body is flexible or flexibly mounted, the fluctuating forces associated with wake unsteadiness may lead to vibrations of the body. These structural responses, referred to as vortex-induced vibrations (VIV), involve a mechanism of synchronization, or lock-in, between body motion and vortex formation. VIV are a typical problem of fluid–structure interaction with a number of practical implications in engineering applications; they have been the object of many research works, as collected in Bearman (Reference Bearman1984), Sarpkaya (Reference Sarpkaya2004), Williamson & Govardhan (Reference Williamson and Govardhan2004) and Païdoussis, Price & de Langre (Reference Païdoussis, Price and de Langre2010).
VIV have been extensively studied through the canonical problem of a rigid circular cylinder immersed in uniform flow and free to oscillate in the cross-flow direction, i.e. the direction normal to the oncoming flow (Feng Reference Feng1968; Hover, Techet & Triantafyllou Reference Hover, Techet and Triantafyllou1998; Khalak & Williamson Reference Khalak and Williamson1999; Govardhan & Williamson Reference Govardhan and Williamson2000; Blackburn, Govardhan & Williamson Reference Blackburn, Govardhan and Williamson2001; Shiels, Leonard & Roshko Reference Shiels, Leonard and Roshko2001; Leontini, Thompson & Hourigan Reference Leontini, Thompson and Hourigan2006). Significant body oscillations occur over a well-defined range of values of the reduced velocity, defined as the inverse of the oscillator natural frequency non-dimensionalized by the inflow velocity and body diameter. In this range, called the lock-in range, the body oscillation frequency is equal to the vortex shedding frequency. The lock-in frequency (i.e. frequency of the flow–structure system within the lock-in range) can significantly depart from the oscillator natural frequency, but also from the vortex shedding frequency in the fixed body case (Strouhal frequency). The oscillation amplitude generally exhibits a bell-shaped evolution as a function of the reduced velocity. Peak amplitudes of the order of one body diameter can be observed, depending on the structural properties (e.g. structure/fluid mass ratio, structural damping; Khalak & Williamson (Reference Khalak and Williamson1997)) and Reynolds number (Re), based on the inflow velocity and body diameter (Govardhan & Williamson Reference Govardhan and Williamson2006). When the body is also free to oscillate in the in-line direction (i.e. the direction parallel to the oncoming flow), VIV naturally arise in this direction (Jauvtis & Williamson Reference Jauvtis and Williamson2004; Dahl et al.
Reference Dahl, Hover, Triantafyllou and Oakley2010; Navrose & Mittal Reference Mittal2013; Cagney & Balabani Reference Cagney and Balabani2014). The cross-flow response of the oscillator may be substantially altered by the addition of the in-line degree of freedom, and in-line vibrations with amplitudes up to half a diameter may be observed. However, at low Reynolds number, the in-line oscillation amplitude remains small, typically one or two orders of magnitude lower than the cross-flow response amplitude for
 $Re<200$
(Prasanth & Mittal Reference Prasanth and Mittal2008). The frequency ratio between the in-line and cross-flow vibrations is generally equal to
 $2$
, as expected due to the symmetry of the system.
Real physical systems where VIV are encountered are usually less symmetric than a circular cylinder immersed in a uniform current and their behaviour may thus differ from that noted in this canonical configuration. Previous studies have emphasized the impact of breaking the system symmetry, for example by forcing the circular body to rotate about its axis (Bourguet & Lo Jacono Reference Bourguet and Lo Jacono2014), by placing it close to a side wall (Zhao & Cheng Reference Zhao and Cheng2011) or by considering a non-circular cross-section (Nemes et al. Reference Nemes, Zhao, Lo Jacono and Sheridan2012). Typical effects of such symmetry breaking are the emergence of asymmetric wake patterns, the appearance of a time-averaged cross-flow force and the change of frequency ratio between the in-line and cross-flow forces and body oscillations. In the present work, the axial symmetry of the body geometry is preserved but the cross-flow symmetry of the flow–structure system is broken by immersing the circular cylinder in linear planar shear flow, i.e. a flow linearly sheared in the cross-flow direction.
The case of a fixed circular cylinder placed in planar shear flow has been addressed experimentally (Kiya, Tamura & Arie Reference Kiya, Tamura and Arie1980; Kwon, Sung & Hyun Reference Kwon, Sung and Hyun1992; Sumner & Akosile Reference Sumner and Akosile2003; Cao et al.
Reference Cao, Ozono, Hirano and Tamura2007) and numerically (Jordan & Fromm Reference Jordan and Fromm1972; Tamura, Kiya & Arie Reference Tamura, Kiya and Arie1980; Yoshino & Hayashi Reference Yoshino and Hayashi1984; Chew, Luo & Cheng Reference Chew, Luo and Cheng1997; Lei, Cheng & Kavanagh Reference Lei, Cheng and Kavanagh2000; Kang Reference Kang2006; Cao et al.
Reference Cao, Ozono, Tamura, Ge and Kikugawa2010). These prior studies, which mainly focused on linear shear, quantified the evolution of the vortex shedding frequency and time-averaged fluid forces as functions of the shear parameter (
 $\unicode[STIX]{x1D6FD}$
), defined as the inflow velocity gradient normalized by the cylinder diameter and the oncoming flow velocity at the centre of the body. A time-averaged cross-flow force, oriented from the high velocity side of the body to the low velocity side and whose magnitude tends to increase with
 $\unicode[STIX]{x1D6FD}$
, was observed in previous works. In the in-line direction, the positive time-averaged force was usually found to decrease as the shear parameter is increased. Some contradictory results were however reported in comparable Reynolds number ranges, for example an increase of the time-averaged in-line force with the shear parameter (Tamura et al.
Reference Tamura, Kiya and Arie1980), and no clear trend was identified concerning the effect of the shear on the vortex shedding frequency. The suppression of vortex shedding beyond a critical value of the shear parameter, observed by Kiya et al. (Reference Kiya, Tamura and Arie1980) and Tamura et al. (Reference Tamura, Kiya and Arie1980), but also by Cheng, Whyte & Lou (Reference Cheng, Whyte and Lou2007) in the case of a square cylinder, for
 $Re<200$
, was generally not reported in other works. In sheared current, the Reynolds number is defined based on the inflow velocity at the centre of the body. Due to experimental constraints and to avoid numerical issues related to the linear increase of the inflow velocity far from the body, the dimension of the flow domain was often restrained in the cross-flow direction, leading to large values of the blockage ratio (i.e. ratio between the body diameter and the width of the test section or computational domain). Kang (Reference Kang2006) suggested that the influence of the blockage ratio may justify the above mentioned discrepancies. The different regimes of the unconfined flow past a fixed circular cylinder still need to be clarified, especially for large values of the shear parameter.
The problem of a flexibly mounted circular cylinder immersed in planar shear flow has received much less attention than the fixed body case. Through numerical simulations, Singh & Chatterjee (Reference Singh and Chatterjee2014), Tu et al. (Reference Tu, Zhou, Bao, Fang, Zhang, Li and Han2014) and Zhang et al. (Reference Zhang, Fan, Chen, Li and Li2014) studied the impact of the shear on VIV. They reported that the structural response amplitudes tend to increase with the shear parameter. They also noted a switch from figure-eight-shaped trajectories of the body to ellipsoidal orbits, when
 $\unicode[STIX]{x1D6FD}$
is increased, in relation with the alteration of the in-line/cross-flow response frequency ratio induced by the symmetry breaking. Shear parameters up to
 $0.4$
were studied by Singh & Chatterjee (Reference Singh and Chatterjee2014) and Zhang et al. (Reference Zhang, Fan, Chen, Li and Li2014), for a single value of the reduced velocity. Tu et al. (Reference Tu, Zhou, Bao, Fang, Zhang, Li and Han2014) considered different values of the reduced velocity but a maximum shear parameter equal to
 $0.1$
. Previous works thus provide a partial vision of the flow–structure system behaviour in the shear parameter-reduced velocity domain. In particular, a wide interval of reduced velocities remains to be explored for
 $\unicode[STIX]{x1D6FD}>0.1$
, i.e. in the range of moderate to high values of the shear parameter.
In the present study, the case of a circular cylinder, either fixed or elastically mounted, and immersed in linear planar shear flow is examined on the basis of numerical simulation results, at Reynolds number 100. In order to shed light on the successive regimes of the flow (fixed body case) and flow–structure system (elastically mounted body case), a range of shear parameter values up to 0.4 is considered, in a large flow domain avoiding any blockage effects. In the elastically mounted body case, the cylinder is free to oscillate in the in-line and cross-flow directions and a range of reduced velocities, encompassing the lock-in range in the absence of shear, is investigated.
The paper is organized as follows. The physical model and the numerical method are described in § 2. The flow in the fixed body case is studied in § 3. The behaviour of the flow–structure system in the elastically mounted body case is analysed in § 4. The principal findings of the present work are summarized in § 5.
2 Physical model and numerical method
The physical configuration and its modelling are described in § 2.1. The numerical method employed and its validation are presented in § 2.2.
2.1 Physical system
A sketch of the physical configuration is presented in figure 1. A circular cylinder of diameter
 $D$
is immersed in linear planar shear flow. The body axis is aligned with the
 $z$
axis. The problem is studied in two dimensions, in the
 $(x,y)$
plane, and the oncoming flow is parallel to the
 $x$
axis. The coordinates
 $x$
and
 $y$
are non-dimensionalized by
 $D$
. The dimensional oncoming flow velocity is given by
 $\boldsymbol{U}^{\infty }=\{u^{\infty },0\}^{\text{T}}=\{u_{0}(1+\unicode[STIX]{x1D6FD}y),0\}^{\text{T}}$
, where
 $u_{0}$
is the free-stream velocity at the centre of the cylinder and
 $\unicode[STIX]{x1D6FD}$
is the non-dimensional shear parameter,
 $\unicode[STIX]{x1D6FD}=(\text{d}u^{\infty }/\text{d}y)/u_{0}$
. The Reynolds number based on
 $u_{0}$
and
 $D$
,
 $Re~=\unicode[STIX]{x1D70C}_{f}u_{0}D/\unicode[STIX]{x1D707}$
, where
 $\unicode[STIX]{x1D70C}_{f}$
and
 $\unicode[STIX]{x1D707}$
are the fluid density and dynamic viscosity, is set to
 $100$
. The two-dimensional incompressible Navier–Stokes equations are employed to predict the flow dynamics.
Sketch of the physical configuration.

In the elastically mounted body case, the cylinder is free to oscillate in the in-line (
 $x$
axis) and cross-flow (
 $y$
axis) directions. The origin of the
 $(x,y)$
frame coincides with the position of the body axis when the oscillator is at rest in quiescent fluid. The oscillator is characterized by the body mass per unit length
 $\unicode[STIX]{x1D70C}_{c}$
and the structural stiffnesses and damping ratios in both directions,
 $k_{i}$
and
 $\unicode[STIX]{x1D709}_{i}$
, where the subscript
 $i$
designates the
 $x$
or
 $y$
direction. All the physical quantities are non-dimensionalized by
 $D$
,
 $u_{0}$
and
 $\unicode[STIX]{x1D70C}_{f}$
. The non-dimensional mass is defined as
 $m=\unicode[STIX]{x1D70C}_{c}/\unicode[STIX]{x1D70C}_{f}D^{2}$
; it is set to
 $2$
. The non-dimensional cylinder displacement, velocity and acceleration in the
 $i$
direction are denoted by
 $\unicode[STIX]{x1D701}_{i}$
,
 $\dot{\unicode[STIX]{x1D701}_{i}}$
and
 $\ddot{\unicode[STIX]{x1D701}_{i}}$
. The force coefficient in the
 $i$
direction is defined as
 $C_{i}=2F_{i}/\unicode[STIX]{x1D70C}_{f}Du_{0}^{2}$
, where
 $F_{i}$
denotes the sectional fluid force in the
 $i$
direction. The body dynamics in the
 $i$
direction is governed by a forced, second-order oscillator equation:
 $$\begin{eqnarray}\ddot{\unicode[STIX]{x1D701}_{i}}+\frac{4\unicode[STIX]{x03C0}\unicode[STIX]{x1D709}_{i}}{U_{i}^{\ast }}\dot{\unicode[STIX]{x1D701}_{i}}+\left(\frac{2\unicode[STIX]{x03C0}}{U_{i}^{\ast }}\right)^{2}\unicode[STIX]{x1D701}_{i}=\frac{C_{i}}{2m}.\end{eqnarray}$$
The reduced velocity in the
 $i$
direction is defined as
 $U_{i}^{\ast }=1/f_{nat,i}$
, where
 $f_{nat,i}$
is the non-dimensional natural frequency in vacuum,
 $f_{nat,i}=D/2\unicode[STIX]{x03C0}u_{0}\sqrt{k_{i}/\unicode[STIX]{x1D70C}_{c}}$
. In the following, the structural stiffnesses are the same in both directions and the reduced velocity and natural frequency of the oscillator are referred to as
 $U^{\ast }=U_{x}^{\ast }=U_{y}^{\ast }$
and
 $f_{nat}=f_{nat,x}=f_{nat,y}$
. The damping ratio is set equal to zero in both directions to allow maximum amplitude oscillations (
 $\unicode[STIX]{x1D709}_{i}=0$
).
The behaviour of the flow–structure system is explored in the (
 $\unicode[STIX]{x1D6FD}$
,
 $U^{\ast }$
) parameter space. The shear parameter ranges from
 $0$
to
 $0.4$
and the reduced velocity from
 $2$
to
 $14$
. The same range of
 $\unicode[STIX]{x1D6FD}$
is considered in the fixed body case.
Schematic view of the mapping approach.

2.2 Numerical method
A general mapping approach for moving bodies in non-uniform flow, that avoids domain deformation and keeps uniform free-stream conditions is introduced. The mapping is decomposed in three steps, as depicted in figure 2. At step 1, the system is described in the laboratory frame
 $(x,y)$
. The cylinder axis is located at
 $\{\unicode[STIX]{x1D701}_{x},\unicode[STIX]{x1D701}_{y}\}_{(x,y)}^{\text{T}}$
and is moving with velocity
 $\{\dot{\unicode[STIX]{x1D701}_{x}},\dot{\unicode[STIX]{x1D701}_{y}}\}_{(x,y)}^{\text{T}}$
. The
 $(x_{c},y_{c})$
frame, attached to the body axis and in translation with respect to the
 $(x,y)$
frame, is indicated in the sketch. The flow is governed by the two-dimensional incompressible Navier–Stokes equations,
 $$\begin{eqnarray}\displaystyle & \displaystyle \unicode[STIX]{x1D735}\boldsymbol{\cdot }\boldsymbol{V}=0, & \displaystyle\end{eqnarray}$$
 $$\begin{eqnarray}\displaystyle & \displaystyle \frac{\unicode[STIX]{x2202}\boldsymbol{V}}{\unicode[STIX]{x2202}t}+(\boldsymbol{V}\boldsymbol{\cdot }\unicode[STIX]{x1D735})\boldsymbol{V}=-\unicode[STIX]{x1D735}P+\frac{1}{Re}\unicode[STIX]{x1D6FB}^{2}\boldsymbol{V}, & \displaystyle\end{eqnarray}$$
 $t$
is the non-dimensional time and
 $\boldsymbol{V}$
and
 $P$
denote the non-dimensional velocity and pressure fields. Far from the body, the non-dimensional free-stream velocity
 $\boldsymbol{V}^{\infty }$
is given by the shear flow condition. A no-slip condition is imposed at the body surface; therefore, the non-dimensional velocity of the fluid at the surface,
 $\boldsymbol{V}^{\boldsymbol{b}}$
, is equal to the body velocity. A change of the flow variables is considered at step 2. The new velocity field
 $\boldsymbol{V}_{\boldsymbol{u}}$
is associated with a uniform far-field condition
 $\boldsymbol{V}_{\boldsymbol{u}}^{\infty }$
and a non-uniform condition at the body surface
 $\boldsymbol{V}_{\boldsymbol{u}}^{\boldsymbol{b}}$
. At step 3, the system is described in the body frame
 $(x_{c},y_{c})$
. This frame change is accompanied by a new change of the flow variables. In the resulting formulation, the system is seen as a stationary cylinder immersed in a uniform but time-dependent flow. A new set of boundary conditions,
 $\boldsymbol{V}_{\boldsymbol{c}}^{\infty }$
and
 $\boldsymbol{V}_{\boldsymbol{c}}^{\boldsymbol{b}}$
, is obtained.
The time and space derivatives in the laboratory and body frames verify
 $$\begin{eqnarray}\displaystyle & \displaystyle {\displaystyle \frac{\unicode[STIX]{x2202}}{\unicode[STIX]{x2202}t}}={\displaystyle \frac{\unicode[STIX]{x2202}}{\unicode[STIX]{x2202}t_{c}}}-\dot{\unicode[STIX]{x1D701}_{x}}{\displaystyle \frac{\unicode[STIX]{x2202}}{\unicode[STIX]{x2202}x_{c}}}-\dot{\unicode[STIX]{x1D701}_{y}}{\displaystyle \frac{\unicode[STIX]{x2202}}{\unicode[STIX]{x2202}y_{c}}}, & \displaystyle\end{eqnarray}$$
 $$\begin{eqnarray}\displaystyle & \displaystyle {\displaystyle \frac{\unicode[STIX]{x2202}}{\unicode[STIX]{x2202}x}}={\displaystyle \frac{\unicode[STIX]{x2202}}{\unicode[STIX]{x2202}x_{c}}}, & \displaystyle\end{eqnarray}$$
 $$\begin{eqnarray}\displaystyle & \displaystyle {\displaystyle \frac{\unicode[STIX]{x2202}}{\unicode[STIX]{x2202}y}}={\displaystyle \frac{\unicode[STIX]{x2202}}{\unicode[STIX]{x2202}y_{c}}}. & \displaystyle\end{eqnarray}$$
 $x$
,
 $y$
,
 $t$
,
 $\boldsymbol{V}$
and
 $P$
by
 $x_{c}$
,
 $y_{c}$
,
 $t_{c}$
,
 $\boldsymbol{V}_{\boldsymbol{c}}$
and
 $P_{c}$
in the flow equations (2.2), can be expressed as follows:
 $$\begin{eqnarray}\displaystyle & \displaystyle \unicode[STIX]{x1D735}\boldsymbol{\cdot }\boldsymbol{V}_{\boldsymbol{c}}=0, & \displaystyle\end{eqnarray}$$
 $$\begin{eqnarray}\displaystyle & \displaystyle \frac{\unicode[STIX]{x2202}\boldsymbol{V}_{\boldsymbol{c}}}{\unicode[STIX]{x2202}t_{c}}+(\boldsymbol{V}_{\boldsymbol{c}}\boldsymbol{\cdot }\unicode[STIX]{x1D735})\boldsymbol{V}_{\boldsymbol{c}}=-\unicode[STIX]{x1D735}P_{c}+\frac{1}{Re}\unicode[STIX]{x1D6FB}^{2}\boldsymbol{V}_{\boldsymbol{ c}}+\boldsymbol{S}. & \displaystyle\end{eqnarray}$$
 $\boldsymbol{S}$
takes into account the frame motion and the shear of the oncoming flow. The
 $x$
and
 $y$
components of
 $\boldsymbol{S}$
are given by
 $$\begin{eqnarray}\displaystyle & \displaystyle S_{x}=-\ddot{\unicode[STIX]{x1D701}_{x}}-\unicode[STIX]{x1D6FD}(y_{c}+\unicode[STIX]{x1D701}_{y})\frac{\unicode[STIX]{x2202}V_{cx}}{\unicode[STIX]{x2202}x_{c}}-\unicode[STIX]{x1D6FD}(V_{cy}+\dot{\unicode[STIX]{x1D701}_{y}}), & \displaystyle\end{eqnarray}$$
 $$\begin{eqnarray}\displaystyle & \displaystyle S_{y}=-\ddot{\unicode[STIX]{x1D701}_{y}}-\unicode[STIX]{x1D6FD}(y_{c}+\unicode[STIX]{x1D701}_{y})\frac{\unicode[STIX]{x2202}V_{cy}}{\unicode[STIX]{x2202}x_{c}}, & \displaystyle\end{eqnarray}$$
 $V_{cx}$
and
 $V_{cy}$
are the
 $x$
and
 $y$
components of
 $\boldsymbol{V}_{\boldsymbol{c}}$
. In the fixed body case, the same formulation is employed, with
 $\unicode[STIX]{x1D701}_{i}=\dot{\unicode[STIX]{x1D701}_{i}}=\ddot{\unicode[STIX]{x1D701}_{i}}=0$
.
Equations (2.4) are solved numerically. The computations are performed with the finite-volume code Numeca Fine/Open (www.numeca.com) which employs a preconditioned multigrid method (Liu, Zheng & Sung Reference Liu, Zheng and Sung1998). Viscous and inviscid fluxes, as well as the source term
 $\boldsymbol{S}$
are computed via second-order schemes. A second-order time integration is performed using a dual-time stepping method with a Runge–Kutta scheme. At each time step, the structural dynamics equations (2.1) are solved implicitly following the same pseudo-time integration scheme as for the fluid equations.
The flow is discretized on a non-structured grid in a rectangular computational domain. The cylinder is located at
 $(x_{c},y_{c})=(0,0)$
. The domain extends from
 $x_{c}=-L_{x}/2$
to
 $x_{c}=L_{x}/2$
in the in-line direction and from
 $y_{c}=-L_{y}/2$
to
 $y_{c}=L_{y}/2$
in the cross-flow direction. An unsteady far-field condition based on the Riemann invariants is used at the external boundaries of the domain and is updated at each inner iteration, according to the velocity of the frame attached to the body. A non-uniform Dirichlet condition is used at the body surface. All the computations are initialized with a fixed body immersed in uniform flow.
A convergence study has been carried out in the fixed and elastically mounted body cases in order to set the numerical parameters. As an important effect of the blockage ratio was reported in the literature (Kang Reference Kang2006), particular attention was paid to the size of the computational domain. Some convergence results obtained in the elastically mounted body case have been selected and are presented in table 1. The root-mean-square (r.m.s.) values of the body displacement fluctuations and the dominant cross-flow oscillation frequencies
 $f_{y}$
, obtained for three sets of numerical parameters, are compared for
 $(\unicode[STIX]{x1D6FD},U^{\ast })=(0.15,6)$
and
 $(\unicode[STIX]{x1D6FD},U^{\ast })=(0.4,6)$
, i.e. for an intermediate value of the shear parameter and for the largest value studied in this work, at a reduced velocity where the cylinder exhibits large-amplitude vibrations, as shown in § 4.1. In this table and in the following, the symbol
 $^{\prime }$
designates the r.m.s. value of the variable fluctuation about its time-averaged value. Three grids are considered. All grids present the same resolution and only differ by the size of the computational domain. The grid resolution has been the object of a separate convergence study. Different time steps
 $\unicode[STIX]{x0394}t$
and numbers of inner iterations
 $n_{i}$
are considered in this table. For
 $\unicode[STIX]{x1D6FD}=0.15$
, significant discrepancies are noted between cases 1 and 2, while the results obtained in cases 2 and 3 are comparable. For
 $\unicode[STIX]{x1D6FD}=0.4$
, the responses show very low sensitivity to the numerical parameters, and the results obtained in the three cases are similar. The proximity of the responses in cases 2 and 3, for
 $\unicode[STIX]{x1D6FD}=0.15$
and
 $\unicode[STIX]{x1D6FD}=0.4$
, illustrates the convergence of the results with respect to the numerical parameters. The numerical parameters of case 2 were selected in this study. The corresponding grid is composed of
 $65\times 10^{3}$
cells. Complementary results on blockage effect and validation of the present simulation approach in the uniform flow case are presented in appendices A and B.
Influence of the domain size, time step and number of inner iterations on the body responses, for
 $U^{\ast }=6$
.

The analyses reported in this paper are based on time series of more than
 $50$
cycles of the system, collected after convergence of the time-averaged and r.m.s. values of the fluid force coefficients.
3 Fixed cylinder
The flow around the fixed cylinder immersed in sheared current is investigated over a range of
 $\unicode[STIX]{x1D6FD}$
in this section. The evolution of the fluid forces as functions of the shear parameter is examined in § 3.1. Different flow regimes are identified. They are analysed in § 3.2.
3.1 Fluid forces
The time-averaged fluid force coefficients are plotted as functions of
 $\unicode[STIX]{x1D6FD}$
in figure 3(a). In this plot and in the following,
 $\overline{\phantom{a}}$
designates the time-averaged value. In the in-line direction, the time-averaged force globally decreases as the shear parameter is increased. Three branches can be identified. In the first branch (
 $\unicode[STIX]{x1D6FD}\in [0,0.2]$
),
 $\overline{C_{x}}$
slowly decreases as a function of
 $\unicode[STIX]{x1D6FD}$
. A similar trend was observed by Lei et al. (Reference Lei, Cheng and Kavanagh2000), Kang (Reference Kang2006) and Cao et al. (Reference Cao, Ozono, Tamura, Ge and Kikugawa2010) in the same range of
 $\unicode[STIX]{x1D6FD}$
, at comparable Reynolds numbers. As the shear parameter is increased above
 $0.2$
,
 $\overline{C_{x}}$
reaches the second branch (
 $\unicode[STIX]{x1D6FD}\in [0.2,0.3]$
), with substantially lower values than in the first branch. In this second branch,
 $\overline{C_{x}}$
remains close to constant as a function of
 $\unicode[STIX]{x1D6FD}$
.
 $\overline{C_{x}}$
is also constant in the third branch, which corresponds to the range
 $\unicode[STIX]{x1D6FD}\in [0.3,0.4]$
. A negative time-averaged force is noted in the cross-flow direction. The three branches are less clearly defined but still visible in the evolution of
 $\overline{C_{y}}$
. In the first branch,
 $\overline{C_{y}}$
linearly decreases as a function of
 $\unicode[STIX]{x1D6FD}$
; this evolution is consistent with the data reported in previous works. At higher shear (second and third branches),
 $\overline{C_{y}}$
is close to constant. The r.m.s. values of the force coefficient fluctuations are plotted in figure 3(b). In the first branch, the force fluctuations tend to increase with the shear. Distinct trends are noted during the transition between the first and second branches:
 $C_{y}^{\prime }$
abruptly drops while
 $C_{x}^{\prime }$
slightly increases. In the second branch, the force fluctuations increase as functions of
 $\unicode[STIX]{x1D6FD}$
in both directions. Residual oscillations can be noted up to
 $\unicode[STIX]{x1D6FD}=0.33$
approximately, but the force fluctuations tend to vanish in the third branch.
Fluid force statistics in the fixed body case: (a) time-averaged values of the fluid force coefficients and (b) r.m.s. values of the fluid force coefficient fluctuations as functions of
 $\unicode[STIX]{x1D6FD}$
, in both directions. Coloured symbols in (a) represent the values of
 $\overline{C_{x}}$
obtained in the elastically mounted body case, in selected points of the (
 $\unicode[STIX]{x1D6FD}$
,
 $U^{\ast }$
) parameter space indicated in figure 8(c).

The first two branches identified in figure 3 are called branches L and H, in reference to the low and high values of
 $\unicode[STIX]{x1D6FD}$
. The third branch, where the constant fluid forcing suggests a steady flow behaviour, is called branch S. The branches are indicated in figure 3(a).
Fluid force spectral content in the fixed body case: power spectral density of the fluid force coefficient as a function of
 $\unicode[STIX]{x1D6FD}$
, in the (a) in-line and (b) cross-flow directions. For each
 $\unicode[STIX]{x1D6FD}$
, the power spectral density is normalized by the magnitude of its largest peak. The colour levels range from
 $0$
(white) to
 $1$
(black). Coloured symbols in (a) represent the dominant frequency of the in-line force obtained in the elastically mounted body case, in selected points of the (
 $\unicode[STIX]{x1D6FD}$
,
 $U^{\ast }$
) parameter space indicated in figure 8(c).

The spectral contents of the fluctuating fluid forces are examined in figure 4, which represents, for each direction, the power spectral density (PSD) of the force coefficient as a function of
 $\unicode[STIX]{x1D6FD}$
. Unless otherwise stated, the spectral analyses reported in this paper are based on the Fourier transform of the entire time series collected after convergence. When the oncoming flow is uniform (
 $\unicode[STIX]{x1D6FD}=0$
), the fluid forces are dominated by a single frequency (i.e. sinusoidal) and the in-line force fluctuations occur at twice the cross-flow force frequency, as expected due to the cross-flow symmetry of the configuration. For
 $\unicode[STIX]{x1D6FD}>0$
, the symmetry is broken and a spectral component emerges, at the cross-flow force frequency, in the spectrum of
 $C_{x}$
; the relative contribution of this new component increases as a function of
 $\unicode[STIX]{x1D6FD}$
and it becomes predominant close to
 $\unicode[STIX]{x1D6FD}=0.1$
.
The three branches identified above on the basis of the force statistics are associated with distinct frequency contents. The force frequencies slightly decrease as functions of
 $\unicode[STIX]{x1D6FD}$
on branch L. After a non-monotonic behaviour around
 $\unicode[STIX]{x1D6FD}=0.2$
, they reach a plateau in the H-branch region, where they are found to be much lower than in the L-branch region. On branch H, other harmonics appear in the force spectra. In the cross-flow direction, their amplitudes are limited and
 $C_{y}$
remains close to harmonic. The relative contribution of each harmonic to
 $C_{x}$
spectrum varies as a function of
 $\unicode[STIX]{x1D6FD}$
and the resulting signal is generally not harmonic. For
 $\unicode[STIX]{x1D6FD}>0.3$
, in the S-branch region, the force fluctuations tend to disappear and the PSD are not computed.
The data reported in figures 3 and 4 reveal non-monotonic evolutions of the fluid forces in the region of transition between branches L and H. In this region, the flow solution appears to switch from one branch to the other. This behaviour may indicate an overlap of branches L and H. It is recalled that, in the present work, all the simulations are initialized with a fixed cylinder immersed in uniform flow. Additional simulations with different initial conditions have shown that hysteresis effects may be encountered in the L–H transition region.
The analysis of the fluid forces suggests that the flow undergoes three successive regimes within the range of
 $\unicode[STIX]{x1D6FD}$
under study. These regimes are investigated in the following.
3.2 Flow regimes
Analysis of the three flow regimes identified in the fixed body case: (a) schematic view of the cross-flow force dominant frequency as a function of
 $\unicode[STIX]{x1D6FD}$
; (b,c,d) selected time series of the cross-flow force coefficient (solid) and spanwise vorticity at
 $(x,y)=(10,0)$
(dashed), and instantaneous iso-contours of the spanwise vorticity (
 $\unicode[STIX]{x1D714}_{z}\in [-\unicode[STIX]{x1D6FD}-1,-\unicode[STIX]{x1D6FD}+1]$
) in the vicinity of the body at selected instants (indicated by vertical dashed lines in the time series), for (b)
 $\unicode[STIX]{x1D6FD}=0.1$
, (c)
 $\unicode[STIX]{x1D6FD}=0.25$
and (d)
 $\unicode[STIX]{x1D6FD}=0.4$
. The black triangle in the snapshots indicates the monitor point where the vorticity is sampled.

A schematic view of the evolution of the cross-flow force dominant frequency (
 $f_{C_{y}}$
) as a function of
 $\unicode[STIX]{x1D6FD}$
is presented in figure 5(a). The three regions of the parameter space associated with the branches identified in § 3.1 (L, H and S) are indicated in this plot. A typical value of
 $\unicode[STIX]{x1D6FD}$
is selected in each region in order to describe the main properties of the corresponding flow regime.
The flow regime associated with branch L (
 $\unicode[STIX]{x1D6FD}\in [0,0.2]$
), referred to as regime L in the following, is examined in figure 5(b), for
 $\unicode[STIX]{x1D6FD}=0.1$
. Time series of the cross-flow force coefficient and spanwise vorticity (
 $\unicode[STIX]{x1D714}_{z}$
) at
 $(x,y)=(10,0)$
are plotted over a period of
 $C_{y}$
(
 $1/f_{C_{y}}$
, where, as mentioned above,
 $f_{C_{y}}$
denotes the dominant frequency of
 $C_{y}$
). Both quantities are close to sinusoidal and oscillate at the same frequency. Instantaneous vorticity fields at four selected instants are presented below the time series. Vorticity contours are centred on the background vorticity induced by the oncoming shear (
 $\unicode[STIX]{x1D714}_{z}=-\unicode[STIX]{x1D6FD}$
). It can be noted that the shear slightly alters the antisymmetric nature of the wake pattern, as also reported in previous works (Kang Reference Kang2006; Cao et al.
Reference Cao, Ozono, Tamura, Ge and Kikugawa2010); in particular, the negative (blue) vortices are convected faster than the positive (orange) ones. However, the alternating vortex shedding pattern remains globally comparable to the vortex street developing in uniform flow and the shedding frequency, equal to
 $f_{C_{y}}$
, is close to that observed for
 $\unicode[STIX]{x1D6FD}=0$
.
The second region emphasized in figure 5(a) corresponds to the range
 $\unicode[STIX]{x1D6FD}\in [0.2,0.3]$
. The associated flow regime, called regime H, is depicted in figure 5(c), for
 $\unicode[STIX]{x1D6FD}=0.25$
. The dominant frequency of
 $C_{y}$
, which is substantially lower than in the first region, is used to define the time interval over which the time series are plotted. Other harmonic contributions appear in this region, as previously noted in the forces spectra (figure 4). The structure of the wake differs from the pattern observed in regime L. The typical length scales of the shear layers and wake vortices are larger in the present regime. Moreover, the wake does not exhibit a vortex street pattern: the positive (orange) vortices, as the vortex shed in snapshot 1, are not convected downstream; instead, they remain close to the body and rapidly dissipate. The vortex shedding frequency can be established based of the shedding of the negative (blue) vortices. It coincides with
 $f_{C_{y}}$
, which is also the dominant frequency of
 $\unicode[STIX]{x1D714}_{z}$
. The lower harmonic component identified in figure 4(b) implies that two consecutive shedding periods are not exactly identical. However, the impact of the low harmonic component on the flow appears to be limited and no significant alteration of the wake pattern is noted from one period of shedding to the other.
The third region (regime S) identified in figure 5(a) corresponds to the range
 $\unicode[STIX]{x1D6FD}\in [0.3,0.4]$
. In this region, the fluid force fluctuations vanish and the wake exhibits a steady triangular pattern, as illustrated in figure 5(d), for
 $\unicode[STIX]{x1D6FD}=0.4$
. This triangular pattern is comparable to that reported by Cheng et al. (Reference Cheng, Whyte and Lou2007) in the case of a square cylinder, but it was not previously observed for a circular cylinder. The flow structure presents some similarities with the steady wake observed past a rotating circular cylinder, a configuration that also involves different flow velocities on the upper (
 $y>0$
) and lower (
 $y<0$
) parts of the cylinder (e.g. Mittal & Kumar Reference Mittal and Kumar2003; Rao et al.
Reference Rao, Radi, Leontini, Thompson, Sheridan and Hourigan2015). The residual oscillations of the fluid forces that persist around
 $\unicode[STIX]{x1D6FD}=0.33$
(figure 3
b) are not associated with vortex shedding but with a smooth, low-amplitude undulation of the triangular wake pattern, which completely disappears once the shear parameter is further increased.
Behaviour of the saddle point in the vicinity of the body: (a–c) instantaneous streamlines and iso-contours of the spanwise vorticity (
 $\unicode[STIX]{x1D714}_{z}\in [-\unicode[STIX]{x1D6FD}-1,-\unicode[STIX]{x1D6FD}+1]$
) for (a)
 $\unicode[STIX]{x1D6FD}=0.15$
, (b)
 $\unicode[STIX]{x1D6FD}=0.25$
and (c)
 $\unicode[STIX]{x1D6FD}=0.4$
; (d) time-averaged values of the saddle point coordinates and (e) r.m.s. values of the saddle point coordinate fluctuations, as functions of
 $\unicode[STIX]{x1D6FD}$
. The position of the saddle point in the inviscid solution
 $(0,y_{s}^{inv})$
is indicated by a diamond symbol in (a–c) and dashed lines in (d).

A joint visualization of an instantaneous vorticity field and instantaneous streamlines is presented in figure 6(a–c), for three selected values of
 $\unicode[STIX]{x1D6FD}$
, one for each flow regime. The streamlines reveal the presence of a saddle point in the flow, at a variable distance from the body. The analytical solution of the inviscid flow around a circular cylinder placed in sheared current predicts the existence of a saddle point located at
 $(x,y)=(0,y_{s}^{inv})$
, where
 $y_{s}^{inv}<0$
and
 $|y_{s}^{inv}|$
decreases as a function of
 $\unicode[STIX]{x1D6FD}$
(Batchelor Reference Batchelor2000). The position of the saddle point in the inviscid solution is indicated by a diamond symbol in the plots. The time-averaged values of the saddle point coordinates
 $(x_{s},y_{s})$
and the r.m.s. values of their fluctuations are plotted in figure 6(d,e). The saddle point issued from the present viscous simulation is shifted downstream; its time-averaged in-line position tends to zero as the shear increases. The time-averaged cross-flow position of the saddle point is close to the position predicted by the inviscid solution (grey dashed line in figure 6
d). Overall, the saddle point gets closer to the body as
 $\unicode[STIX]{x1D6FD}$
increases. In regime H (figure 6
b), the positive vortices appear to be trapped in the saddle point region. It can be noted that in regime S (figure 6
c), the lower corner of the steady triangular wake pattern coincides with the position of the saddle point. Large-amplitude oscillations of the saddle point position are observed in regime H (figure 6
e), where the saddle point is in close proximity to the recently shed vortices; these oscillations occur at the vortex shedding frequency. In the two other regimes, the saddle point does not oscillate: in regime L, the saddle point is far from the unsteady wake; in regime S, the wake is steady.
To summarize, the flow past the fixed cylinder exhibits three distinct regimes in the range
 $\unicode[STIX]{x1D6FD}\in [0,0.4]$
. In regime L, for
 $\unicode[STIX]{x1D6FD}\in [0,0.2]$
, the flow dynamics, including the vortex shedding frequency (typical frequency,
 $f_{L}=0.16$
) and the wake pattern, remain close to those observed in uniform current. The main impact of the shear in this first regime concerns the shift of the in-line/cross-flow force frequency ratio and the appearance of a negative time-averaged force in the cross-flow direction. A second unsteady flow regime is uncovered for
 $\unicode[STIX]{x1D6FD}\in [0.2,0.3]$
. This regime (H) is associated with a major reduction of the vortex shedding frequency (typical frequency,
 $f_{H}=0.075$
) and a reconfiguration of the wake which exhibits a pronounced asymmetry compared to the vortex street developing in regime L. The forces are substantially altered by the shear, in particular,
 $\overline{C_{x}}$
significantly decreases. The flow unsteadiness is synchronized with an oscillation of the saddle point appearing close to the body, a phenomenon that is not observed in the other regimes. For
 $\unicode[STIX]{x1D6FD}\in [0.3,0.4]$
, in regime S, the flow is found to be steady and the wake is characterized by a triangular pattern whose lower corner is the (stationary) saddle point.
The impact of the shear on the flow–structure system behaviour, once the body is free to oscillate, is studied in the next section.
4 Elastically mounted cylinder
This section focuses on the case where the cylinder, immersed in a sheared current, is elastically mounted and free to vibrate in both directions. The behaviour of the flow–structure system is analysed over the same range of
 $\unicode[STIX]{x1D6FD}$
as in the fixed body case addressed in the previous section. An overview of the structural responses is presented in § 4.1. The different flow–structure interaction regimes are examined in § 4.2.
4.1 Structural responses
The time-averaged displacements of the body as functions of
 $\unicode[STIX]{x1D6FD}$
and
 $U^{\ast }$
are plotted in figure 7. By considering the time-averaged form of the structure dynamics (2.1), the time-averaged displacements can be expressed as
 $\overline{\unicode[STIX]{x1D701}_{i}}=\overline{C_{i}}{U^{\ast }}^{2}/8\unicode[STIX]{x03C0}^{2}m$
. Estimates of
 $\overline{\unicode[STIX]{x1D701}_{i}}$
, based on this expression and the values of
 $\overline{C_{i}}$
in the fixed body case, are indicated by dashed lines in figure 7. Even if the global trends are reasonably predicted, it appears that the values of
 $\overline{\unicode[STIX]{x1D701}_{x}}$
and
 $\overline{\unicode[STIX]{x1D701}_{y}}$
cannot be accurately estimated on the basis of the fixed body case results. Substantial deviations are observed: the negative time-averaged cross-flow force noted in the fixed body case could suggest that
 $\overline{\unicode[STIX]{x1D701}_{y}}$
remains negative, which is not always the case (
 $\unicode[STIX]{x1D6FD}=0.4$
in figure 7
b).
Time-averaged displacements of the body: (a)
 $\overline{\unicode[STIX]{x1D701}_{x}}$
and (b)
 $\overline{\unicode[STIX]{x1D701}_{y}}$
as functions of
 $U^{\ast }$
, over a range of
 $\unicode[STIX]{x1D6FD}$
. For each value of
 $\unicode[STIX]{x1D6FD}$
, a dashed line indicates the displacement associated with the time-averaged force in the fixed body case.

Body oscillation amplitudes: maximum (a) in-line and (b) cross-flow response amplitudes as functions of
 $\unicode[STIX]{x1D6FD}$
and
 $U^{\ast }$
, and (c) iso-contours of the typical oscillation amplitude
 $A$
in the
 $(\unicode[STIX]{x1D6FD},U^{\ast })$
parameter space. The region of large-amplitude responses (
 $A>0.15$
) and regimes L, H and S in the absence of large-amplitude oscillations are indicated in (c). The coloured symbols in (c) indicate the selected points represented in figures 3(a) and 4(a).

The maximum amplitudes of body oscillations,
 $\unicode[STIX]{x1D701}_{x}^{m}$
and
 $\unicode[STIX]{x1D701}_{y}^{m}$
, defined as the average of the highest
 $10\,\%$
of the displacement fluctuation amplitudes (Hover et al.
Reference Hover, Techet and Triantafyllou1998), are plotted as functions of
 $\unicode[STIX]{x1D6FD}$
and
 $U^{\ast }$
in figure 8(a,b). These plots emphasize the impact of the shear on the oscillatory responses. In each direction, the peak amplitude of the response tends to increase with
 $\unicode[STIX]{x1D6FD}$
. The amplification is particularly pronounced in the in-line direction where the response reaches
 $2$
body diameters for
 $\unicode[STIX]{x1D6FD}=0.4$
, versus
 $0.03$
diameters in uniform current. A maximum amplitude of
 $1.3$
diameters is noted in the cross-flow direction. A typical amplitude of response can be defined as
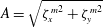 $A=\sqrt{{\unicode[STIX]{x1D701}_{x}^{m}}^{2}+{\unicode[STIX]{x1D701}_{y}^{m}}^{2}}$
.
 $A$
is the maximum displacement that the body can possibly exhibit with amplitudes
 $\unicode[STIX]{x1D701}_{x}^{m}$
and
 $\unicode[STIX]{x1D701}_{y}^{m}$
. Iso-contours of
 $A$
in the (
 $\unicode[STIX]{x1D6FD}$
,
 $U^{\ast }$
) parameter space are plotted in figure 8(c). The region of large-amplitude vibrations, defined as the region of the parameter space where
 $A>0.15$
, is indicated in this figure. Large-amplitude vibrations occur over the entire range of
 $\unicode[STIX]{x1D6FD}$
investigated, even beyond
 $\unicode[STIX]{x1D6FD}=0.3$
where a steady flow was observed in the fixed body case (§ 3). At low shear, for
 $\unicode[STIX]{x1D6FD}<0.2$
approximately, large-amplitude vibrations develop on a relatively narrow range of
 $U^{\ast }$
comparable to that noted in uniform flow. This range rapidly widens around
 $\unicode[STIX]{x1D6FD}=0.2$
. For
 $\unicode[STIX]{x1D6FD}\geqslant 0.2$
, large-amplitude vibrations occur up to the maximum reduced velocity considered in this study (
 $U^{\ast }=14$
).
The different regimes of the flow–structure system are explored in the following.
4.2 Flow–structure interaction regimes
Three regimes of the flow–structure system are encountered outside the region of large-amplitude vibrations. Regarding the flow dynamics, these regimes are similar to those previously described in the fixed body case in § 3 (regimes L, H and S), i.e. the flow and fluid forcing features identified in the absence of body motion are not altered by the low-amplitude oscillations. The areas of the parameter space associated with these regimes are indicated in figure 8(c).
To illustrate the persistence of regimes L, H and S in the elastically mounted body case, in the absence of large-amplitude vibrations, the time-averaged value of the in-line force coefficient and its dominant frequency, in selected points of the parameter space (coloured symbols in figure 8 c), are reported in figures 3(a) and 4(a). The results obtained in the fixed and elastically mounted body cases are very close. The slight differences can be attributed to the fact that, in the elastically mounted body case, the existence of a negative time-averaged force in the cross-flow direction induces a shift of the cylinder cross-flow position and thus, a slight modification of the effective Reynolds number and shear parameter seen by the body.
Within the region of large-amplitude vibrations, three other regimes of the flow–structure system are uncovered. These regimes can be clearly identified on the basis of the structural response frequency. The cross-flow response frequency ratio, defined as
 $f_{y}^{\ast }=f_{y}/f_{nat}$
with
 $f_{y}$
the dominant frequency of
 $\unicode[STIX]{x1D701}_{y}$
(based on the Fourier transform of the entire time series), is plotted as a function of
 $\unicode[STIX]{x1D6FD}$
and
 $U^{\ast }$
in figure 9; only the points located in the region of large-amplitude vibrations (figure 8
c) are considered in this plot.
Cross-flow response frequency ratio in the region of large-amplitude vibrations:
 $f_{y}^{\ast }$
as a function of
 $U^{\ast }$
, over a range of
 $\unicode[STIX]{x1D6FD}$
. Typical frequencies of regimes L and H (
 $f_{L}=0.16$
and
 $f_{H}=0.075$
), normalized by the oscillator natural frequency, are indicated by dashed lines.

Flow–structure interaction regimes: iso-contours of (a)
 $f_{y}^{\ast }$
, (b)
 $\unicode[STIX]{x1D701}_{x}^{m}$
, (c)
 $\unicode[STIX]{x1D701}_{y}^{m}$
, (d)
 $C_{x}^{\prime }$
and (e)
 $C_{y}^{\prime }$
, in the
 $(\unicode[STIX]{x1D6FD},U^{\ast })$
parameter space. In each plot, the map of the flow–structure interaction regimes is overlaid on the iso-contours. A plain black line delimitates the large-amplitude vibration region. A striped area indicates the region of irregular responses studied in § 4.2.3. Blue symbols denote the points examined in figures 12, 14 and 15.

In the low-shear region (
 $\unicode[STIX]{x1D6FD}<0.2$
), the impact of the shear on the response frequency is limited and the frequencies collapse; the corresponding branch is called VL (i.e. vibratory, low shear). On this branch, the response frequency, close to
 $f_{L}$
(a typical frequency of regime L,
 $f_{L}=0.16$
) at low reduced velocities, deviates from this frequency and gets closer to the oscillator natural frequency (
 $f_{y}^{\ast }\approx 1$
) as
 $U^{\ast }$
is increased.
In the high-shear region (
 $\unicode[STIX]{x1D6FD}\geqslant 0.2$
), the response frequency generally departs from
 $f_{L}$
,
 $f_{H}$
(a typical frequency of regime H,
 $f_{H}=0.075$
) and
 $f_{nat}$
. Two distinct branches appear as functions of the reduced velocity: a low-frequency branch and a high-frequency branch; these branches are referred to as VH1 and VH2 (vibratory, high shear,
 $1$
and
 $2$
). At low reduced velocities (branch VH1), the influence of
 $\unicode[STIX]{x1D6FD}$
on the response frequency is small. In contrast, the value of the shear parameter is found to have a significant effect on
 $f_{y}$
close to the transition between branches VH1 and VH2 and in branch VH2.
The regimes occurring in the large-amplitude vibration region are named after the three branches identified above, i.e. VL, VH1 and VH2. The regions of the parameter space associated with these regimes are indicated in figure 10(a), which represents iso-contours of
 $f_{y}^{\ast }$
. As previously noted (figure 9), each regime exhibits a distinct trend of the oscillation frequency: in regime VL,
 $f_{y}^{\ast }$
increases as a function of
 $U^{\ast }$
; in regime VH1,
 $f_{y}^{\ast }$
remains close to constant; in regime VH2,
 $f_{y}^{\ast }$
is larger than in the other regimes, and increases (respectively decreases) as a function of
 $U^{\ast }$
(respectively
 $\unicode[STIX]{x1D6FD}$
). Regimes VL, VH1 and VH2 are characterized by specific properties of the structural responses and fluid forces. To illustrate this aspect, iso-contours of the maximum response amplitudes and r.m.s. values of the fluid force coefficient fluctuations are represented in the
 $(\unicode[STIX]{x1D6FD},U^{\ast })$
parameter space in figure 10(b–e).
In regime VL, the body cross-flow response and the fluid forces are almost unaltered compared to the uniform current case, relative to the large variations observed at higher shear rates; the in-line oscillation is however substantially amplified.
In both directions, body responses and fluid forces are significantly amplified during the VL–VH1 transition. The peak amplitudes of the body responses and fluid forces are encountered in regime VH1. The structural response amplitudes rapidly decrease during the VH1–VH2 transition. However, the responses are still significant in regime VH2 since the cross-flow oscillation amplitude remains larger than
 $0.3$
diameters. In regime VH2, the force fluctuations are small in comparison with regimes VL and VH1. Their amplitudes, close to constant, are comparable to and even lower than in the fixed body case, in spite of the vibrations.
The time-averaged in-line force (not plotted here) is generally amplified within the region of large-amplitude vibrations. This explains why the actual time-averaged in-line displacement is usually larger than the estimate based on
 $\overline{C_{x}}$
in the fixed body case (figure 7
a). The amplification of
 $\overline{C_{x}}$
is particularly pronounced in regime VH1 where it can reach three times the fixed body case value.
The regimes associated with large-amplitude responses of the body are further investigated hereafter.
4.2.1 Low shear: regime VL
The low-shear part (
 $\unicode[STIX]{x1D6FD}<0.2$
) of the large-amplitude vibration area is characterized by regime VL (figure 10). The maximum amplitudes of the cylinder oscillations in this region are plotted as functions of the reduced velocity, for selected values of
 $\unicode[STIX]{x1D6FD}$
, in figure 11. As previously mentioned, the influence of the shear on the response amplitudes differs in each direction: the cross-flow response is hardly impacted, while the in-line response amplitude significantly increases as a function of
 $\unicode[STIX]{x1D6FD}$
. For
 $\unicode[STIX]{x1D6FD}>0$
, the peak amplitudes are observed at the same reduced velocity in both directions (
 $U^{\ast }=5$
). The response amplitude exhibits a typical bell-shaped evolution as a function of
 $U^{\ast }$
in the cross-flow direction; a much sharper evolution can be noted in the in-line direction.
Body oscillation amplitudes in the low-shear region: maximum (a) in-line and (b) cross-flow response amplitudes as functions
 $U^{\ast }$
, for selected values of
 $\unicode[STIX]{x1D6FD}$
. Regimes L and VL are indicated in the plots. Body trajectories observed close to the peak amplitude responses are plotted in (a) (not at scale).

Additional simulation results obtained in the case where the cylinder is restrained to move in the in-line direction suggest that the above mentioned enhancement of the in-line response for
 $\unicode[STIX]{x1D6FD}>0$
is closely connected to the existence of cross-flow displacement of the body. When the cylinder oscillates in the cross-flow direction in sheared current, it is exposed to a continuous variation of the oncoming flow velocity, which may contribute to the alteration of the in-line response, compared to the uniform-flow case.
The cylinder displacements are generally periodic in this region of the parameter space; the cross-flow responses are close to sinusoidal (frequency
 $f_{y}$
) and the in-line responses may involve two harmonic components,
 $2f_{y}$
and
 $f_{y}$
. The trajectories of the cylinder in the peak amplitude region are shown in figure 11(a). In uniform flow (
 $\unicode[STIX]{x1D6FD}=0$
), the in-line oscillation occurs at twice the cross-flow response frequency (
 $2f_{y}$
) and the body exhibits a figure-eight trajectory, with clockwise motion in the lower loop and counter-clockwise motion in the upper loop. As
 $\unicode[STIX]{x1D6FD}$
increases, the upper loop of the orbit tends to disappear, resulting in a clockwise, raindrop-shaped trajectory for
 $\unicode[STIX]{x1D6FD}=0.05$
. For
 $\unicode[STIX]{x1D6FD}=0.1$
, the body exhibits a clockwise ellipsoidal trajectory. The transition from figure-eight to ellipsoidal orbits as the shear is increased is related to the emergence and amplification of a spectral component at the cross-flow response frequency (
 $f_{y}$
), in the spectrum of
 $\unicode[STIX]{x1D701}_{x}$
, i.e. a switch from
 $2$
to
 $1$
in the ratio of the in-line and cross-flow response dominant frequencies. This phenomenon was also reported in previous works under comparable symmetry breaking (e.g. Tu et al.
Reference Tu, Zhou, Bao, Fang, Zhang, Li and Han2014). The ellipsoidal trajectories would be counter-clockwise for
 $\unicode[STIX]{x1D6FD}<0$
.
Some aspects of regime VL are illustrated in figure 12, for
 $(\unicode[STIX]{x1D6FD},U^{\ast })=(0.1,6)$
. Selected time series of the body displacements and spanwise vorticity in the wake, at
 $(x,y)=(10,0)$
, are presented in figure 12(a). The vorticity signal appears to be synchronized with body motion, which is, as mentioned above, mainly sinusoidal in the cross-flow direction and composed of two harmonics in the in-line direction. This is confirmed in figure 12(b,c) which represents the frequency spectra of the cross-flow displacement and spanwise vorticity: the peak frequency of
 $\unicode[STIX]{x1D714}_{z}$
coincides with the dominant frequency of
 $\unicode[STIX]{x1D701}_{y}$
(
 $f_{y}$
, indicated by a vertical dashed line in the plot). The condition of lock-in is thus established. The flow pattern downstream of the vibrating cylinder is visualized in figure 12(d). The wake is characterized by a vortex street whose antisymmetrical pattern is slightly perturbed by the shear, a perturbation comparable to that observed in regime L (figure 5
b). The saddle point, located at
 $y_{s}\approx -10$
, remains far from the body wake and does not significantly oscillate.
Analysis of regime VL,
 $(\unicode[STIX]{x1D6FD},U^{\ast })=(0.1,6)$
: (a) selected time series of the body displacements and spanwise vorticity at
 $(x,y)=(10,0)$
; spectra of the (b) cross-flow displacement and (c) spanwise vorticity; (d) instantaneous streamlines and iso-contours of the spanwise vorticity (
 $\unicode[STIX]{x1D714}_{z}\in [-\unicode[STIX]{x1D6FD}-1,-\unicode[STIX]{x1D6FD}+1]$
) in the vicinity of the body at selected instants (indicated by vertical dashed lines in (a)). In (c), a vertical dashed line denotes the dominant frequency of the cross-flow displacement. In (d), the black triangle in the snapshots indicates the monitor point where the vorticity is sampled.

A systematic analysis shows that the above observations, concerning the response frequency content, the lock-in condition and the global shape of the wake pattern, can be extended to the entire region of the (
 $\unicode[STIX]{x1D6FD}$
,
 $U^{\ast }$
) parameter space where regime VL is found to occur.
4.2.2 High shear: regimes VH1 and VH2
Two regimes of the flow–structure system are encountered in the high-shear part (
 $\unicode[STIX]{x1D6FD}\geqslant 0.2$
) of the large-amplitude vibration region: a low-frequency ratio regime in the lower range of
 $U^{\ast }$
, VH1, and a high-frequency ratio regime in the higher range of
 $U^{\ast }$
, VH2 (figure 10). The maximum amplitudes of the cylinder oscillations in this part of the parameter space are plotted as functions of the reduced velocity in figure 13. Regimes VH1 and VH2 are indicated in this figure. The largest amplitudes of vibration, as previously noted,
 $2$
and
 $1.3$
diameters in the in-line and cross-flow directions, are observed under regime VH1, close to the transition region with regime VH2, where the amplitudes are found to rapidly decrease. The
 $U^{\ast }$
range associated with regime VH1 tends to widen as a function of
 $\unicode[STIX]{x1D6FD}$
, as also illustrated in figure 10.
Body oscillation amplitudes in the high-shear region: maximum (a) in-line and (b) cross-flow response amplitudes as functions
 $U^{\ast }$
, for selected values of
 $\unicode[STIX]{x1D6FD}$
. Regimes L, H, S, VH1 and VH2 are indicated in the plots. Body trajectories observed for
 $\unicode[STIX]{x1D6FD}=0.3$
and
 $U^{\ast }\in \{6,9,12\}$
are plotted in (a) (not at scale).

The cylinder trajectories for
 $\unicode[STIX]{x1D6FD}=0.3$
and
 $U^{\ast }\in \{6,9,12\}$
are represented in figure 13(a). The dominant frequencies of the responses are generally the same in the in-line and cross-flow directions and the body exhibits clockwise ellipsoidal orbits. The periodicity of the trajectories varies from one point to the other. For
 $U^{\ast }=6$
(regime VH1), the in-line and cross-flow responses are periodic and essentially sinusoidal; the resulting orbit is periodic. For
 $U^{\ast }=12$
(regime VH2), the responses are also periodic but contain subharmonic components of non-negligible magnitudes, in particular at
 $f_{x}/4$
and
 $f_{y}/4$
(
 $f_{x}$
and
 $f_{y}$
are the dominant frequencies); the resulting trajectory is periodic but its period spans over four loops of body motion. A selected loop is represented in black in figure 13(a), while the other loops appear in grey. For
 $U^{\ast }=9$
, close to the transition between regimes VH1 and VH2, the cylinder responses and the associated orbit are found to be aperiodic. A typical loop of the trajectory is plotted in black. Aperiodic oscillations appear to be a generic feature of the VH1–VH2 transition. The region of the parameter space where such irregular responses are encountered is indicated by a striped area in figure 10. The behaviour of the flow–structure system in this region is more specifically analysed in § 4.2.3.
Same as figure 12 for regime VH1,
 $(\unicode[STIX]{x1D6FD},U^{\ast })=(0.3,6)$
. In (d), the three positive vortices trapped in the saddle point region are labelled (snapshot 3).

Additional properties of regime VH1 are examined in figure 14, for
 $(\unicode[STIX]{x1D6FD},U^{\ast })=(0.3,6)$
. As for regime VL in figure 12, selected time series of the body displacements and spanwise vorticity, are presented in figure 14(a). Contrary to the in-line and cross-flow oscillations of the cylinder which are mainly sinusoidal (
 $\unicode[STIX]{x1D701}_{y}$
spectrum is plotted in figure 14
b), the vorticity signal, still periodic, exhibits higher harmonic contributions, as shown in the spectrum in figure 14(c). The dominant frequency of
 $\unicode[STIX]{x1D714}_{z}$
coincides with the body motion frequency: the present vibrations also develop under the lock-in condition. The flow structure is depicted at four selected instants in figure 14(d). As expected from the results obtained at high shear in the fixed cylinder case (figure 6
b), the saddle point is close to the body. The wake pattern is greatly altered by the shear in comparison with regime VL; it resembles the patterns previously described in regime H (figure 5
c). In particular, the positive (orange) vortices are trapped in the saddle point region until they completely dissipate. Up to three positive vortices are found to coexist close to the saddle point. This phenomenon is illustrated in snapshot 3 of figure 14(d), where the positive vortices are labelled in their order of appearance. The negative (blue) vortices are convected downstream; their shedding period matches the dominant frequency of
 $\unicode[STIX]{x1D714}_{z}$
and the body response frequency. As in regime H, the position of the saddle point is found to oscillate; its oscillation is synchronized with vortex shedding (and body motion through lock-in).
Same as figure 12 for regime VH2,
 $(\unicode[STIX]{x1D6FD},U^{\ast })=(0.3,12)$
.

A typical case of regime VH2,
 $(\unicode[STIX]{x1D6FD},U^{\ast })=(0.3,12)$
, is considered in figure 15. Selected time series of the body displacements and spanwise vorticity, are presented in figure 15(a). As mentioned in the description of the cylinder trajectory (figure 13
a), the structural oscillations are periodic but not sinusoidal. This is illustrated by the spectrum of the cross-flow displacement, plotted in figure 15(b). In this spectrum, the fundamental frequency is equal to
 $f_{y}/4$
, where
 $f_{y}$
is the dominant frequency. Similar features are noted in the spectrum of
 $\unicode[STIX]{x1D701}_{x}$
. In figure 15(a), the time series are plotted over a time interval equal to the period of the response spectra, i.e.
 $4/f_{x}=4/f_{y}$
. As also observed in regimes VL and VH1, the vorticity signal is periodic and synchronized with body motion; it contains different harmonic contributions but its dominant frequency is equal to the dominant vibration frequency (figure 15
c). The lock-in condition is established and the wake structure (figure 15
d) appears to be globally comparable to that previously described in regime VH1, including the well-defined shedding of the negative vortices, at frequency
 $f_{y}$
, and the synchronized oscillation of the saddle point position. Some minor differences in the vortex dynamics can be noted between both regimes. The coexistence of several positive vortices in the saddle point region is less clearly defined in the present case. In addition, the emergence of subharmonic components of the dominant frequency implies that two successive oscillation/shedding cycles (of period
 $1/f_{y}$
) are not strictly identical; no significant alteration of the wake pattern is however noted from one cycle to the other.
The properties reported in the above selected cases highlight persistent features of regimes VH1 and VH2, which are generally observed in the corresponding regions of the (
 $\unicode[STIX]{x1D6FD}$
,
 $U^{\ast }$
) parameter space. These regimes, which also develop under the lock-in condition, are accompanied by a profound reorganization of the flow, compared with regime VL. Even if the wake patterns encountered in regimes VH1 and VH2 are comparable, the associated structural responses substantially differ, both by their magnitudes and their spectral contents: the responses exhibit larger amplitudes and are mainly sinusoidal in regime VH1 while they often involve multiple harmonic contributions, including significant subharmonics, in regime VH2. In the following, focus is placed on the transition region between these two regimes.
4.2.3 Transition between regimes VH1 and VH2
The cylinder trajectories plotted in figure 13(a) show that the responses, which are generally periodic in regimes VH1 and VH2, may become irregular in the transition region between these two regimes. To illustrate the periodicity of the responses, the phase portraits (velocity versus displacement) and Poincaré maps of the cross-flow response are plotted in figure 16, for
 $\unicode[STIX]{x1D6FD}=0.3$
and
 $U^{\ast }\in \{6,9,12\}$
, i.e. one typical case of each regime and a case located in the transition region. Time series of more than
 $50$
oscillation cycles are considered and the Poincaré maps are obtained by selecting the instants of the time series where
 $\ddot{\unicode[STIX]{x1D701}_{y}}=0$
and
 $\dot{\unicode[STIX]{x1D701}_{y}}>0$
(red dots in the phase portraits). For
 $U^{\ast }=6$
and
 $U^{\ast }=12$
(figure 16
a,b), the phase portraits are periodic; one and four points appear in the Poincaré maps, respectively, as expected since the response is essentially sinusoidal in the former case and periodic with some
 $f_{y}/4$
component contribution in the latter case. A distinct behaviour is noted for
 $U^{\ast }=9$
(figure 16
c): the phase portrait is aperiodic and a cloud of points appears in the Poincaré map. As previously mentioned, such aperiodic responses, also observed in the in-line direction, are common in the VH1–VH2 transition region (striped area in figure 10). They have not been observed in the other transition regions.
Periodicity of the cross-flow displacement in the high-shear region: phase portrait (upper row) and Poincaré map (lower row) of
 $\unicode[STIX]{x1D701}_{y}$
for
 $\unicode[STIX]{x1D6FD}=0.3$
and (a)
 $U^{\ast }=6$
(regime VH1), (b)
 $U^{\ast }=12$
(regime VH2) and (c)
 $U^{\ast }=9$
(transition region). In each phase portrait, red dots indicate the points plotted in the Poincaré map.

In order to shed some light on the nature of the aperiodic oscillations, a time–frequency analysis of the cross-flow displacement is presented in figure 17, for
 $(\unicode[STIX]{x1D6FD},U^{\ast })=(0.3,9)$
. A selected time series of
 $\unicode[STIX]{x1D701}_{y}$
and the corresponding spectrogram, based on short-time Fourier transform, are plotted in figure 17(a,b). For comparison with the results reported in figure 9, the frequency is expressed in terms of frequency ratio (
 $f^{\ast }$
), i.e. normalized by the oscillator natural frequency
 $f_{nat}$
. Substantial amplitude and frequency modulations can be noted in the displacement signal. A first overview suggests that the large oscillation amplitudes are associated with low frequency ratios while the lower oscillation amplitudes are connected to higher frequency ratios.
Time–frequency analysis of the cross-flow displacement in the VH1–VH2 transition region,
 $(\unicode[STIX]{x1D6FD},U^{\ast })=(0.3,9)$
: (a) selected time series of
 $\unicode[STIX]{x1D701}_{y}$
, (b) spectrogram and (c) histogram of the instantaneous frequency ratio (
 $f_{y}^{i\ast }$
) and amplitude (
 $\unicode[STIX]{x1D701}_{y}^{i}$
). In (a), a red dashed line indicates the instantaneous amplitude of the displacement signal. The spectrogram and histogram are normalized by the magnitude of the largest peak. In the spectrogram, a vertical dashed line indicates the beginning of the time interval considered in figure 18. In the histogram, symbols indicate the values of
 $(\unicode[STIX]{x1D701}_{y}^{m},f_{y}^{\ast })$
obtained for
 $\unicode[STIX]{x1D6FD}=0.3$
and all
 $U^{\ast }$
and the case under study,
 $U^{\ast }=9$
, is denoted by a white symbol; a dashed line delimitates the regions associated with regimes VH1 and VH2.

The instantaneous amplitude
 $\unicode[STIX]{x1D701}_{y}^{i}$
(red dashed line in figure 17
a) and instantaneous frequency ratio
 $f_{y}^{i\ast }$
of the response are defined as the spectral amplitude and frequency ratio of the dominant peak of the spectrogram. Iso-contours of the histogram of
 $\unicode[STIX]{x1D701}_{y}^{i}$
and
 $f_{y}^{i\ast }$
are plotted in figure 17(c); for
 $\unicode[STIX]{x1D6FD}=0.3$
and each value of
 $U^{\ast }$
, the maximum amplitude
 $\unicode[STIX]{x1D701}_{y}^{m}$
and dominant frequency ratio
 $f_{y}^{\ast }$
are also reported (symbols) and the case under study,
 $U^{\ast }=9$
, is denoted by a white symbol. The histogram confirms the above observation: a dominant peak emerges in the region associated with regime VH1, i.e. high amplitudes and low frequency ratios, and a second peak of lower magnitude can be identified in the region associated with regime VH2, which is characterized by lower amplitudes and higher frequency ratios. The dominant peak of the histogram deviates from the values of
 $\unicode[STIX]{x1D701}_{y}^{m}$
and
 $f_{y}^{\ast }$
obtained for
 $(\unicode[STIX]{x1D6FD},U^{\ast })=(0.3,9)$
(white symbol). Such deviation is expected due to the irregular behaviour of the system; in addition, the short-time Fourier transform tends to filter the amplitude modulations occurring over the sampling window, viz. the peak amplitudes are not well captured by this approach (figure 17
a). The existence of two peaks in the histogram indicates that the system exhibits an intermittent behaviour and switches from one state to the other. The two peaks appear to be connected in the histogram, which suggests that the transitions between the two states are relatively smooth; the time series plotted in figure 17(a) corroborates this observation.
The occurrence of intermittent responses in the transition region between regimes VH1 and VH2 raises the question of the persistence of the lock-in condition in this context: this phenomenon could be related to successive interruptions in wake–body synchronization (i.e. intermittent lock-in) or instead, to a global, intermittent behaviour of the flow–structure system, occurring under lock-in. Wake–body synchronization in the intermittent case is briefly addressed in figure 18, which represents, for
 $(\unicode[STIX]{x1D6FD},U^{\ast })=(0.3,9)$
, the instantaneous frequency ratio of the cross-flow displacement (
 $f_{y}^{i\ast }$
), as well as the instantaneous frequency ratio of the spanwise vorticity at
 $(x,y)=(10,0)$
(
 $f_{\unicode[STIX]{x1D714}}^{i\ast }$
), over a selected time interval indicated in figure 17(b). The instantaneous frequency ratio of
 $\unicode[STIX]{x1D714}_{z}$
is computed using short-time Fourier transform, similarly to
 $f_{y}^{i\ast }$
. It appears that
 $f_{y}^{i\ast }$
and
 $f_{\unicode[STIX]{x1D714}}^{i\ast }$
exhibit comparable evolutions, with a time lag
 $\unicode[STIX]{x1D70F}$
approximately equal to
 $10$
time units. This observation suggests that there is no interruption of the lock-in condition; body oscillation and wake unsteadiness remain synchronized, even in the case of intermittent responses.
Wake–body synchronization in the VH1–VH2 transition region,
 $(\unicode[STIX]{x1D6FD},U^{\ast })=(0.3,9)$
: selected time series of the instantaneous frequency ratios of the cross-flow displacement (
 $f_{y}^{i\ast }$
) and spanwise vorticity at
 $(x,y)=(10,0)$
(
 $f_{\unicode[STIX]{x1D714}}^{i\ast }$
).

5 Conclusion
The system composed of a circular cylinder, either fixed or elastically mounted, and placed in linear planar shear flow, has been investigated on the basis of numerical simulations. Wide ranges of values of the shear parameter (
 $\unicode[STIX]{x1D6FD}\in [0,0.4]$
) and reduced velocity (
 $U^{\ast }\in [2,14]$
) were considered, at Reynolds number
 $100$
.
The elastically mounted cylinder exhibits free vibrations in the in-line and cross-flow directions. Large-amplitude structural oscillations develop over a region of the (
 $\unicode[STIX]{x1D6FD}$
,
 $U^{\ast }$
) parameter space that encompasses the entire range of
 $\unicode[STIX]{x1D6FD}$
under study, and a range of
 $U^{\ast }$
that widens as
 $\unicode[STIX]{x1D6FD}$
increases. The principal features of the system, outside and within the large-amplitude vibration region, are summarized hereafter.
Outside the large-amplitude vibration region, the system exhibits three successive regimes as a function of
 $\unicode[STIX]{x1D6FD}$
. Regarding the flow behaviour and fluid forcing properties, these regimes are similar to the three regimes identified in the fixed body case.
For
 $\unicode[STIX]{x1D6FD}\in [0,0.2]$
, in regime L, the flow dynamics, including the vortex shedding frequency and the wake pattern, is comparable to that observed in uniform current. The most noticeable effects of the shear are the shift of the in-line/cross-flow force frequency ratio, from
 $2$
to
 $1$
, and the appearance of a negative time-averaged force in the cross-flow direction.
A second unsteady flow regime, referred to as regime H, occurs for
 $\unicode[STIX]{x1D6FD}\in [0.2,0.3]$
. It is characterized by a pronounced asymmetry of the wake structure with contrasted dynamics of the positive and negative vortices, and by a substantial decrease of the vortex shedding frequency. The saddle point, which appears close to the body, is found to oscillate and its motion is synchronized with flow unsteadiness; such oscillations are not observed in the other regimes. The shear has a major impact on the fluid forces in this regime; for example it induces a large reduction of the time-averaged in-line force.
For
 $\unicode[STIX]{x1D6FD}\in [0.3,0.4]$
, in regime S, the flow is steady and the wake exhibits a triangular pattern whose lower corner coincides with the saddle point.
Within the large-amplitude vibration region, three distinct regimes of the flow–structure system are uncovered. In all regimes, body motion and flow unsteadiness are synchronized, i.e. the lock-in condition is established.
In the low-shear part of the parameter space, for
 $\unicode[STIX]{x1D6FD}\in [0,0.2]$
, the first large-amplitude vibration regime encountered, referred to as regime VL, is characterized by a limited influence of the shear on the system behaviour. It develops over a relatively narrow range of
 $U^{\ast }$
which remains close to that reported in uniform current. The flow pattern, fluid force properties and cross-flow response are also comparable to that observed for
 $\unicode[STIX]{x1D6FD}=0$
. The main impact of the shear concerns the amplification of the in-line response and the transition from figure-eight to ellipsoidal orbits as
 $\unicode[STIX]{x1D6FD}$
is increased, i.e. shift from
 $2$
to
 $1$
of the in-line/cross-flow response frequency ratio.
The range of
 $U^{\ast }$
over which large-amplitude responses develop rapidly widens around
 $\unicode[STIX]{x1D6FD}=0.2$
and it reaches the maximum reduced velocity considered in this study (
 $U^{\ast }=14$
), for
 $\unicode[STIX]{x1D6FD}\geqslant 0.2$
. For
 $\unicode[STIX]{x1D6FD}\in [0.2,0.4]$
, two large-amplitude vibration regimes are identified: a low-frequency ratio regime in the lower range of
 $U^{\ast }$
, regime
 $VH1$
, and a high-frequency ratio regime in the higher range of
 $U^{\ast }$
, regime
 $VH2$
. Structural vibrations thus develop beyond
 $\unicode[STIX]{x1D6FD}=0.3$
, where a steady flow was observed in the fixed body case.
The wake patterns encountered in regimes
 $VH1$
and
 $VH2$
are comparable and resemble the asymmetric pattern associated with regime H. The saddle point position oscillates; it is synchronized with vortex shedding and body motion through lock-in. Even if the flow patterns observed in regimes VH1 and VH2 are comparable, the associated vibrations and forces clearly differ. The peak amplitudes of body responses and fluid forces appear in regime VH1. The response amplification is particularly pronounced in the in-line direction where the oscillations reach
 $2$
body diameters versus
 $0.03$
diameters in uniform flow. A maximum amplitude of
 $1.3$
diameters is noted in the cross-flow direction. The vibrations are periodic and mainly sinusoidal in this regime. In contrast, much lower amplitudes of vibration are observed in regime VH2 and the responses, still periodic, often involve several harmonic contributions, including significant subharmonics. The force fluctuations are small in comparison with regimes VL and VH1.
The responses of the system are generally periodic, except in the transition region between regimes VH1 and VH2, where aperiodic, intermittent oscillations are found to occur; even in this case, body motion and wake unsteadiness appear to remain synchronized.
Acknowledgement
This work was performed using HPC resources from GENCI (grants x20152a7184, c20162a7184).
Appendix A. Comments on the effect of blockage in the fixed body case
The effect of the cross-flow size of the computational domain
 $L_{y}$
in the fixed body case is illustrated in table 2, for
 $\unicode[STIX]{x1D6FD}=0.1$
. The Strouhal frequency (
 $St$
) and time-averaged force coefficients are reported for a range of
 $L_{y}$
and two types of external boundary conditions. The first type (BC1) corresponds to the boundary conditions employed in this study, i.e. far-field conditions based on the Riemann invariants. The second type (BC2) consists of far-field conditions on the lateral boundaries of the domain (
 $x_{c}=\pm L_{x}/2$
) and slip wall conditions on the upper and lower boundaries (
 $y_{c}=\pm L_{y}/2$
); this second type of conditions is considered for comparison with previous works, as discussed in the following. The other numerical parameters are the same as the reference parameters described in § 2.2 (case 2 in table 1). It appears that the blockage significantly impacts the results, but convergence with respect to
 $L_{y}$
is noted for
 $L_{y}>40$
. It is also observed that the choice of external boundary conditions (BC1 versus BC2) does not influence the results for
 $L_{y}>20$
. This confirms that the size of the flow domain selected in this study (
 $L_{y}=40$
) is large enough to avoid any blockage effect.
Numerical results obtained by Lei et al. (Reference Lei, Cheng and Kavanagh2000) and Kang (Reference Kang2006) under large blockage and conditions enforcing no cross-flow velocity on the upper and lower boundaries (i.e. comparable to conditions BC2), at the same Reynolds number (
 $Re=100$
), are also reported in the table; they are close to the present results obtained with conditions BC2.
Influence of the cross-flow blockage on the Strouhal frequency and time-averaged fluid force coefficients, in the fixed body case, for
 $\unicode[STIX]{x1D6FD}=0.1$
.

Appendix B. Validation in the uniform flow case
A comparison between the present results and prior experimental and numerical works, in the case of a fixed cylinder immersed in uniform flow, is reported in table 3. The comparison is based on three physical quantities: the Strouhal frequency, the time-averaged in-line force coefficient, and the maximum cross-flow force coefficient. In this appendix, for comparison with previous works, the maximum value (denoted by the subscript
 $_{max}$
) designates the peak value and thus differs from the definition employed in the rest of the paper (i.e. average of the highest
 $10\,\%$
of fluctuation amplitudes). The present results are close to those reported in prior studies.
Table 4 focuses on the vortex-induced vibrations of a cylinder immersed in uniform flow and restrained to move in the cross-flow direction. The oscillation frequency, maximum cross-flow displacement, time-averaged in-line force coefficient and maximum cross-flow force coefficient issued from the present simulation are compared to prior numerical results. The present results show a good agreement with previous works.
To summarize, the results reported in tables 3 and 4 confirm the reliability of the present simulation approach.
Flow past a fixed circular cylinder immersed in uniform flow at
 $Re~=100$
: Strouhal number, time-averaged in-line force coefficient and maximum cross-flow force coefficient, issued from the present simulation and from prior experimental (exp.) and numerical (num.) works.

Vortex-induced vibrations of a circular cylinder immersed in uniform flow and restrained to move in the cross-flow direction at
 $Re~=100$
, for
 $m=1.25$
,
 $\unicode[STIX]{x1D709}_{y}=0$
and
 $U^{\ast }=4.46$
: oscillation frequency, maximum cross-flow displacement, time-averaged in-line force coefficient and maximum cross-flow force coefficient, issued from the present simulation and prior numerical works.



