Nomenclature
- AOA
-
angle-of-attack (deg)
- CFD
-
computational fluid dynamics
- d
-
bleed hole diameter (in mm)
- DES
-
Detached Eddy Simulation
- D
-
calibre diameter (in mm)
- ESDU
-
engineering sciences data unit
- F
-
lateral surface (m2)
- H
-
height for section (m)
- IWTB
-
Inward Turning Base Bleed
- GCI
-
grid convergence index
- L
-
distance between bleed hole exit and base wall (in mm)
- LES
-
large eddy simulation
- S
-
base surface area (in mm2)
- h/D
-
cavity depth ratio
- t/D
-
lip thickness ratio
- P
-
reference point considered at the end of the shell projectile (in m)
- Q
-
starting point of the recirculation zone (in m)
- R
-
end point of recirculation zone (in m)
- RANS
-
Reynolds averaged Navier Strokes equation
- r 1
-
reference area for section 1 (m)
- r 2
-
reference area for section 2 (m)
- s
-
maximum height of the recirculation zone (in m)
- O
-
midpoint of the recirculation zone (in m)
- u
-
instantaneous velocity (m/s)
- V
-
freestream velocity (in m/s)
- VSD
-
vortex suppression devices
-
 $\rho$
-
density (in kg/m3)
-
$\beta$
-
boattail angle (8°)
-
$\alpha$
-
bleed hole entry angle (in deg)
-
$\gamma$
-
bleed hole exit angle (in deg)
-
$\phi$
-
angle of orientation (in deg)
- C D
-
drag coefficient
- (C D)ForeBody
-
forebody drag coefficient
- (C D)b
-
base drag coefficient
- (C p)b
-
base pressure coefficient
- (C D)0
-
zero-lift drag coefficient
- (C D)BT
-
boattail drag coefficient
- D b
-
base drag (in N)
- D B
-
base diameter (in calibre ‘D’)
- D M
-
Meplet diameter (in calibre ‘D’)
- D
-
diameter of the shell projectile
- p b
-
base pressure (in N)
- p ∞
-
freestream pressure (in N)
- P Gas
-
gas pressure
- q j
-
heat flux
-
$\tau$
ij
-
viscous stress tensor.
-
$\mu$
T
-
eddy viscosity


1.0 Introduction
Based on the available literature, different techniques were offered to reduce base drag, namely: blowing, suction, base cavities, ventilated cavities, vortex generators, after-body modification, splitter plates, boattailing, injecting additives/droplets or fibres and large eddy breakup devices. These techniques are used to modify the flow around the body, prevent separation, reduce wake and initiate a mass transfer into the boundary layer. In this paper, base-drag reduction in shell projectile is studied using passive method of base modification. This study include: (1) basic model, (2) cavity model without bleed and (3) cavity with IWTB, at various freestream Mach numbers (0.7, 0.9, 1.0, 1.5 and 2) and at 0° angle-of-attack. Such investigation has not been found in the published literatures.
Base drag is an important part of the total drag and accounts for approximately 40% of the total drag. Yash et al. [Reference Gujarathi and Joshi1], studied active (requires energy and involves a control system) and passive flow control techniques (geometry variation without any energy expenditure) and concluded that active flow control technology has advantages over passive control, but passive control is easy to implement and practical to used. Active method consists of predetermined methods and interactive methods. Predetermined methods include jet vectoring using different types of actuators, form-drag reduction using oscillatory blowing, and an interactive method can be a feed forward (open) or feedback (closed). In case of feed forward, a sensor is placed upstream of the actuator.
Passive method consists of the following: 1. retrofits such as flaps/deflectors, laps/deflectors and boattail; 2. control surfaces such as riblets, streaks, dimples, tabs, porous and lavers; 3. modifications such as vents, domes and backward steps. Tripathi et al. [Reference Tripathi, Manisankar and Verma2] did an experimental study to assess the effectiveness of base geometry modifications in controlling the mean and unsteady base pressure development on a circular-arc 12° boattailed afterbody at zero angle of incidence under jet-off and jet-on conditions. Tests were carried out for the freestream Mach number range of 0.6 to 1.06 with nozzle pressure ratios for jet-on conditions varying from 1 to 12. Three base geometry configurations @md sharp base (or baseline case), rounded base and base cavity @md were focused.
Dijana, et al. [Reference Damljanović and Isaković3] studied the overall accuracy and repeatability of measurements in the trisonic blowdown wind tunnel in VTI. Test conducted during this study gave the overall reliability of the T-38 Military Technical Institute’s trisonic wind tunnel. Wind-tunnel data uncertainty was considered in the form of repeatability of a few presumably identical tests of a standard model. Test data were also correlated with those from other wind-tunnel facilities. Hongkang et al. [Reference Liu, Yan, Zhao and Qin4] studied uncertainty and sensitivity analysis of flow parameters on aerodynamics of a hypersonic inlet, based on five flow parameters that consists of freestream Mach number, Reynolds number, angle-of-attack, temperature and wall temperature.
Jiajan et al. [Reference Jiajan, Chue, Nguyen and Yu5] considered two models, one with standard 155mm diameter round projectile, and the other is an optimised configuration i.e. a long range M549 155mm spin-stabilised projectile. Using CFD software, Jiajan studied optimisation procedure by varying optimum round model and benchmark configuration (standard 155mm M549 projectile). 155mm M549 model was varied with cylindrical body lengths 0·4D, 0·8D, and 1·5D to reduce aerodynamic drag at 0° angle-of-attack and supersonic speeds (Mach 1.5 to 4), which in return improves static and dynamic stabilities. The optimised configuration gave up to 15% drag reduction, when compared with another executed model.
Mirzaei et al. [Reference Mirzaei, Karimi and Vaziri6] studied the air flow pattern around the aft body and the drag reduction mechanisms have been investigated for a designing the aft body configuration. Morel [Reference Morel7] conducted experiments to study different types of base cavities including: solid walled and ventilated cavities, each with six different depths ranging from 0.1D to 0.9D. Based on these experiments, it was concluded that maximum drag coefficient reduction observed was for a ventilated (slotted) cavity with a depth of 0.2D.
Nicolás et al. [Reference Nicolás-Pérez, Velasco, García-Cascales, Otón-Martínez, López-Belchí, Moratilla, Ray and Laso8] studied accuracy of RANS, DES and LES turbulence models for predicting drag reduction with base-bleed technology under transonic and supersonic models (Mach number 0.99–1.5). Results claimed that RANS and DES models had a limited accuracy in drag prediction when facing a problem involving a high-temperature jet-mixing layer with a transonic wake as in the case of active base bleed. Platou [Reference Platou9] studied the effect of boattail (whether have equal or lower drag) and an improved gyroscopic stability in a projectile, by varying the shapes such as conical or cylindrical, square, triangular and cruciform. According to the study the square boattail has the same drag reduction as the conical boattail. The cruciform boattail drag was high, and the twisted triangular boattail had the best aerodynamic properties for projectiles along with lower drag, good pitching moments, and low Magnus moments (for good stability).
Regodić et al. [Reference Gujarathi and Joshi10], studied axial aerodynamic coefficient reduction using base-bleed method. Based on this study the axial aerodynamic was reduced up to 30%. Slobodan et al. [Reference Jamaz and Amin Dali11] studied optimisation of artillery projectiles base drag reduction using hot base flow. The study was based on different base-bleed grain types with different combustion temperatures. The total drag for optimum design model got reduced by 6.9% in the case of air injection at a temperature of 300K and reached up to 28% in the case of propellant combustion products injection at almost 2500K. Tanner [Reference Tanner12] studied a few base-drag reduction methods that include splitter plates, both thin and thick, splitter wedges, base bleed, boattailing and various types of serrated trailing edges. For base-bleed method, more reduction in base drag was observed. The study included various gases (for bleed method); hence the result was influenced by the injectant used, gases of low molecular weight being more effective than those with a high molecular weight.
Tarun et al. [Reference Mathur and Craig Button13] studied the effect of base bleed on the near-wake flow field of a cylindrical afterbody in a Mach 2.5 flow with a unit Reynolds number of 45 × 106 m−1. With increasing bleed-flow rate, the average base pressure is found to increase initially, attain a peak value near an injection parameter of I = 0.0148 and then decreasing with further increase in I. The optimum bleed condition near I = 0.0148 is also characterised by a weak corner expansion, a minimum value of the free-shear-layer angle, and the near-disappearance of the recirculation region (reverse velocity) along the centreline of the near wake. Van et al. [Reference Van Dam, Nikfetrat, Wong and Vijgen14] studied drag prediction at subsonic and transonic speeds using the Euler method.
Viswanath [Reference Viswanath15–Reference Viswanath18] carried out the experiments for reducing base and total drag at transonic speeds by using passive method: 1) cavities, 2) ventilated cavities with different ventilation geometries, and 3) two vortex suppression devices, at transonic speed the optimum h/D is likely to occur beyond h/D = 0.4 and the optimum value for the lip thickness (t/D = 0.07 to 0.08). Compared to cavities with or without ventilation, the VSD model gave lower reduction at transonic speed. At Mach 2, ventilated cavities gave a promising drag reduction, with an increment of 50% base pressure (higher than the effects seen at transonic Mach numbers).
In this research, a typical shell projectile is considered with novel passive technique called IWTB. Both experimental and computational methods are carried out for the base-drag reduction study.
2.0 Model design
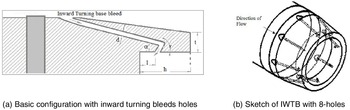
The model and all other augmented geometry are designed using SolidWorks. Initial design is based on 155mm M107HE shell projectile along with its nomenclature as shown in Fig. 1(a) and (b). Figure 2(a) and (b) show the basic configuration with Inward Turning Bleed Holes. Figure 2(a) shows that various IWTB parameters such as ‘α’ bleed hole entry angle, ‘γ’ bleed hole exit angle, ‘d’ bleed hole diameter, ‘l’ distance between bleed hole exit and base wall, ‘t’ lip thickness and ‘h’ depth thickness. The main objective of this study is to analyse the base-flow characteristics of gun-launched shells and employ the passive method of Inward Turning Base Bleed to reduce the base drag. In this method, a small quantity of air from the outer flow over the body surface is drawn through bleed holes and made to impinge on to the base wall. This impingement increases the pressure on the base, hence reducing the base drag.
Sketch of 155mm shell projectile.

Detailed basic configuration with IWTB.

Basic model is studied for parameters such as cavity, bleed-hole diameter and number of bleed hole as shown in Table 1. Variation of cavity depth ratio and lip thickness ratio are referred from Viswanath [Reference Viswanath and Patil17], where it is clearly shown that both base and total drag shows an initial decrease up to a value of h/D = 0.20 and then remain constant for larger values of h/D. A similar qualitative behaviour is seen with increase in lip thickness. Interestingly, the base-drag reduction, although is small and is practically realised as net-drag reduction, suggests negligible losses associated with base cavities. Optimum values of h/D and t/D, for maximum net-drag reduction, have values of about 0.20 and 0.04, respectively. Based on the Ref. (Reference Viswanath and Patil17), as well as available space at the base of the projectile, the following parameters are chosen and varied.
Geometric parameters for base configuration with inward turning bleed holes

2.1 Theoretical calculation
In this section, the coefficient of drag for basic shell configuration is estimated using ESDU data and semi-empirical models. Although it is simple, the present theoretical technique gives reliable drag estimations for the range of Mach numbers at 0° angle-of-attack. Based on Ref. [Reference McCoy19], theoretical estimation is carried out, followed by ESDU 77020, ESDU 78041, ESDU 79022.
Generally,
 \begin{align*}{C_{{\rm{D}}\,{\rm{Total}}}} & = {\rm{Skin}}\,{\rm{Frication}}\,{\rm{Drag}}\,{\rm{Coefficient}}\left( {{{\it{C}}_{{\rm{DSF}}}}} \right) + {\rm{Wave}}\,{\rm{Drag}}\,{\rm{Coefficient}}\left( {{{\it{C}}_{{\rm{D}}\,\,{\rm{W}}}}} \right) \\ & \quad + {\rm{Base}}\,{\rm{Drag}}\,{\rm{Coefficient}}\left( {{{\it{C}}_{{\rm{D }}\,\,{\rm{B}}}}} \right) \end{align*}
2.1.1 Skin frication drag coefficient estimation
The skin friction drag coefficient (C D)sf is calculated using the following formula.
 \begin{align} \left( {{C_D}_{SF}} \right) = {C_f} \times \frac{{{S_{wetted}}}}{{{S_{referenc}}}} \end{align}
The reference area of the shell projectile is 0.0189m2. For calculating the wetted surface area of the projectile, the model is divided into four sections. The Sections 1, 2 and 4 are considered as truncated cone, and the Section 3 is considered as cylinder respectively as shown in Fig. 3. The formula for a truncated cone lateral surface area is
 $F = \pi\!\left( {{r_{1{\rm{\;}}}} + {r_2}} \right)\sqrt {{{\left( {{r_{1{\rm{\;}}}} + {r_2}} \right)}^2} + {h^2}} $
and surface area is
 $F + \pi\!\left( {{r_{1{\rm{\;}}}} + {r_2}} \right)$
. Table 2 shows the surface area for all segmentation as per the design concerned.
Segmentation of shell projectile.

Surface area for each segmentation

The total wetted surface area is calculated from addition of four surface areas
 ${\rm{\;}}{S_{wetted}} = 0.264{{\rm{m}}^2}$
.
Estimated wetted surface area by using CAD software SolidWorks is
 ${S_{wetted}} = 0.2763{\rm{\;}}{{\rm{m}}^2}\;$
(surface wetted area is very near to the theoretical value).
 \begin{align} {C_f} = {\rm{\;}}{\left( {{C_f}_{turbulent}} \right)_c} + \frac{{{x_1}}}{c}{\left( {{C_f}_{laminar}} \right)_{x1}} - \frac{{{x_1}}}{c}{\left( {{C_f}_{turbulent}} \right)_{x1}} \end{align}
Consider flow (M = 0.7) over shell projectile with a boundary layer extending from the leading edge over the distance
 ${x_1}$
to the transition point and a turbulent boundary extending over the distance
 ${x_1}$
from the transition point to the trailing edge. The critical Reynolds number is 5 × 10⁵, Reynolds number based on projectile length is 1.1 × 10⁷, (where c = 0.701m (Length of projectile). This locates the transition point relative to the chord length. So, transition length from leading edge is
 ${x_1}$
= 0.03m and from trailing edge is
 ${x_2}$
= 0.671m. For laminar flow, with Reynolds number based on
 ${x_1}$
,
 \begin{align} {\left( {{C_f}_{laminar}} \right)_{x1}} = \frac{{1.328}}{{\sqrt {R{e_{x1}}} }}{\left( {1 + 0.12M_\infty ^2} \right)^{ - 0.12}} = 0.0018 \end{align}
For turbulent flow, with Reynolds number based on
 ${x_1}$
,
 \begin{align} {\left( {{C_f}_{turbulent}} \right)_{x1}} = \frac{{0.455}}{{{{\left( {lo{g_{10}}R{e_{x1}}} \right)}^{2.58}}}}{\left( {1 + 0.21M_\infty ^2} \right)^{ - 0.32}} = 0.0049 \end{align}
For turbulent flow, with Reynolds number based on chord C,
 \begin{align} {\left( {{C_f}_{turbulent}} \right)_c} = \frac{{0.455}}{{{{\left( {lo{g_{10}}R{e_{x1}}} \right)}^{2.58}}}}{\left( {1 + 0.21M_\infty ^2} \right)^{ - 0.32}} = 0.0028 \end{align}
At,
 ${M_\infty }$
= 0.7 skin friction coefficient
 ${C_f}$
is 0.0026; skin friction drag coefficient
 ${\left( {{C_D}} \right)_{SF}}$
is 0.0394, as shown in Table 3.
2.1.2 Wave drag coefficient estimation
The bluntness ratio
 $'b'$
is the ratio between diameter of spherical blunting
 $'d'\;$
to maximum diameter of body
 $'D'$
as given in the following Equation (Reference Mirzaei, Karimi and Vaziri6).
 \begin{align} {\rm{\;}}b = \frac{d}{{D{\rm{\;}}}}{\rm{\;}} = {\rm{\;}}0.087 \end{align}
Coefficient of skin friction drag at various Mach number

Coefficient of wave drag at various Mach number

Forebody fineness ratio is the ratio between lengths of forebody
 ${l_f}$
to maximum diameter of body
 $'D'$
.
 \begin{align} f = \frac{{{l_f}}}{{D{\rm{\;}}}}{\rm{\;}} = {\rm{\;}}2.44 \end{align}
ESDU data Ref [20] gives wave drag coefficient for the various bluntness ratio and fineness ratio. But plots are available only for forebody fineness ratio of = 2 & 3. Therefore, to get the
 ${C_{DW}}$
values for interpolation technique was used. The calculated values of wave drag coefficient (
 ${C_{DW}}$
) are presented in the following Table 4.
Plots are available only for forebody fineness ratio 2 and 3, so getting
 ${C_D}$
values for
 $f = 2\; \& \;f = 3$
then interpolation both values for getting
 $\,f = 2.44$
values.
2.1.3. Base-drag coefficient estimation
The base-drag coefficients are estimated as shown in Table 5, using diameter ratio
 $\left(\dfrac{{{D_B}}}{{{D_M}}}\right)$
and boattail angle (β) using the ESDU data. Diameter ratio is ratio between base diameters ‘DB’ to maximum diameter of body
 $'D'$
of the shell configuration. Boattail angle of M107 155mm shell projectile is β = 8o. The ESDU data provides the total after body pressure drag coefficient
 ${C_D}_a$
. For subsonic and supersonic regions provides
 ${C_D}_a$
directly by using diameter ratio
 $\left(\dfrac{{{D_B}}}{{{D_M}}}\right)$
and boattail angle (β). For transonic region
 ${C_D}_a$
is sum of base pressure drag coefficient
 ${C_D}_b$
and boattail pressure drag coefficient
 ${C_D}_\beta $
.
 \begin{align} {C_D}_a{\rm{\;}} = {\rm{\;}}{C_D}_b + {C_D}_\beta \end{align}
Coefficient of base drag at various Mach numbers

Table 6 shows the cumulative result for shell projectile’s drag calculation, in terms of skin friction drag, base drag, wave drag and the total drag.
Coefficient of total drag at various freestream Mach numbers

Computational domain.

2.2 CFD model
2.2.1 Domain selection
Domain simplification is an extremely normal methodology and whenever utilised wisely, gives precise and quicker outcomes. The domain wrapping the projectile guarantees to embody the arrangement of shocks at the forebody and shedding the vortex at the rear. Figure 4(a) shows the projectile domain as used in the simulation software. Frontal section till the band is termed as forebody, followed by the rotating band, bleed intake with IWTB hole, boattail and base cavity. Figure 4(b) shows axisymmetric model domain (for revolution bodies) with upstream, top and bottom boundary of 3D. The downstream domain is extended up to 7D. The axisymmetric model is used to study for freestream Mach number ranging from subsonic to sonic region. From the numerical simulation, the wake region is observed up to 1.25D and its effect is seen up to 2.5D for all subsonic and sonic simulations. Therefore, the downstream domain selected at 7D is far behind the wake region. The top and bottom domain at 3D is sufficient to capture all details of flow field, because the angle-of-attack is zero degrees for all numerical simulations; moreover the disturbance is not seen beyond 2D in top and bottom surfaces.
3D model domain shown in Fig. 4(c) is used for freestream Mach number 1.5 and 2, to obtain the wake region more prominently. The distance from the inflow to the leading edge of the round, the round base to the outerflow and body wall to the far field are 0·15D, 6D and 11D, respectively, based on Ref. (Reference Jiajan, Chue, Nguyen and Yu5). This domain selection is confirmed and justified based on the shock standoff distance calculation made as given in Refs (Reference Lobb21 and Reference Shankara and Sreekanth22).
The following equation as given in Ref. (Reference Jiajan, Chue, Nguyen and Yu5) predicts the shock standoff distance for a sphere of diameter D. Where the ratio of the freestream density
 ${\rho _\infty }$
to the after-normal-shock density
 ${\rho _2}$
on the central stagnation streamline is used in the following relation from Ref [Reference Saiprakash, Senthil Kumar, Kadam Sunil, Singh Prakash, Shanmugam and Balu23]:
 \begin{align} \frac{\delta }{D} = 1.41\frac{{{\rho _\infty }{\rm{\;}}}}{{{\rho _2}{\rm{\;\;}}}} \end{align}
 \begin{align} \frac{\delta }{D} = 1 - {\left[ {1 - \frac{4}{{{{\left( {\gamma + 1} \right)}^2}}}\!\left( {\frac{1}{{{M^2}}} + \frac{{\gamma - 1}}{2}} \right)} \right]^{1/2}} \end{align}
From the above equations, it is observed that the shock standoff distance for Mach 1.5 is 0.07D and for Mach 2.0 is 0.05D. It is well known that in supersonic stream the disturbance will not propagate in upstream. Hence the selected domain size of 0.15D is more than sufficient and justified. For downstream domain selection, the wake region is seen up to 2.D and the effect of wake is seen up to the region of 5 to 6D. Therefore, the downstream domain is fixed at 11D, which is far behind the wake region.
Table 7 shows the CFD models used for the simulation. Initially 2D axisymmetric models were used to get the faster solution and to optimise the configuration. After optimisation to confirm the results and to compare with the experiment result 3D models were used in the CFD simulation.
Configuration for CFD simulation

2.2.2 Meshing condition
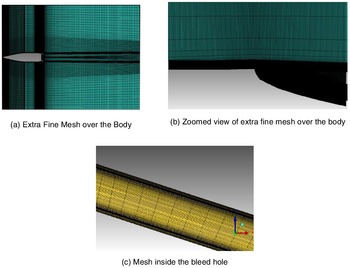
All models were created using SolidWorks, model meshing is carried out using ANSYS Workbench for axi-symmetric geometries and 3D model meshing is done using ICEM CFD. Figure 5 shows the unstructured extra-fine mesh created using ICEM CFD. Numerical simulation for all the above domain is carried out using ANSYS Fluent. Algebraic multi-grid (AMG) method for convergence of the implicit density-based solver, shear stress transport k-ω model was used. By keeping y+ value to 1, first layer thickness is found to be approx. 0.44nm for Mach number 2. Mesh quality for orthogonal quality is 0.269; and maximum aspect ratio is 36.1356. The governing equations are solved in the fluent software compressible fluid flow are as follows:
3D model mesh in ICEM CFD.

Continuity Equation:
 \begin{align} \frac{{\delta \rho }}{{\delta t}} + \frac{{\delta \!\left( {\rho {u_i}} \right)}}{{\delta {x_i}}} = 0 \end{align}
Momentum Equation:
 \begin{align} \frac{{\delta \!\left( {\rho {u_i}} \right)}}{{\delta t}} + \frac{{\delta \!\left( {\rho {u_i}{u_j}} \right)}}{{\delta {x_j}}} = - \frac{{\delta P}}{{\delta {x_i}}} + \frac{\delta }{{\delta {x_i}}}{\tau _{ij}} \end{align}
Energy Equation:
 \begin{align} \frac{\delta }{{\delta t}}\left[ {\rho \!\left( {e + \frac{{{V^2}}}{2}} \right)} \right] + \frac{\delta }{{\delta {x_i}}}\left[ {\rho {u_{j{\rm{\!}}}}\left( {e + \frac{{{V^2}}}{2}} \right) + P + {q_j} - {u_i}{\tau _{ij}}} \right] = 0 \end{align}
Note that
 $\;\;u\;$
denotes instantaneous velocity,
 $V\;-$
the velocity modulus
 $,\;\rho $
– the gas density
 $,\;P$
– the gas pressure,
 ${q_j}\;$
– the heat flux, and
 ${\tau _{ij\;}}$
– the viscous stress tensor. In addition, the perfect gas equation of state was considered, the two equations mentioned in Menter’s k-
 $\omega$
SST model Ref. (24) is given below
 \begin{align} \frac{{\delta k}}{{\delta t}} + {u_i}\frac{{\delta k}}{{\delta {x_j}}} = \frac{1}{\rho }{p_k}\!\left( {\frac{{{M_\infty }}}{{Re}}} \right) - {\beta ^/}{\rm{k\omega }}\!\left( {\frac{{Re}}{{{M_\infty }}}} \right) + \frac{1}{\rho }\frac{\delta }{{\delta {x_j}}}\left[ {\left( {\mu + \frac{{{\mu _T}}}{{{\sigma _k}}}} \right)\frac{{\delta k}}{{\delta {x_j}}}} \right]\left( {\frac{{{M_\infty }}}{{Re}}} \right) \end{align}
 \begin{align} \frac{{\delta \omega }}{{\delta t}} + {u_j}\frac{{\delta k}}{{\delta {x_j}}} & = \frac{1}{\rho }{p_\omega }\!\left( {\frac{{{M_\infty }}}{{Re}}} \right) - \beta {{\rm{\omega }}^2}\!\left( {\frac{{Re}}{{{M_\infty }}}} \right) + \frac{1}{\rho }\frac{\delta }{{\delta {x_j}}}\left[ {\left( {\mu + \frac{{{\mu _T}}}{{{\sigma _\omega }}}} \right)\frac{{\delta \omega }}{{\delta {x_j}}}} \right]\left( {\frac{{{M_\infty }}}{{Re}}} \right) \nonumber \\ & \quad + 2\!\left( {1 - F} \right)\frac{1}{{{\sigma _\omega }_2}}\frac{1}{\omega }\frac{{\delta k}}{{\delta {x_j}}}\frac{{\delta \omega }}{{\delta {x_j}}}\!\left( {\frac{{{M_\infty }}}{{Re}}} \right) \end{align}
Where,
 ${\mu _T} = \min\!\left[ {\frac{{\rho k}}{\omega },\frac{{{a_1}\rho k}}{{\Omega {F_2}}}\left( {\frac{{{\mathop{\rm Re}\nolimits} }}{M}} \right)} \right]$
;
 $p{}_k = {\mu _T}{\Omega ^2}$
;
 $p{}_\omega = \gamma \rho {\Omega ^2}$
;
 ${C_\mu } = {\beta ^/} = 0.09$
;
 ${F_1} = \tanh \!\left( {{\Gamma ^4}} \right)$
;
 $\Gamma = \min \!\left[ {\max\!\left( {{\Gamma _1},{\Gamma _3}} \right),{\Gamma _2}} \right]$
;
 ${F_2} = \tanh\!\left( {{\Pi ^2}} \right)$
;
 $\Pi = \max \!\left( {2{\Gamma _3},{\Gamma _1}} \right)$
;
 ${\Gamma _1} = \frac{{500v}}{{{d^2}\omega }}{\left( {\frac{{{M_\infty }}}{{{\mathop{\rm Re}\nolimits} }}} \right)^2}$
;
 ${\Gamma _2} = \frac{{4\rho k}}{{{d^2}{\sigma _{{\omega _2}}}\!\left( {C{D_{k - \omega }}} \right)}}$
;
 ${\Gamma _3} = \frac{{\sqrt k }}{{{C_\mu }d\omega }}{\left( {\frac{{{M_\infty }}}{{{\mathop{\rm Re}\nolimits} }}} \right)^2}$
;
 $C{D_{k - \omega }} = \max\! \left( {\rho \frac{2}{{{\sigma _{{\omega _2}}}\omega }}\frac{{\partial k}}{{\partial {x_j}}}\frac{{\partial \omega }}{{\partial {x_j}}},1 \times {{10}^{20}}} \right)$
.
GCI on the fine grid

Table 8 shows the grid convergence index
 $\left( {GCI} \right)\;$
study for the model Ref. (Reference Roache25).
 $GCI$
is a standardised way to report grid convergence quality. Following are the summary of the equations and steps that are followed during the grid convergence study:
-
1. By keeping constant refinement ratio, i.e.
$r\; = \;1.2$
, the coarse, medium and fine meshes were run in the ansys software. The coefficient of base drag is used to indicate grid convergence. -
2. The order of convergence,
$p$
is explained in Equation (16), in terms of
${f_1},{\rm{\;}}{f_2}{\rm{\;and\;}}{f_3}.$


 \begin{align} p{\rm{\;}} = {\rm{\;}}\frac{{ln\!\left( {\frac{{{f_3} - {f_2}}}{{{f_2} - {f_1}}}} \right)}}{{ln{\rm{\;}}r}} \end{align}
-
3. Richardson extrapolation method is used to predict the value at
$H = 0$
, Where
${f_{H = 0{\rm{\;}}}}$
is the continuum value at zero grid spacing.


 \begin{align} {f_{H = 0{\rm{\;}}}} \cong {f_1} + {\rm{\;}}\frac{{{f_1} - {f_2}}}{{{r^p} - 1}} \end{align}
-
4. The factor of safety is recommended to be
$Fs = 3.0$
for comparisons of two grids and
$Fs = 1.25$
for comparisons over three or more grids. Hence,
$Fs$
considered here is 1.25. Then grid convergence index
$\left( {GCI} \right)$
for the medium and fine refinement levels is,


 \begin{align} GC{I_{Fine}}{\rm{\;}} = {\rm{\;}}\frac{{{F_s}\left| {{\delta _{ij}}} \right|}}{{\left( {{r^p} - 1} \right)}} \end{align}
-
5. It should be ensured that grids are in the asymptotic range of convergence by checking.
 \begin{align} GCI\; = \;\frac{{GC{I_{23}}}}{{{r^p}GC{I_{12}}}} \end{align}
Grid independence study was based on
 $GCI$
criteria.
 $GC{I_{23}}{\approx}{r^p}\;GC{I_{12}}$
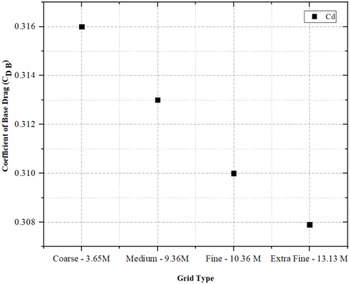
. Based on the iteration values extracted from software, the solutions were checked to find whether they fall under the asymptotic range of convergence. To check the solution, Equation (19) was taken into account. The values are plotted in the Fig. 6. Overall GCI for k-ω SST model is closer to 1 as shown in Table 8, therefore for further analysis extra-fine mesh is considered.
Detailed grid study.

3.0 Experiments
3.1 Instrumentation and uncertainty
The model is mounted on the articulated support strut. Static pressure measurements on the base of the model were carried out using a 32-port electronically scanned pressure (ESP) scanner of range ±15 psid. The unsteady pressures were measured at desired locations on the model using 1.6mm diameter, ±68.947kPa differential range, cylindrical-type Kulite pressure transducers, each transducer was statistically calibrated, which showed excellent linearity. The accuracy of an ESP module is ±0.015% of the maximum pressure, corresponding to ±0.002psi. The ESP scanner was housed within the forebody. The tunnel stagnation pressure (P o) and static pressure (P s) were measured using 150psia and ±15psid pressure transducers, respectively. A known pressure called as check pressure was given to scanner port number 32, during every test to confirm the accuracy of measurements. The pressure data from the ESP scanner were acquired at each angle-of-attack after an initial stabilisation time (dwell) of 3s. The scanner ports were scanned sequentially at a sampling rate of 500 samples per second and a total of 20 samples per port were acquired. The 20 samples of data were then averaged to obtain the surface pressure data. Uncertainty in pressure measurement is within ±0.1% of range of pressure transducers employed, i.e. ±0.015psi i.e. ±0.68kPa. The ESP scanners were calibrated using a 5-point calibration prior to use. Freestream Mach number repeatability is ±0.00047, coefficient of pressure is ±0.000464, and coefficient of drag is ±0.000423. For calculating the uncertainty, general formula used in any calculated value from measured data is Ref. (Reference Batill26):
 \begin{align} {u_R} = \pm {\left[ {{{\left( {\frac{{{x_1}}}{R}\frac{{\delta R}}{{\delta {x_1}}}{u_1}} \right)}^2} + {{\left( {\frac{{{x_2}}}{R}\frac{{\delta R}}{{{\delta _2}}}{u_2}} \right)}^2} + \ldots . + {{\left( {\frac{{{x_n}}}{R}\frac{{\delta R}}{{\delta {x_n}}}{u_n}} \right)}^2}} \right]^{1/2}} \end{align}
 \begin{align} \frac{{P{L_r}}}{r} = {\left[ {\mathop \sum \limits_{i = 1}^j \left( {\theta _i^/\frac{{P{L_{\bar Pi}}}}{{\bar Pi}}} \right)} \right]^{1/2}}\end{align}
 \begin{align} {B_P} = {\left[ {\mathop \sum \limits_{j = 1}^m \left( {\mathop \sum \limits_{i = 1}^k P_{pij}^2} \right)} \right]^{1/2}} \end{align}
Uncertainty in Mach number is measured from the total pressure p t and the ambient pressure p a, as given below in Equation (Reference Saiprakash, Senthil Kumar, Kadam Sunil, Singh Prakash, Shanmugam and Balu23):
 \begin{align} {u_M} = \pm {\left[ {{{\left( {\frac{{{p_t}}}{M}\frac{{\delta M}}{{\delta {p_t}}}{u_1}} \right)}^2} + {{\left( {\frac{{{p_a}}}{M}\frac{{\delta M}}{{\delta {p_a}}}{u_2}} \right)}^2}} \right]^{1/2}} \end{align}
Relative uncertainty in total pressure p t is:
 \begin{align} {u_{pt}} = {u_1} = \pm \frac{{unexpected{\rm{\;}}error{\rm{\;}}in{\rm{\;}}measured{{{\;p}}_t}}}{{{p_t}{\rm{\;}}measured}} \end{align}
3.2 Experimental setup
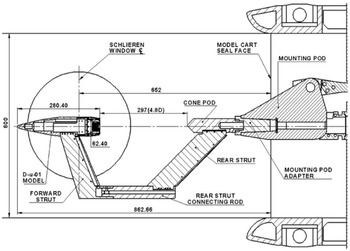
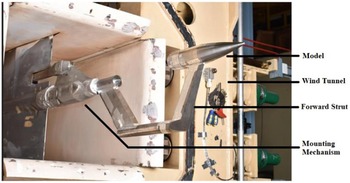
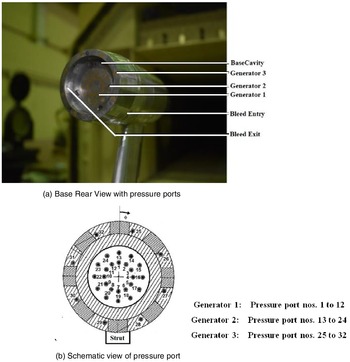
Steady pressure distribution on the base of a 1:2.5 scale 155mm shell projectile was measured at 0° angle-of-attack. The test is carried out in NAL 0.6m trisonic wind tunnel. Specification of the wind tunnel are as follows: (1) Test section square-type cross-sectional area: 0.6m × 0.6m, (2) operation type: intermittent blow down, (3) maximum test duration: 60s for 0.6m tunnel, (4) Mach number range: 0.2 to 4.0, (5) off-line and off-line flexible nozzle for supersonic, (6) the special feature of the facility avoids start-stop loads on the model, wherein the tunnel can be started at low supersonic Mach number 1.4 and the nozzle contour changed online to achieve higher supersonic Mach numbers up to 10s using VMFN. The tunnel has logged more than 5000 blow downs, (7) model incidence: −15° to +27° continuous and step modes, (8) model roll: 0° to 360°, (9) stagnation pressure: 1.5 to 8.0 bar, 10) Reynolds number: 8 × 10⁶ to 60 × 106 per meter. Model mounting mechanism is shown in the Fig. 7, in terms of schematic view. Photographic view is shown in Fig. 8, where the parts are labelled next to its parts. The design of a wind tunnel model shown in Fig. 7 is based on the concept that the base of the model to be kept free from any interference during flow because of the pressure measurements at the base are to be carried out. To meet this requirement an articulated support strut is designed. The base of the model is placed at an optimised distance from cone-pod- leading face to avoid the flow disturbance and erroneous measurements. Dedicated bleed hole blocks twelve in numbers are made in which eight numbers have 3mm bleed holes and four numbers have 4mm bleed holes. Both these bleed holes have the fixed inlet and exit angles. These bleed-hole blocks are fixed on to the rear body for the respective test’s configurations. The forebody has opening for placing the scanner inside. This cutout has a flat face machined by grinding to achieve higher surface accuracy. This flat surface is used for placing the pitch and yaw measurement plate by using four M3 tap holes and two φ 4 dowel holes. It has a plug at the rear end and is fixed to the rear body by plug and socket joint using eight M3 tap holes and one φ 4 dowel hole. Forebody top cover is fixed on to this body by four M3 tap holes and two φ 4 dowel holes. Two M4 CSK & three φ 3 dowel pin holes with socket is provided for fixing forward strut. Rear body has a socket at the front end and connected to forebody using eight M3 CSK holes and one φ 4 dowel hole. The eight rectangular pockets with tap holes M3, M2 are provided to fix the bleed hole blocks. There are four M4 CSK holes and one φ 4 dowels for cavity spacer fixing. These are the common screw holes and dowel hole for fixing cavity spacer at two positions. At the rear end it has eight holes of φ 2 through for inserting pressure tubes. The brass bushes are fixed at the rear end. The steel tubes along with brass bushes and rear body forms single unit. The free end of the steel tubes is connected to the scanner port using a polyethylene tube. This is the interfacing part between cone pod and 0.6 m tunnel mounting pod. It has internal threads to fix with cone pod threaded part and the male taper end to suit the 0.6m tunnel mounting pod. There is a φ 10mm hole for cable routing. The model is mounted using a strut type balance, with 32 pressure ports as shown in Fig. 9(a–b).
Schematic of 1:2.5 model mounted on regular pod in supersonic test section.

Photograph of 1:2.5 scale 155mm shell projectile model mounted in the test section of 0.6m tunnel.

(a) Base rear view with pressure ports and (b) schematic view of pressure port.

4.0 Results and discussions
Table 9 is the route map for CFD and experimental study, which is additionally clarified in forthcoming segments. Results based on CFD and experimental study are presented in this paper in terms of base drag coefficient
 ${C_{Db}}$
, and base pressure coefficient,
 ${C_{pb}}$
. While extracting the result, base drag coefficient
 ${C_{Db}}$
and base pressure coefficient
 ${C_{pb}}$
are non-dimensionlised using freestream properties and base area. The formulas used for base drag coefficient and base pressure coefficient are as follows:
 \begin{align} {C_{Db}} = \frac{{2{D_b}}}{{\rho {V^2}S}} \end{align}
 \begin{align} {C_{pb}} = \frac{{{p_b}{\rm{\;}} - {\rm{\;}}{p_\infty }}}{{0.5\rho {V^2}}} \end{align}
Configuration used for CFD simulation and experiment at Mach Number 2.

4.1 Base cavity
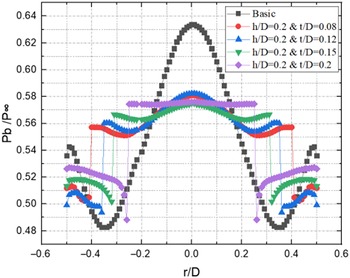
CFD simulation at Mach 2 freestream for basic configuration is shown in Fig. 10, a very low-pressure region is seen around r/D = 0.35. This low pressure is the main cause for the increased base drag. Therefore, in order to increase the base pressure and reduce base drag, base cavity is introduced as suggested in Ref. (Reference Viswanath and Patil17). Introduction of cavity leads to optimisation of depth and lip thickness. To optimise thickness ratio at first, h/D is kept constant at 0.2, then t/D is varied for a fixed freestream Mach 2. The base pressure ratio
 ${P_b}/{P_\infty }$
variations are shown in Fig. 10 for various thickness ratios. As seen from the Figure the t/D = 0.08 configuration gives higher base pressure ratio compared to all other cases simulated.
CFD result - base pressure variation for cavity configuration with constant depth and various lip thickness at M = 2.

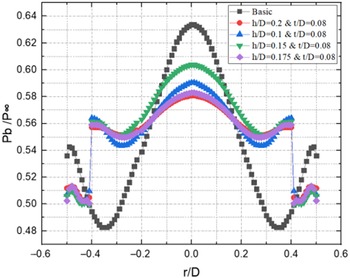
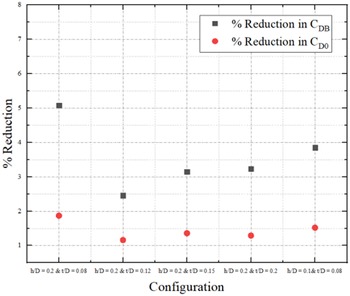
Next to optimise depth ratio, thickness ratio t/D is kept constant at 0.08, for the same freestream Mach 2. As seen from Fig. 11, the CFD results for various depth ratios clearly altered the base pressure distribution. The average base pressure ratio is higher for h/D = 0.15 closely followed by h/D = 0.2. Figure 12 illustrates the percentage of coefficient of base drag and overall drag with respect to basic configuration for different cavity lip thickness and depth ratios. From Fig. 12 h/D = 0.2 and t/D = 0.08 gives highest base drag reduction and overall reduction compared to other configurations tested. Therefore, in order to implement IWTB, a higher thickness ratio of 0.2 and depth ratio of 0.08 is chosen.
CFD result - base pressure variation for cavity configuration with constant lip thickness and various depth at M = 2.

CFD result for cavity optimisation at Mach 2.

4.2. Basic model with inward turning bleed hole
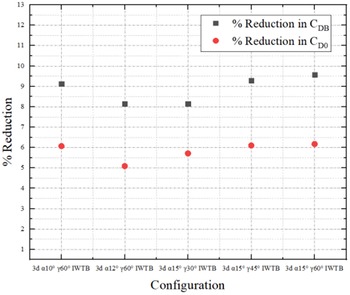
The optimisation of IWTB parameters such as bleed hole entry angle ‘α’, bleed hole exit angle ‘γ’, bleed hole diameter ‘d’ and number of holes ‘n’ are discussed in this section. First to optimise bleed hole exit angle, three exit angles such as 30°, 45° and 60° are studied by keeping bleed-hole exit angle 15°, bleed hole diameter 3 mm and 4 bleed holes. The optimization is carried out based on higher base drag and overall drag reduction. As seen Fig. 13 the 60° exit angle configuration gives maximum reduction in base drag and overall drag. Next, the bleed hole entry angle is varied as 10°, 12° and 15° for a fixed bleed hole exit angle of 60°, bleed hole diameter of 3mm and 4 number of bleed holes.
CFD result for bleed-hole entry angle and exit angle optimisation at Mach 2.

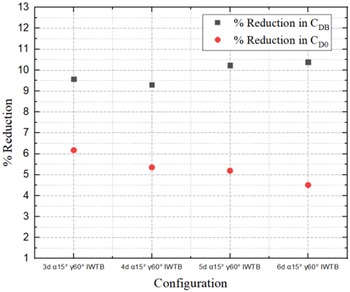
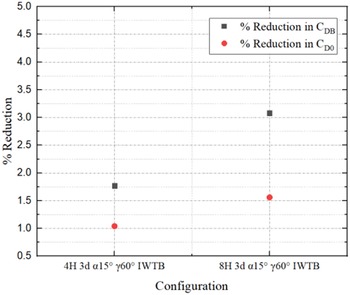
From this study, as seen from Fig. 13 the 15° bleed hole entry angle configuration gives highest percentage of reduction in base drag and overall drag. The bleed configuration with 15° entry angle and 60° exit angle gives 9.57% reduction in the base drag and 6.17% reduction in overall drag at Mach 2.0 compared to basic configuration. For optimising bleed-hole diameter, a fixed bleed-hole entry angle of 15°, bleed-hole exit angle of 60° and 4 number of bleed holes are studied. Out of the four bleed-hole diameters, namely 3, 4, 5 and 6mm, the configuration with 3mm bleed-hole diameter gives highest reduction in overall drag as seen from Fig. 14. For increasing the range of a shell projectile overall drag plays an important role hence the 3mm bleed-hole diameter with entry angle of 15° and exit angle of 60° model is selected based on the overall drag reduction of 6.17% reduction. The Fig. 15 shows comparison for base drag reduction and overall drag reduction for four- and eight-hole configurations at freestream Mach 2 by keeping hole diameter 3mm. Based on 3D simulation, for four holes 3mm diameter, α = 15°, γ = 60° the base drag reduction accounts 1.77% whereas overall drag reduction is 1.04%. For eight holes with 3mm diameter, α = 15°, γ = 60° base drag reduction is about 3.08% and overall reduction is 1.56%. Based on the comparison the eight bleed-hole configuration gives highest percentage of base drag as well as overall drag reduction. This result shown in Fig. 15 is based on the 3D model in the CFD simulation. Therefore, the result given by 3D model is much lesser compare to 2D axisymmetric model.
CFD result for various bleed hole diameter optimisation at Mach 2.

Comparison of drag coefficients for four and eight number of bleed holes optimisation at Mach 2.

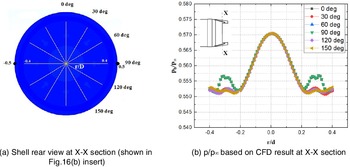
Figure 16 shows the CFD results on non-dimensionalised base pressure variation for an eight bleed-hole configuration at Mach 2. The base static pressure is non-dimensionlised by freestream static pressure. From the figure it can be observed that around r/D = 0.35 the base pressure is marginally increased due to bleed flow impingement. Whereas at the centre the magnitude of peak pressure is reduced compared to basic configuration due to (sectional pressure shown here is inside) the cavity. For eight bleed-hole configuration there is a bleed hole at base for every 45° angle. Hence at cut section 00/180° and 90°/270° base pressure increments are noticed compared to other section. Thus, from the base pressure distribution it is clearly visible that the average base pressure is increased compared to basic configuration and hence base drag is reduced.
Shell rear view showing CFD result for the pressure variation vs r/D for eight bleed holes at Mach 2.

4.3 Recirculation zone
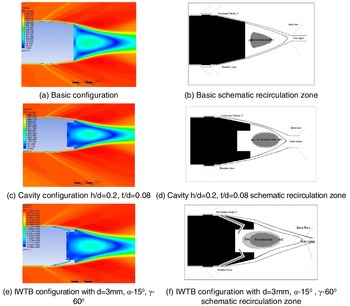
Figure 17 shows CFD velocity contour and corresponding schematic view for the extend of recirculation zone for basic configuration, cavity configuration and IWTB configuration. The region marked as Q-R in Fig. 17 is the extend of recirculation zone at the base. The points Q and R arrived based on the 5% variation in velocity from the peak value at the core of recirculation zone. From Fig. 17 it is observed that due to cavity and bleed flow the base velocity contour and the extend of Q-R is altered compared to basic configuration.
CFD velocity contour and schematic base flow at Mach 2.

Figure 18 shows the centreline static pressure variation for Mach 2 for various configurations. Near to the base at x/D = 4.5, the centreline static pressure is lower for all configurations as expected. Around x/D = 6 to 6.2 a sudden increase in pressure is noticed for all configurations. From this all configurations tends to show similar variation in centreline pressure with marginal changes in magnitude. But this trend is not same in radial direction at the base region. The radial pressure variations is the main cause for the base pressure increment and hence base drag reduction.
Centreline-pressure curve.

Table 10 shows the QR values for all the above configurations and the percentage reduction in Q-R. As, clearly seen in the Table 10, when compared to basic configuration, cavity configuration the percentage increase in Q-R at Mach 2 is only 2.57%. Whereas, for IWTB configuration with four-hole, 3mm diameter, α = 15°, γ = 60° the extend of wake is reduced drastically. Obviously for eight-hole, 3mm diameter, α = 15°, γ = 60° is introduced the extend of Q-R is further reduced.
Table 11 shows the split up of drag for various configuration in the Mach number region 0.7 to 2.0. All the result is based on 3D simulation. For all configuration the forebody drag gives higher compared to all other drag. The percentage of base drag is around 27% at Mach 0.7 and at Mach 2 it is around 42% for basic configurations. The maximum reduction in the base drag and overall drag due to cavity are 18.2% and 10.65%, respectively, at Mach 0.9. Compared to all other configuration the IWTB configuration with eight-hole, 3mm hole diameter, α = 15°, γ = 60° gives highest percentage reduction in base drag and overall drag for all freestream Mach numbers.
4.4 Experimental results
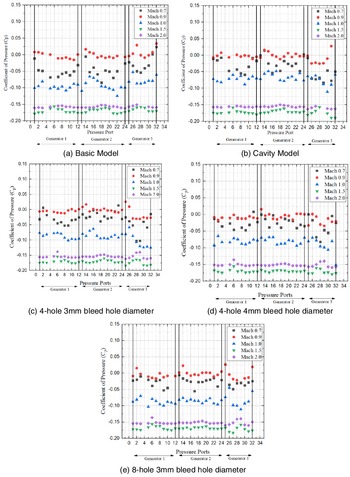
Experimental model is subjected with 32 pressure ports where both Generator 1 and 2 are kept over a versatile plate. Whenever, cavity and cavity with IWTB testing are conducted, the versatile plate was pushed inside for creating depression. The analysis done here is considered based on mean value (with strut effect) of the pressure (at a given generator). Table 12 explains the average variation of experimental and CFD simulation results. This result partially faces strut effect, since the model is placed in a strut type equaliser. Hence, a few of the nearby ports experiences the strut effect. Experimental study for various configuration is explained graphically in Fig. 19(a–e). Plots show that pressure increment is more in Mach 0.9 (transonic region), when compared with other Mach numbers. The comparison study for experimental and CFD ((C p)average) is shown in Table 12. The (C p)average is found using the software by selecting a section at the base where the (C p)average is required. Transonic flow for all configurations shows more drag reduction when compared with others. Supersonic Mach number shows lower base pressure when compared with other Mach numbers.
Re-circulation zone variation various configuration at Mach 2.

CFD results on base drag and total drag

Experimental (Cp)average and CFD (Cp)average for various configurations

Experimental comparison of all configurations based on C P.

4.5 CFD and experimental comparison
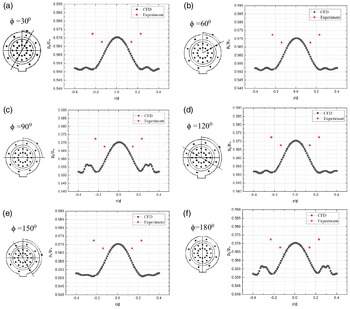
The comparison of experiment and CFD is done at selected port points and is shown in Fig. 20. At various r/D, CFD results are taken in eighty nodal points in radial direction, whereas experimental data is taken in circumferential order. Hence, only four points from experimental data can be compared with CFD data. The result obtained after comparison, holds less variation. Figure 20(a) shows the angle of orientation of 30° (clockwise). The matching between experimental values with CFD result are in good agreement, the maximum difference is within 3.85%. As seen from the figures due to bleed-flow impingement the experimental and CFD results on base static pressure is higher in the region around r/D = 0.3 at all radial lines. Similar trend is seen for other IWTB configurations at all freestream Mach numbers.
Experimental and CFD result for optimised model at 0° angle-of-attack at free stream Mach number 2.0.

4.6 Schlieren flow visualization
Equation (27) was used to determine the best placement for the background, light source and camera. Where,
 $\varepsilon$
is angle of deflection,
 $\Delta{y}$
= image displacement, Z
B = Background horizontal distance (origin on background plane), Z
D = Dot pattern for horizontal distance (origin on background plane), f = focal length of imaging lens. The schlieren windows were installed into the tunnel, for the straight view of the flow and perpendicular to the background. Optical grade (k/8) glass with distortion free were constructed.
 \begin{align} \varepsilon = \frac{{\Delta y{Z_B}}}{{{Z_D}f}} \end{align}
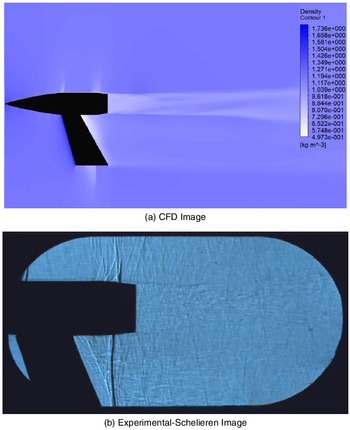
Schlieren setup is covered within small amount of space. The imaging was accomplished through an industrially computerised camera with high pixel resolution. The camera was mounted on a heavy tripod, fixed to the ground, with few meters away from the tunnel. For various configurations for 0° angle-of-attack videos were taken. As the flow passes the shock wave gets swept back. Figure 21 shows visualisation of shockwave pattern at Mach 0.9 using schlieren setup. There is a recompression shock in the wake neck region, whose wake focalizes to form a shock. For comparison purpose strut effect is also included in the CFD analysis. Expansion fan is seen at the intersection of forebody, and intersection at the constant cylindrical section with the boattail. Same effect is seen in the schlieren image.
Comparison of schlieren and CFD image at free stream Mach 0.9.

5.0 Conclusions
Base drag is an important part of the total drag and approximately accounts 40% of the total drag. This paper presents the theoretical calculation of the coefficient of drag for basic shell configuration and it is estimated using ESDU data and semi-empirical models. It is found that the maximum contribution of base drag in the total drag is about 61% at freestream Mach 0.9. Therefore, it is very important to find a method to reduce the base drag in order to reduce the overall drag. In this paper a novel passive method of IWTB technique is considered for the base drag reduction, CFD and experimental results and analysis were also presented. The implementation of IWTB technique calls for various base modifications such as cavity depth, cavity thickness, inward turning angle, exit turning angle for the bleed holes, bleed hole diameter and number of bleed holes, and they are all studied in detail in this paper.
The axisymmetric models for subsonic and sonic flows and 3D models for supersonic flows were created using SolidWorks. The unstructured extra fine meshes were generated using ICEM CFD software. A detail grid convergence study is carried out and presented in the paper; it is found that overall GCI is closer to one for the extra-fine mesh considered. A density-based solver with SST k-ω turbulence model is used for the fluent analysis.
Experiments were carried out using NAL 0.6m trisonic wind tunnel. The steady pressure distribution on the base of a 1:2.5 scale 155mm shell projectile was measured at various Mach numbers in the range of 0.7 to 2.0, and at angle-of-attack 0°. The steady pressure is measured at selected locations on the base of the shell projectile for several test configurations, namely basic configuration (without bleed hole and cavity), cavity alone configuration (without bleed hole), number of bleed hole 4 and 8, and bleed hole diameter 3mm and 4mm. A detailed uncertainty analysis is carried out using the standard procedure for the pressure measurements and for calculated freestream Mach number, coefficient of pressure and coefficient of drag.
The results obtained from experiment are presented here in terms of coefficient of base pressure and CFD result is presented here in terms of coefficient of base pressure and coefficient of base drag.
The IWTB technique is found to be more efficient in reducing the base drag compared to basic and cavity alone configurations. The following are the summary of results and discussion carried out on the CFD and experimental study.
-
• Very-low-pressure region is observed around r/D 0.35 for basic configuration for all Mach number in the range 0.7 to 2.0.
-
• Thickness and depth ratio of 0.2 and 0.08, respectively, gives the higher base drag reduction and overall reduction.
-
• Effect of bleed-hole entry angle and exit angle is studied using axisymmetric model, the bleed configuration with 15° entry angle and 60° exit angle gives 9.57% reduction in the base drag and 6.17% reduction in overall drag at Mach 2.0 compare to basic configuration.
-
• The effect of varying bleed-hole diameter on the base drag reduction is analysed using axisymmetric model. Out of the four variations in bleed-hole diameters, 3mm is giving 6.17% reduction in the overall drag compare to basic configuration.
-
• The effect of free stream Mach number on the base drag reduction with IWTB is studied. The IWTB configuration gives maximum base drag reduction of about 75.63% at Mach 0.9 for eight bleed holes with 3mm bleed-hole diameter, bleed-hole entry angle of 15° and exit angle of 60°, compared to basic configuration based on 3D simulation.
-
• CFD results are compared with experimental result for selected cases, the matching between the CFD and experiment result is found to be good and the differences lies within 3.85% based on 3D simulation.
Thus, the IWTB technique is efficient in reducing base drag and can be easily implemented.
The idea of IWTB is to divert relatively high-pressure surface flow to low pressure base region. The numerical simulation of basic shell configuration shows that at the surface a high pressure is acting just ahead of rubber band. Therefore, the original proposal of IWTB is to place the intake of bleed holes ahead of rubber band in the shell configuration without affecting the fuse. CFD simulation shows that, if the bleed intake is taken ahead of rubber band, the base drag reduction would be still higher than the present configuration. But later it is understood that while launching of shell projectile the rubber band acts as a pressure seal. Therefore, it is not possible to take bleed intake ahead of rubber band.
While launching the shell projectile the minute soot may block the bleed holes, therefore for accurate launching of shell projectile it is essential to study the static and dynamic stability of shell project when the holes are asymmetrically blocked.
The purpose of boattailing is to reduce base drag; therefore, a study can also be made to find the efficiency of IWTB technique without boattail effect.
The above study may be extended to find the effect of angle-of-attack on the drag reduction. Trajectory simulation may also be performed to find the increment in range.
Declaration of Conflicting Interests
The author(s) declared no potential conflicts of interest with respect to the research, authorship and/or publication of this article.
Acknowledgement
Authors sincerely thank the late Dr. S. Panneerselvam, professor of eminence, for suggesting IWTB method of base-drag reduction. We also thank AU-CFR for providing an ACRF scholarship to the corresponding author.
Funding
This project was assigned and funded by ERIP, DRDO, New Delhi, entitled “Passive Method of Base Drag Reduction for Range Enhancement of Gun Launched Shell Configuration.” Experimental test was conducted at NAL trisonic 0.6m facility.