1 Introduction
A standard benchmark fluid–structure interaction problem is the flow-induced flutter of a flexible flag. This canonical problem is studied as a model system for a wide range of applications such as, paper in a printing press (Watanabe et al. Reference Watanabe, Suzuki, Sugihara and Sueoka2002), snoring (Huang Reference Huang1995), aeroelastic fluttering (Tang, Yamamoto & Dowell Reference Tang, Yamamoto and Dowell2003), etc. Recent studies also suggest novel non-traditional applications of passive flag flapping to reduce turbulent effects (Shen et al. Reference Shen, Zhang, Yue and Triantafyllou2003), to increase propulsion efficiency (Shoele & Zhu Reference Shoele and Zhu2013), and to enhance heat transfer in packaged electronics (e.g. Shoele & Mittal Reference Shoele and Mittal2014; Ali et al. Reference Ali, Menanteau, Habchi, Lemenand and Harion2016). The large amplitude flow-induced oscillations are the basis of some energy harvesting concepts (e.g. Allen & Smits Reference Allen and Smits2001; Shoele & Mittal Reference Shoele and Mittal2016a), and have an application in monitoring the environmental flow (e.g. Orrego et al. Reference Orrego, Shoele, Ruas, Doran, Caggiano, Mittal and Kang2017).
Experimental (e.g. Zhang et al. Reference Zhang, Childress, Libchaber and Shelley2000), numerical (e.g. Zhu & Peskin Reference Zhu and Peskin2002; Connell & Yue Reference Connell and Yue2007) and analytic studies (e.g. Alben & Shelley Reference Alben and Shelley2008; Eloy et al. Reference Eloy, Lagrange, Souilliez and Schouveiler2008) have been conducted to elucidate the physics of the flow-induced vibration of flexible elastic plates. Traditionally, three dimensionless parameters have been used to describe the governing physics of this system, namely the ratio of the time scales between the flow and structure,  $U^{\ast }$, the fluid-to-structure mass ratio,
 $M^{\ast }$, and the Reynolds number,
 $Re$, respectively, defined as
 $$\begin{eqnarray}U^{\ast }=UL\,\sqrt[]{\frac{m_{s}}{k_{b}}},\quad M^{\ast }=\frac{\unicode[STIX]{x1D70C}L}{m_{s}},\quad Re=\frac{UL}{\unicode[STIX]{x1D708}},\end{eqnarray}$$
where  $U$ is the free stream velocity,
 $L$ the flag length,
 $m_{s}$ the mass per unit length of the flag,
 $k_{b}$ the bending rigidity,
 $\unicode[STIX]{x1D70C}$ the fluid density and
 $\unicode[STIX]{x1D708}$ the kinematic viscosity of the fluid. Physically,
 $U^{\ast }$ is the ratio of the flag’s natural oscillation period in a vacuum to the convective time of a fluid particle passing over the length of the flag (e.g. Païdoussis, Price & De Langre Reference Païdoussis, Price and De Langre2010; Shoele & Mittal Reference Shoele and Mittal2014). Alternatively it can also be thought of as a non-dimensional bending flexibility of the structure. The relative importance of the fluid force compared to the structure’s inertia (the added mass effect) is quantified with
 $M^{\ast }$.
The fluttering response of a flag was first studied theoretically by Rayleigh (Reference Rayleigh1878). Later, it was experimentally examined by Taneda (Reference Taneda1968), who reported the existence of a threshold velocity below which the flags do not flap. Subsequent experiments using soap-film flow visualization by Zhang et al. (Reference Zhang, Childress, Libchaber and Shelley2000) showed two states, i.e. a fixed-point state (no flapping) and a coherent flapping state. More recently, theoretical and numerical techniques (e.g. Argentina & Mahadevan Reference Argentina and Mahadevan2005; Connell & Yue Reference Connell and Yue2007; Alben & Shelley Reference Alben and Shelley2008; Eloy et al. Reference Eloy, Lagrange, Souilliez and Schouveiler2008; Michelin, Smith & Glover Reference Michelin, Smith and Glover2008; Shoele & Mittal Reference Shoele and Mittal2016b) have been utilized to better explain the stability of the flapping flag. Argentina & Mahadevan (Reference Argentina and Mahadevan2005) studied the effects of added mass and finite length of the structure theoretically. Later, Connell & Yue (Reference Connell and Yue2007) found three distinct response regimes: (i) fixed point; (ii) limit-cycle flapping; and (iii) chaotic flapping. These regimes are verified in the global stability studies (e.g. Alben & Shelley Reference Alben and Shelley2008; Shoele & Mittal Reference Shoele and Mittal2016b) wherein the stability boundary of the system and its dependence on  $U^{\ast }$,
 $M^{\ast }$ and
 $Re$ are studied. A related fluid–structure interaction problem is the vortex induced vibration (known as VIV) of a bluff body (cylinder). Vortex induced vibration of a heated cylinder was studied by Wan, Patnaik & Ervin (Reference Wan, Patnaik and Ervin2015) and showed that the stability of the system could be enhanced by thermal control and that there exists a critical heating to minimize the drag force. Kadhim & Mery (Reference Kadhim and Mery2016) studied the flutter of flat plate heat fins and showed enhanced heat transfer coefficients for the fluttering fins.
Despite the abundant research in this field, including those referenced above, to the best of our knowledge no work has been done in studying the thermal buoyant effects on the dynamics, stability and heat transfer of a heated flag. Advances in materials research have led to the developments of compliant heat generating and conducting materials that have become increasingly popular in research and industry. These materials have the potential to be used as passively dynamic heat sinks or heaters. We aim to demonstrate the viability of such systems, and along the way answer how the size of the systems affects their optimal thermal performance.
In the present study, a theoretical and numerical investigation is presented to investigate the effects of bending rigidity and buoyancy on the flapping dynamics and thermal response of a flexible flag. In § 2 the problem is defined and the model used in this study is described. A linear stability analysis and computational study of the flags dynamic and thermal response are discussed in § 3. Concluding remarks are presented in § 4.
2 Problem formulation
A flag of surface temperature  $T_{s}$, with a fixed leading edge and a free trailing edge is considered here. The flow is unbounded, incompressible and viscous with an incoming flow velocity of
 $U$ and an ambient temperature of
 $T_{\infty }$. The gravity force is assumed to act along the streamwise direction, parallel to the flag. With the presence of thermal forces, there is another predominant time scale associated with the acceleration of the boundary layer due to buoyancy, namely the Richardson number,
 $Ri$, where
 $$\begin{eqnarray}Ri=\frac{g\unicode[STIX]{x1D6FD}\unicode[STIX]{x0394}TL}{U^{2}},\end{eqnarray}$$
 $g$ is the gravitational constant,
 $\unicode[STIX]{x1D6FD}$ is the volumetric expansion coefficient and
 $\unicode[STIX]{x0394}T=T_{s}-T_{\infty }$. Here,
 $Ri$ is a ratio which quantifies the relative strength of buoyancy to inertial forces. A negative
 $Ri$ corresponds to the buoyancy effect opposing the incoming flow (decelerated flow), and a positive
 $Ri$ value indicates that the buoyancy effect and the incoming flow are in the same direction (accelerated flow).
The flag is computationally modelled as an elastic, neutrally buoyant and inextensible structure with zero thickness and its dynamics are governed by
 $$\begin{eqnarray}m_{s}\frac{\unicode[STIX]{x2202}^{2}\boldsymbol{X}}{\unicode[STIX]{x2202}t^{2}}=\frac{\unicode[STIX]{x2202}}{\unicode[STIX]{x2202}s}\left(\unicode[STIX]{x1D70E}\boldsymbol{t}+q\boldsymbol{n}\right)-\boldsymbol{F},\end{eqnarray}$$
where  $s$ is a Lagrangian coordinate along the flag,
 $\boldsymbol{t}=\unicode[STIX]{x2202}\boldsymbol{X}/\unicode[STIX]{x2202}s$ is the unit tangent and
 $\boldsymbol{n}$ is the unit normal. Tension,
 $\unicode[STIX]{x1D70E}$, is calculated from the inextensibility constraint
 $\unicode[STIX]{x2202}/\unicode[STIX]{x2202}t(\unicode[STIX]{x2202}\boldsymbol{X}/\unicode[STIX]{x2202}s)=0$ and the shear force is
 $q=-k_{b}\,\unicode[STIX]{x2202}(\boldsymbol{n}\boldsymbol{\cdot }\unicode[STIX]{x2202}^{2}\boldsymbol{X}/\unicode[STIX]{x2202}s^{2})/\unicode[STIX]{x2202}s$. Finally,
 $\boldsymbol{F}$ is the interaction force applied by the reed on the fluid.
The governing equations for the fluid are the non-dimensional incompressible Navier–Stokes equations with the Boussinesq approximation,
 $$\begin{eqnarray}\displaystyle & \displaystyle \unicode[STIX]{x1D735}\boldsymbol{\cdot }\boldsymbol{u}=0, & \displaystyle\end{eqnarray}$$
 $$\begin{eqnarray}\displaystyle & \displaystyle \frac{\unicode[STIX]{x2202}\boldsymbol{u}}{\unicode[STIX]{x2202}t}+\unicode[STIX]{x1D735}\boldsymbol{\cdot }(\boldsymbol{u}\boldsymbol{u})=-\unicode[STIX]{x1D735}p+\frac{1}{Re}\unicode[STIX]{x1D6FB}^{2}\boldsymbol{u}+Ri\,\unicode[STIX]{x1D703}+\boldsymbol{f}, & \displaystyle\end{eqnarray}$$
 $$\begin{eqnarray}\displaystyle & \displaystyle \frac{\unicode[STIX]{x2202}\unicode[STIX]{x1D703}}{\unicode[STIX]{x2202}t}+\boldsymbol{u}\boldsymbol{\cdot }\unicode[STIX]{x1D735}\unicode[STIX]{x1D703}=\frac{1}{Re\boldsymbol{\cdot }Pr}\unicode[STIX]{x1D6FB}^{2}\unicode[STIX]{x1D703}+q, & \displaystyle\end{eqnarray}$$
where  $\boldsymbol{u}(\boldsymbol{x},t)$ is the velocity,
 $p$ is the dynamic pressure and
 $\unicode[STIX]{x1D703}$ is the normalized temperature defined as
 $\unicode[STIX]{x1D703}=(T-T_{\infty })/(T_{s}-T_{\infty })$. Here,
 $Pr=\unicode[STIX]{x1D708}\,/\,\unicode[STIX]{x1D6FC}$ denotes the Prandtl number where
 $\unicode[STIX]{x1D6FC}$ is the thermal diffusivity of the fluid. In the right-hand side,
 $\boldsymbol{f}$ is the fluid–structure interaction forcing term and the heat flux
 $q$ on the surface of the flag.
The fluid and structure equations are coupled through an immersed boundary formulation and a regularized delta function. A generic fluid variable  $\unicode[STIX]{x1D6F7}$ (
 $\unicode[STIX]{x1D6F9}$) at the structure location
 $\boldsymbol{X}(s,t)$ is related to the corresponding Eulerian variable
 $\unicode[STIX]{x1D719}$ (
 $\unicode[STIX]{x1D713}$) according to
 $$\begin{eqnarray}\unicode[STIX]{x1D6F7}(s,t)=\int _{\unicode[STIX]{x1D6FA}_{F}}\unicode[STIX]{x1D719}(\boldsymbol{x},t)\unicode[STIX]{x1D6FF}[\boldsymbol{x}-\boldsymbol{X}(s,t)]\,\text{d}\boldsymbol{x}\quad \text{and}\quad \unicode[STIX]{x1D713}(x,t)=\int _{\unicode[STIX]{x2202}\unicode[STIX]{x1D6FA}_{S}}\unicode[STIX]{x1D6F9}(s,t)\unicode[STIX]{x1D6FF}[\boldsymbol{x}-\boldsymbol{X}(s,t)]\,\text{d}s,\end{eqnarray}$$
where  $\unicode[STIX]{x1D6FA}_{F}$ is the fluid domain and
 $\unicode[STIX]{x2202}\unicode[STIX]{x1D6FA}_{S}$ is the surface of the structure. The coupling interaction between fluid and structure variables is captured using a feedback law (Goldstein, Handler & Sirovich Reference Goldstein, Handler and Sirovich1993; Huang, Shin & Sung Reference Huang, Shin and Sung2007; Shoele & Zhu Reference Shoele and Zhu2012) as
 $$\begin{eqnarray}\left[\begin{array}{@{}c@{}}\boldsymbol{F}(s,t)\\ Q(s,t)\\ \end{array}\right]=c_{1}\int _{0}^{t}\left(\left[\begin{array}{@{}c@{}}\boldsymbol{U}(s,\unicode[STIX]{x1D70F})\\ \unicode[STIX]{x1D6E9}(s,\unicode[STIX]{x1D70F})\\ \end{array}\right]-\left[\begin{array}{@{}c@{}}\boldsymbol{V}(s,\unicode[STIX]{x1D70F})\\ Y(s,\unicode[STIX]{x1D70F})\\ \end{array}\right]\right)\,\text{d}\unicode[STIX]{x1D70F}+c_{2}\left(\left[\begin{array}{@{}c@{}}\boldsymbol{U}(s,t)\\ \unicode[STIX]{x1D6E9}(s,t)\\ \end{array}\right]-\left[\begin{array}{@{}c@{}}\boldsymbol{V}(s,t)\\ Y(s,t)\\ \end{array}\right]\right),\end{eqnarray}$$
where  $c_{1}=\unicode[STIX]{x1D70C}\unicode[STIX]{x1D6FD}U^{2}/L$ and
 $c_{2}=\unicode[STIX]{x1D70C}\unicode[STIX]{x1D6FE}U$, and where
 $\unicode[STIX]{x1D6FD}$ and
 $\unicode[STIX]{x1D6FE}$ are large penalty parameters to ensure the velocity and temperature boundary conditions on the surface of the flag. Here
 $\boldsymbol{V}(s,t)$ and
 $Y\,(s,t)$, respectively, denote the velocity and temperature of the structure, and
 $\boldsymbol{U}(s,t)$ and
 $\unicode[STIX]{x1D6E9}(s,t)$ are the interpolated flow velocity and temperature at the surface of the structure, respectively. A full description of the numerical implementation is given in Shoele & Mittal (Reference Shoele and Mittal2014).
3 Results
To examine the performance of the heated flag within the parametric space of  $U^{\ast }$ and
 $Ri$, a linear stability analysis is employed first to elucidate the governing mechanisms of the system. This is followed by a fully nonlinear numerical investigation on stability and thermal performance of the structure. We also report the flapping phase map in the
 $Ri{-}U^{\ast }$ space and propose the corresponding Nusselt number relations that describe the system’s thermal performance.
3.1 Linear stability
We follow Triantafyllou (Reference Triantafyllou1992) and Connell & Yue (Reference Connell and Yue2007), and write the linearized governing equations for the flag displacement  $\unicode[STIX]{x1D702}$ as
 $$\begin{eqnarray}m_{s}\frac{\unicode[STIX]{x2202}^{2}\unicode[STIX]{x1D702}}{\unicode[STIX]{x2202}t^{2}}-\frac{\unicode[STIX]{x2202}}{\unicode[STIX]{x2202}s}\left(\unicode[STIX]{x1D70E}\boldsymbol{t}\right)+k_{b}\frac{\unicode[STIX]{x2202}^{4}\unicode[STIX]{x1D702}}{\unicode[STIX]{x2202}s^{4}}+m_{a}\left(\frac{\unicode[STIX]{x2202}}{\unicode[STIX]{x2202}t}+V\frac{\unicode[STIX]{x2202}}{\unicode[STIX]{x2202}s}\right)^{2}\,\unicode[STIX]{x1D702}=0,\end{eqnarray}$$
where  $m_{s}$ and
 $k_{b}$ are defined material properties, and where
 $m_{a}$ is the added mass. Tension,
 $\unicode[STIX]{x1D70E}$, is assumed to be solely due to fluid forcing, and
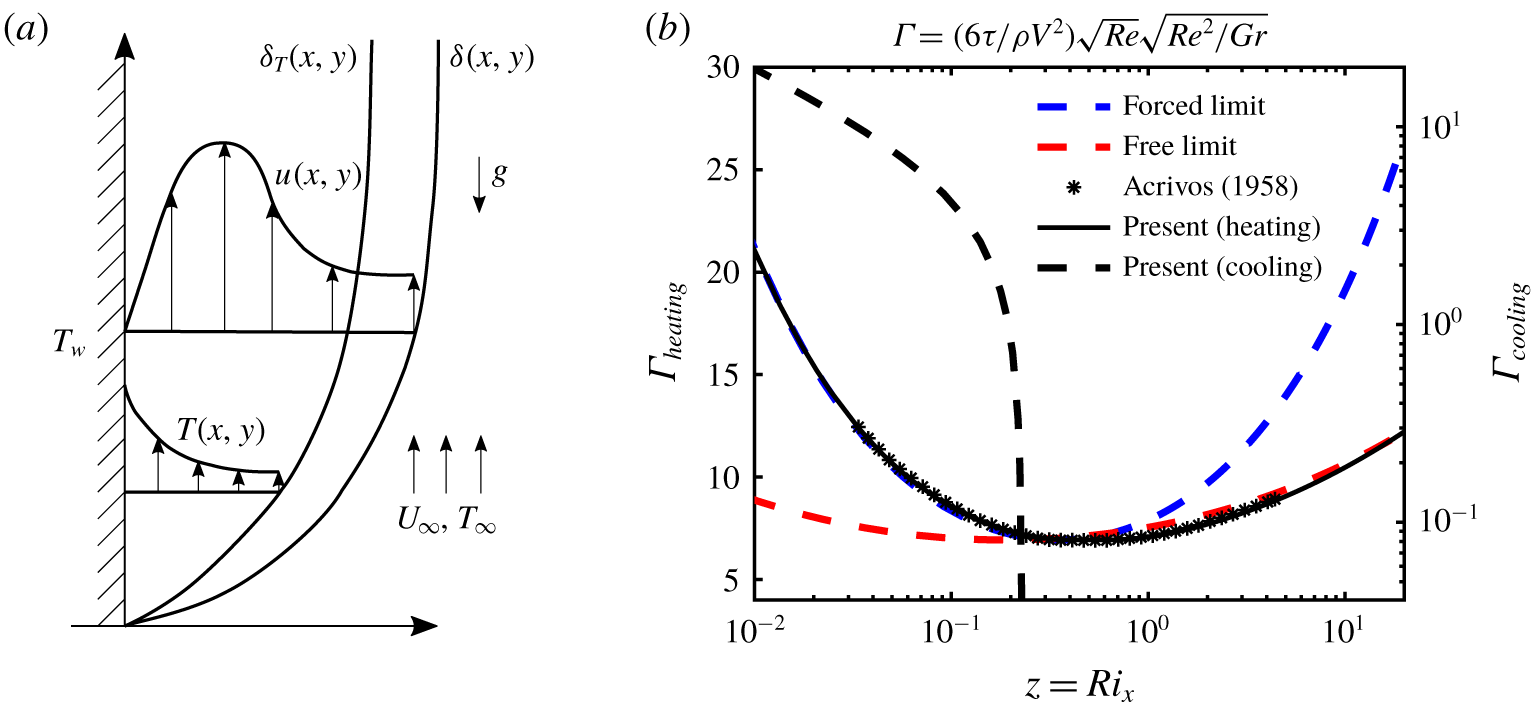
 $V=\unicode[STIX]{x1D6FC}_{V}U$ is the maximum thermal wall-jet velocity (see figure 1a). The flow is assumed to be inviscid outside a thin boundary layer close to the structure and the fluid force is fully described by the vorticity distribution along the flag (Lighthill Reference Lighthill1960). Furthermore, we assume that the tension and velocity are similar to those of flow over a vertical isothermal flat plate (figure 1a). The Pohlhausen–von Kármán momentum integral method is employed to obtain the boundary layer solution of flow over a vertical isothermal flat plate in order to calculate
 $\unicode[STIX]{x1D70E}$ and
 $V$ (Acrivos Reference Acrivos1958; Kobus & Wedekind Reference Kobus and Wedekind1996). Figure 1(b) shows the normalized flow shear force on the surface of the flag,
 $\unicode[STIX]{x1D6E4}(s)$, defined by Acrivos (Reference Acrivos1958) as
 $$\begin{eqnarray}\unicode[STIX]{x1D6E4}(s)=\frac{6\unicode[STIX]{x1D70F}(s)}{\unicode[STIX]{x1D70C}U^{2}}\sqrt{\frac{Re_{s}}{Ri_{s}},}\end{eqnarray}$$
where  $\unicode[STIX]{x1D70F}(s)$ is the shear along the flag. The present study (black lines in figure 1b) matches the results reported in Acrivos (Reference Acrivos1958). At low
 $Ri$ (pure forced convection limit), the Blasius boundary layer solution is recovered (blue dotted line in figure 1b) and at large
 $Ri$ (pure natural convection limit) the shear is similar to the analytical solution of a heated vertical plate in quiescent flow (red dashed line in figure 1b). We note that
 $\unicode[STIX]{x1D6E4}_{cooling}=0$ at
 $Ri_{s}\approx 0.3$ (decelerated flow regime) indicating the presence of a separation point along the flag’s boundary layer (Acrivos Reference Acrivos1958).
(a) Schematic of a heated vertical flat plate, (b) comparison of dimensionless shear  $\unicode[STIX]{x1D6E4}$ (Acrivos Reference Acrivos1958).

Tension,  $\unicode[STIX]{x1D70E}$, can then be calculated by integrating
 $\unicode[STIX]{x1D70F}(s)$ over the length of the flag. Non-dimensionalizing equation (3.1) with
 $\unicode[STIX]{x1D70C}$,
 $U$ and
 $L$, and assuming there is a traveling wave mode solution
 $\unicode[STIX]{x1D702}=A\text{e}^{\text{i}(k\,s-\unicode[STIX]{x1D714}t)}$, a dispersion relation between
 $\unicode[STIX]{x1D714}$ and
 $k$ can be formed as
 $$\begin{eqnarray}\unicode[STIX]{x1D714}=\frac{ck}{1/M^{\ast }+c}\pm \frac{k}{1/M^{\ast }+c}\sqrt{-\frac{\unicode[STIX]{x1D6FC}_{V}c}{M^{\ast }}+\left(\frac{1}{M^{\ast }}+c\right)\left(\frac{\unicode[STIX]{x1D70E}}{\unicode[STIX]{x1D70C}LU^{2}}+\frac{\unicode[STIX]{x1D6FC}_{V}^{2}\unicode[STIX]{x1D707}}{{U^{\ast }}^{2}}k^{2}\right)},\end{eqnarray}$$
where  $c=m_{a}/\unicode[STIX]{x1D70C}L$. The unstable modes correspond to a negative argument under the radical, i.e
 $$\begin{eqnarray}\frac{\unicode[STIX]{x1D6FC}_{V}^{2}c}{1+M^{\ast }c}>\frac{\unicode[STIX]{x1D70E}}{\unicode[STIX]{x1D70C}LU^{2}}+\frac{1}{M^{\ast }{U^{\ast }}^{2}}\,k^{2}.\end{eqnarray}$$
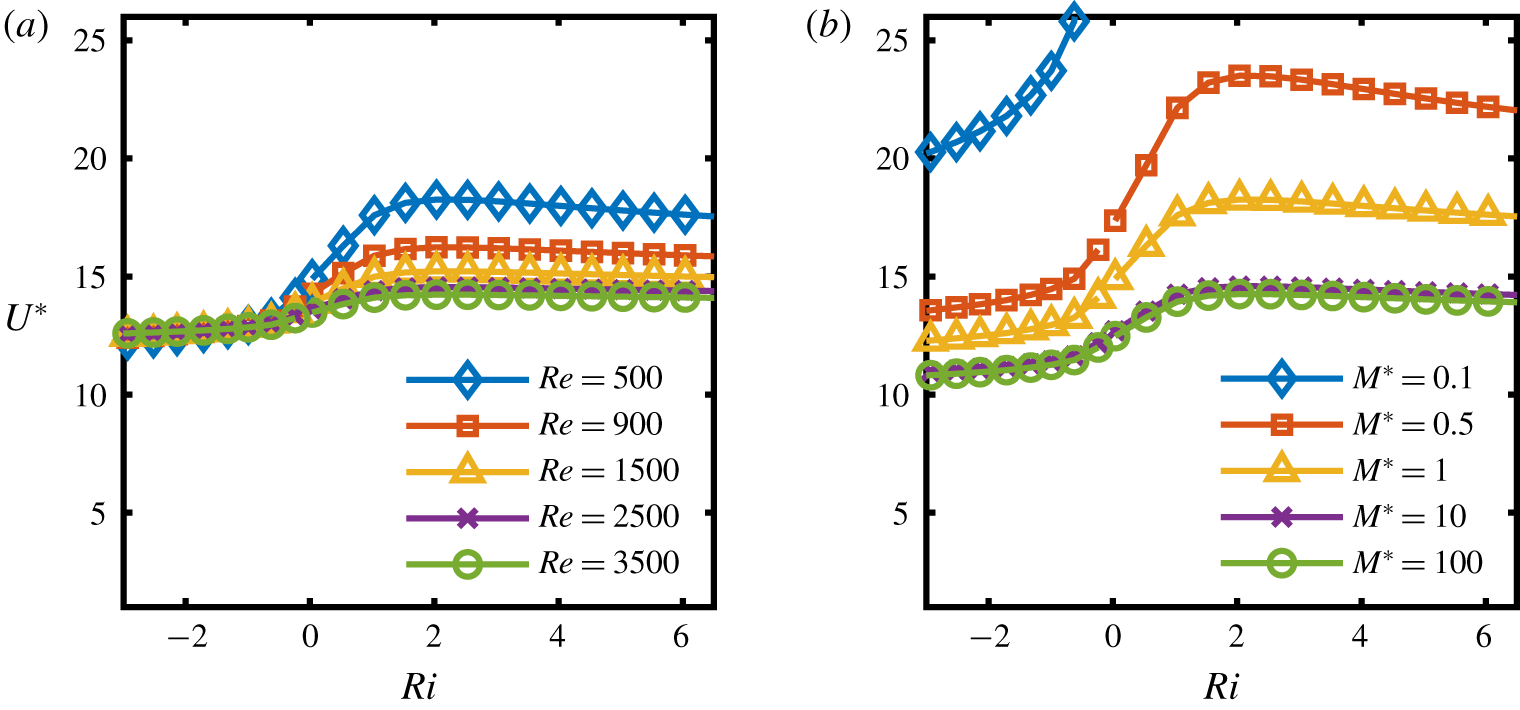
Critical bending rigidity  $U^{\ast }$ as a function of
 $Ri$ (a) for various
 $Re$ and
 $M^{\ast }=1$ (b) for various
 $M^{\ast }$ and
 $Re=500$.

Equation (3.4) shows that the tension and bending rigidity are stabilizing effects while a decrease in  $M^{\ast }$ for anticipated
 $c$ values acts as a destabilizing effect. An increase in
 $Ri$ results in higher viscous shear stress on the surface (see figure 1b), and consequently larger tension force, therefore an increase in
 $Ri$ enhances the stability. The added mass coefficient is set to
 $c=2/k$ from the potential flow solution of an infinite waving plate (Coene Reference Coene1992). Figure 2(a) shows the critical
 $U^{\ast }$, with
 $M^{\ast }=1$ and
 $k=2\unicode[STIX]{x03C0}$, for the onset of flapping at various
 $Re$. For sufficiently high
 $Re$ the effects of
 $Ri$ become less appreciable. The fluttering instability occurs at lower
 $U^{\ast }$ with a reduction of
 $Ri$. The stability boundary behaves linearly with
 $Ri$ for
 $Ri>0$ before reaching a maximum
 $U^{\ast }$ value beyond which it gradually decreases to its asymptotic value at larger
 $Ri$ as the natural convection limit is approached. This is due to the competing effects of increased tension force with an increase of
 $Ri$, and the increase in the buoyancy velocity
 $V$ at higher
 $Ri$ flows. Eventually, the two separate effects begin to balance and no change is seen in the stability threshold at large
 $Ri$. In fact, in both cooling and heating cases (figure 2a), the stability curves exhibit more
 $Ri$-dependence in the range of
 $-1\lesssim Ri\lesssim 1.5$. The dependence on
 $Ri$ is greater for lower
 $Re$, indicating that a thicker boundary layer will be more strongly affected by the thermal forcing along the surface. Figure 2(b) depicts the critical
 $U^{\ast }$ for various
 $M^{\ast }$ and
 $Re=500$. We observe that for very low
 $M^{\ast }$ (more massive flags), i.e.
 $M^{\ast }<0.1$, instability occurs when
 $Ri<-0.3$. This is due to the reduction in the tension force as a result of separation along the flag’s surface, causing the flag inertia term in (3.1) to dominate compared to the flow’s inertia (the last term in (3.1)). Consequently, instability only occurs when the tension effect has a destabilizing role, e.g. due to the boundary layer separation in the presence of thermal forces, independent of the
 $M^{\ast }$. An increase in
 $M^{\ast }$ reduces the stability threshold and results in the stability curve approaching its limit for
 $M^{\ast }\geqslant 10$ where the inertial effects of flow dominate.
3.2 Flag dynamics and thermal performance
The stability of the heated flag is extended to the nonlinear regime using numerical simulations in the space of  $Ri{-}U^{\ast }$ , for choices of
 $Re=500$,
 $Pr=1$ and
 $M^{\ast }=1$. The response of the heated flag is categorized based on its thermal condition into three flow regimes namely decelerated (
 $Ri<0$), neutral (
 $Ri=0$) and accelerated (
 $Ri>0$) states. The following results correspond to 14 different reduced velocities
 $1<U^{\ast }<26$ and 18 Richardson numbers
 $-2<Ri<6.5$ for a total of 252 cases.
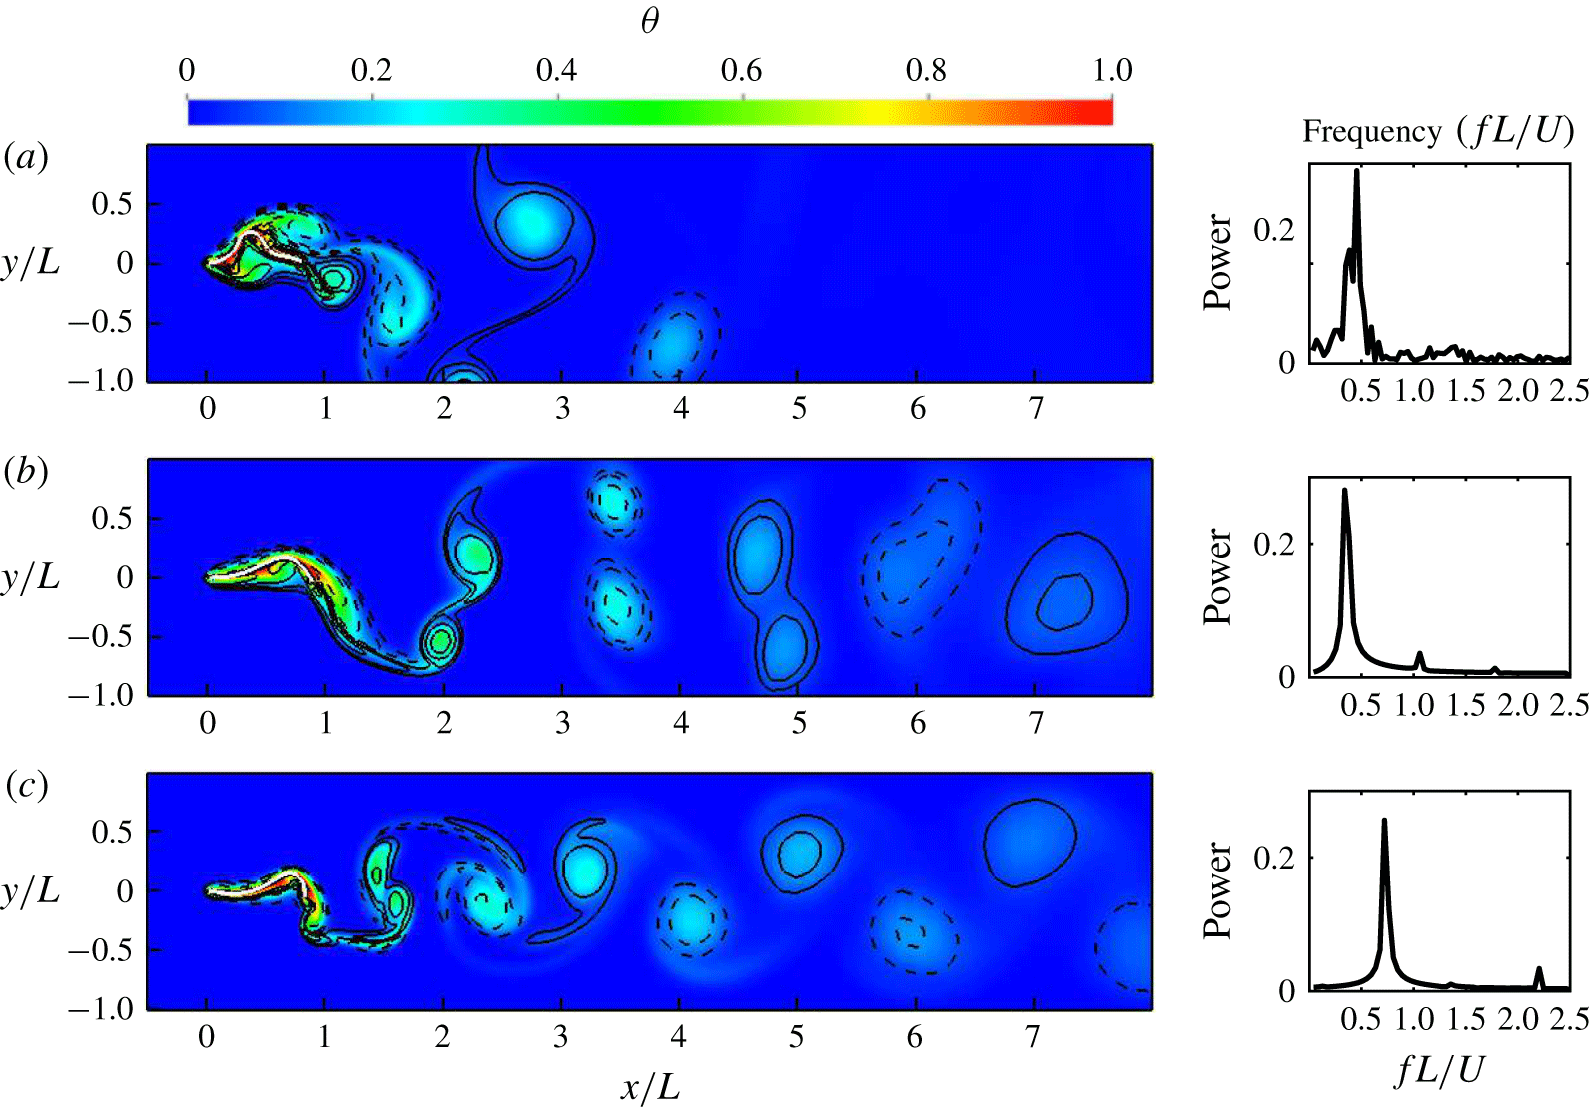
Plot of  $\unicode[STIX]{x1D703}=(T-T_{\infty })/(T_{s}-T_{\infty })$ (colour) and vorticity (
 $+$ solid lines;
 $-$ dashed lines), with power spectrum of the trailing edge motion. (a)
 $Ri=-2$, (b)
 $Ri=0$,(c)
 $Ri=4.5$. All figures shown at the half-period of the trailing edge flapping cycle with
 $U^{\ast }=24$,
 $M^{\ast }=1$ and
 $Re=500$.

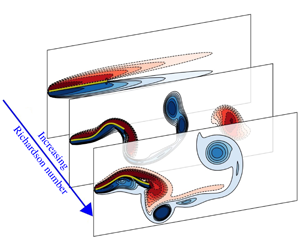
In the decelerated flow regime (a sample flow field is shown in figure 3a), the thermal buoyancy decelerates the flow close to the flag and triggers flow separation, leading to a reduction of heat transfer by the flag. The wake becomes irregular due to the multimodal vibrations (see power spectrum in figure 3a) of the flag. With the increase of  $Ri$ to zero (figure 3b), the wake narrows and the the trailing edge motion reaches a limit-cycle behaviour with one dominant frequency. A well-defined two-pair (2P) vortex mode appears in the wake where two same-signed vortices are shed during each half-cycle; one from trailing edge, and the other generated by the separation due to the large curvature of the structure when the trailing edge crosses zero. As seen in figure 3(c), at higher
 $Ri$ (here
 $Ri=4.5$) the oscillation amplitude decreases while the oscillation frequency increases. As the flow accelerates along the flag, the 2P vortex pairs merge together into a two-single (2S) vortex mode reminiscent of the familiar von Kármán vortex street. It is found that for low to moderate
 $U^{\ast }$, a decrease from positive to zero to negative
 $Ri$ results in a vortex wake transition of 2S to 2P to three same signed vortices (3P) mode. A reduction of the boundary layer thickness in the buoyancy accelerated cases leads to enhanced heat transfer.
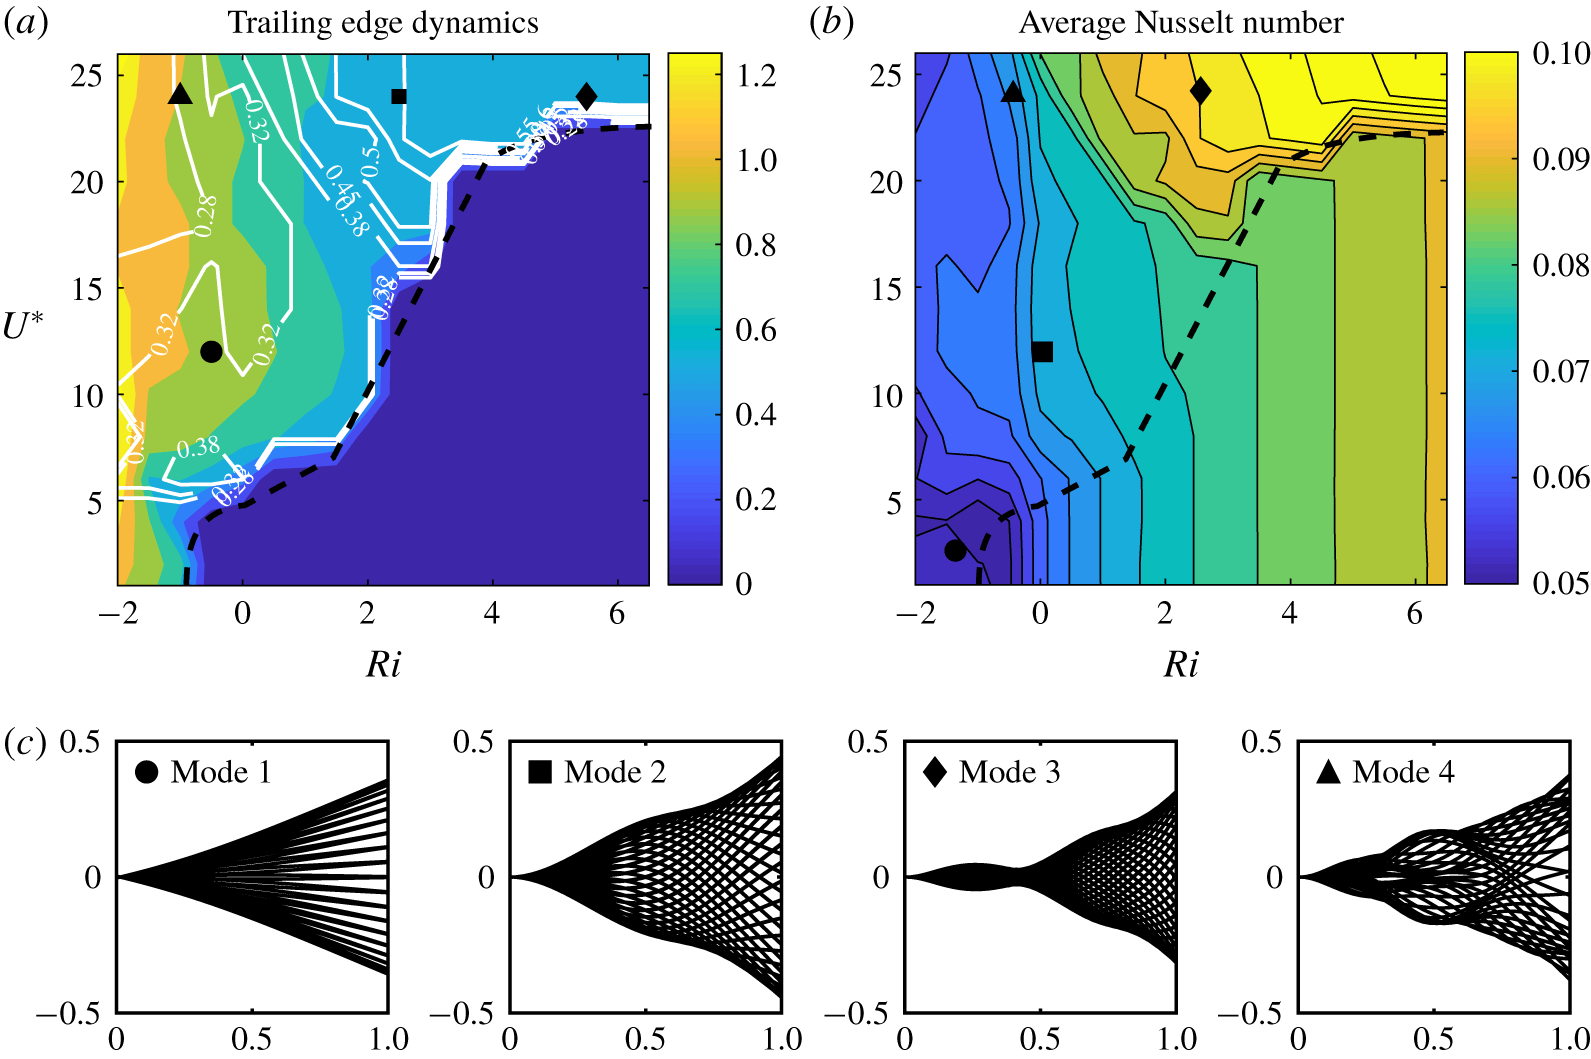
Effect of  $Ri$ and
 $U^{\ast }$ on the dynamic response of the flag. (a)
 $A/L$ (colour) and
 $St$ (line contours) of the trailing edge (TE), (b) Average Nusselt number
 $\overline{Nu}$, and (c) flapping modes for the marked cases in (a) and (b).

To better understand the flag flapping dynamics and thermal performance, the peak-to-peak trailing edge amplitude ( $A/L$), Strouhal number and the average Nusselt number of the flag, are plotted in figure 4(a,b). The average surface Nusselt number,
 $Nu$, and Strouhal number,
 $St$, are defined as
 $$\begin{eqnarray}Nu=\int _{0}^{L}\frac{\unicode[STIX]{x2202}(T_{s}-T)/\unicode[STIX]{x2202}n|_{s}}{(T_{s}-T_{\infty })}\,\text{d}s\quad \text{and}\quad St=\frac{f\,L}{U},\end{eqnarray}$$
where  $Nu$ is the ratio of convective to conduction heat transfer at the surface of the flag, and a measure of the effectiveness of the heat flux from the surface at a given temperature. Here,
 $St$ is the dominant frequency of the flapping motion (
 $f$) normalized by the flag length (
 $L$) and flow’s free stream velocity (
 $U$). The stability boundary between the flapping and stationary cases (dashed line), starts at the point
 $Ri=-0.5$ and
 $U^{\ast }=1$ indicating that for high negative
 $Ri$ values, the system is always unstable. The stability boundary for
 $Ri>0$ behaves linearly before approaching a plateau at high
 $Ri$, similar to the prediction from the linear stability analysis in § 3.1. Due to the inherent assumptions made in the linear stability analysis, such as using a constant amplitude traveling wave as the mode shape, neglecting the end effects and assuming a time-invariant tension force, the stability curve from linear stability is quantitatively different from the numerical simulations, although qualitatively both show a similar trend.
As seen in figure 4(a), the flag reaches a maximum displacement at a  $U^{\ast }=12$ and plateaus after
 $U^{\ast }>18$ regardless of
 $Ri$. Irrespective of
 $U^{\ast }$, an increase in
 $Ri$ always stabilizes the structure with a linear dependency of the stability boundary on
 $Ri>0$.
An increase in  $Ri$ induces higher tension in the flag causing the oscillation amplitude to decrease while the flapping frequency increases as shown in figure 4(a). The frequency response of the flag, characterized by
 $St$, is shown in figure 4(a) with white contours. At very high and very low
 $U^{\ast }$ and negative
 $Ri$, a region of low frequency (
 $St<0.28$) is observed. Increasing
 $Ri$ and moving into intermediate
 $U^{\ast }$ values, the flapping mode switches as
 $St$ increases beyond
 $St=0.28$. The frequency in this intermediate region is insensitive to changes in either parameter, while for much larger
 $U^{\ast }>18$ and positive
 $Ri$ there exists a strong
 $Ri$-sensitivity associated with the highest flapping mode. Due to the increased time scale of the structure at higher
 $U^{\ast }$, the effects of rigidity are less important compared to the faster response of the accelerated flow passing over the flag, seen as a strong dependence of
 $St$ on
 $Ri$. The governing restoring effect of the structure shifts from bending rigidity to tension dominated as
 $U^{\ast }$ is increased. As shown in § 3.1, tension increases proportionally to
 $Ri$. These two combined effects create a
 $St$ sensitive region to
 $Ri$ in the upper part of figure 4(a).
Effect of  $M^{\ast }$ on the (a) TE amplitude and (b) TE Strouhal number for
 $Ri=-0.5,0,0.5$ depicted by the different line styles and for three different
 $M^{\ast }$ depicted by the colours.

Figure 4(b) shows that, in the stable region,  $Nu$ is independent of
 $U^{\ast }$ and is positively affected by an increase
 $Ri$. The highest
 $Nu$ is observed in the
 $Ri>0$ and
 $U^{\ast }>18$ region where it shows minimal dependence on
 $U^{\ast }$. Similarly, a rapid increase in
 $Nu$ and higher sensitivity to
 $Ri$ can be seen which corresponds to a flapping mode switch indicating that higher modes are more effective in heat transfer.
The changes in dynamics and thermal performance attributed to mode switching are better illustrated in figure 4(c), in which multiple snapshots of the flag during one flapping cycle are presented for the selected cases marked in figure 4(a,b). Starting with  $U^{\ast }=2$ and
 $Ri=-1.5$ (● in figure 4), we observe mode-1, which has one node at the leading edge and relatively constant
 $Nu$. This mode is associated with
 $St<0.28$ and is caused by the competing effects of the destabilizing flow opposing buoyancy and restoring effects of bending rigidity. As
 $U^{\ast }$ increases to
 $U^{\ast }=12$ (▪ in figure 4), we observe the first mode switch and the appearance of a node or ‘neck’ at
 ${\approx}0.6L$. Mode-2 is associated with Strouhal numbers between
 $0.28<St<0.38$. For
 $U^{\ast }>18$, where the effects of
 $Ri$ are more appreciable, the second mode switch is apparent. This is mode-3 (♦ in figure 4) and it is characterized by the presence of yet an additional node as well as a rapid increase in frequency (
 $St>0.38$) and higher
 $Nu$. The mode switching occurs for
 $Ri>0$ and
 $U^{\ast }>18$. If instead,
 $Ri$ decreases into the buoyancy opposed regime, a transitional mode emerges ( ▲ in figure 4), and like the switch from mode-2 to mode-3, this transitional mode appears for
 $U^{\ast }>18$ and shows an overall increase in
 $Nu$ and higher
 $St$ sensitivity to
 $Ri$. The transition mode is governed by two primary frequencies, where the node in the first half of the flag oscillates at one frequency while the rest of the flag and trailing edge oscillate at a different frequency. This mode changes to a chaotic mode upon further reduction in
 $Ri$, with the chaotic mode oscillating at
 $St<0.28$. The rapid change of
 $St$ with
 $Ri$ for mode-3 and the transition mode is due to the tension-dependent restoring effects previously discussed. Both mode-3 and the transition mode show a node around the half-length of the flag. This extra node practically reduces the effective length of the flag from the trailing edge’s perspective and as a result the flag’s natural frequency increases.
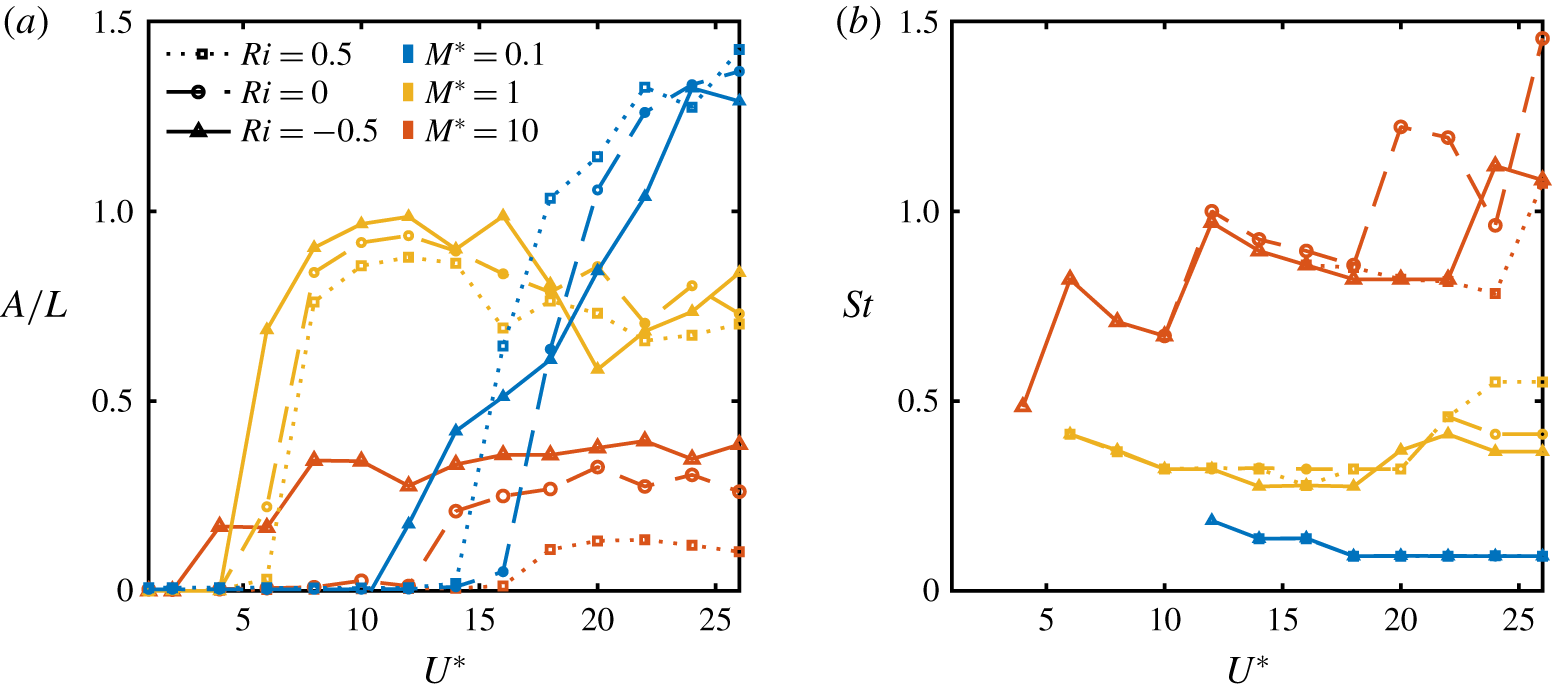
Furthermore, to study the effects of mass, different  $M^{\ast }$ values of 0.1, 1 and 10 are examined (figure 5a,b). Larger
 $M^{\ast }$ values are associated with lower structure mass. In figure 5 we see that in general an increase in
 $M^{\ast }$ (lowering structure mass) decreases the trailing edge flapping amplitude and increases the frequency. This trend has been verified in other studies (e.g. Alben & Shelley Reference Alben and Shelley2008; Shoele & Mittal Reference Shoele and Mittal2016b). The stabilizing effect of
 $M^{\ast }$ was found to be similar to the prediction from the linear stability analysis although the onset of stability is reduced to smaller
 $U^{\ast }$ range partially due to finite size effect of the flag and partially due to the change in the instability mode of the system from convective wave-type instability to absolute instability in negative
 $Ri$ and high
 $M^{\ast }$ cases. In the negative
 $Ri$ and high
 $M^{\ast }$ cases, the whole flag undergoes a bifurcation instability and as a result, the
 $U^{\ast }$ threshold of instability decreases an order of magnitude from its linear stability analysis prediction. The Strouhal number of the flapping case on the other hand is mostly affected by the
 $M^{\ast }$ and only for a large mass ratio (
 $M^{\ast }=10$) displays
 $Ri$ dependency.
It is observed that for the buoyancy opposed flow (solid line in figure 5), an increase in  $M^{\ast }$ not only decreases the flapping amplitude of unstable cases, but also decreases the onset of instability. The trend changes for the neutral and buoyancy aided flows (dashed and dotted line in figure 5). Here, the decrease in the flapping amplitude with the increase of
 $M^{\ast }$ is still present while for the intermediate
 $M^{\ast }$, a lower instability onset is calculated compared to other cases. This non-monotonic behaviour of instability threshold versus
 $M^{\ast }$ is associated with the time scales of the problems and the relative importance of flow inertial effects compared to the flag inertia (Alben & Shelley Reference Alben and Shelley2008; Eloy et al. Reference Eloy, Lagrange, Souilliez and Schouveiler2008). Comparing the neutral and buoyancy aided flows, it is found that the increase in
 $R$ slightly modifies the onset of instability of the flag by adjusting the mean convective time scale of accelerating flow near the boundary. In particular, it results in a reduction of the threshold on instability in lower
 $M^{\ast }$ cases and an increase of the critical instability
 $U^{\ast }$ for higher
 $M^{\ast }$ cases.
3.3 Vorticity field and phase diagram of thermal response
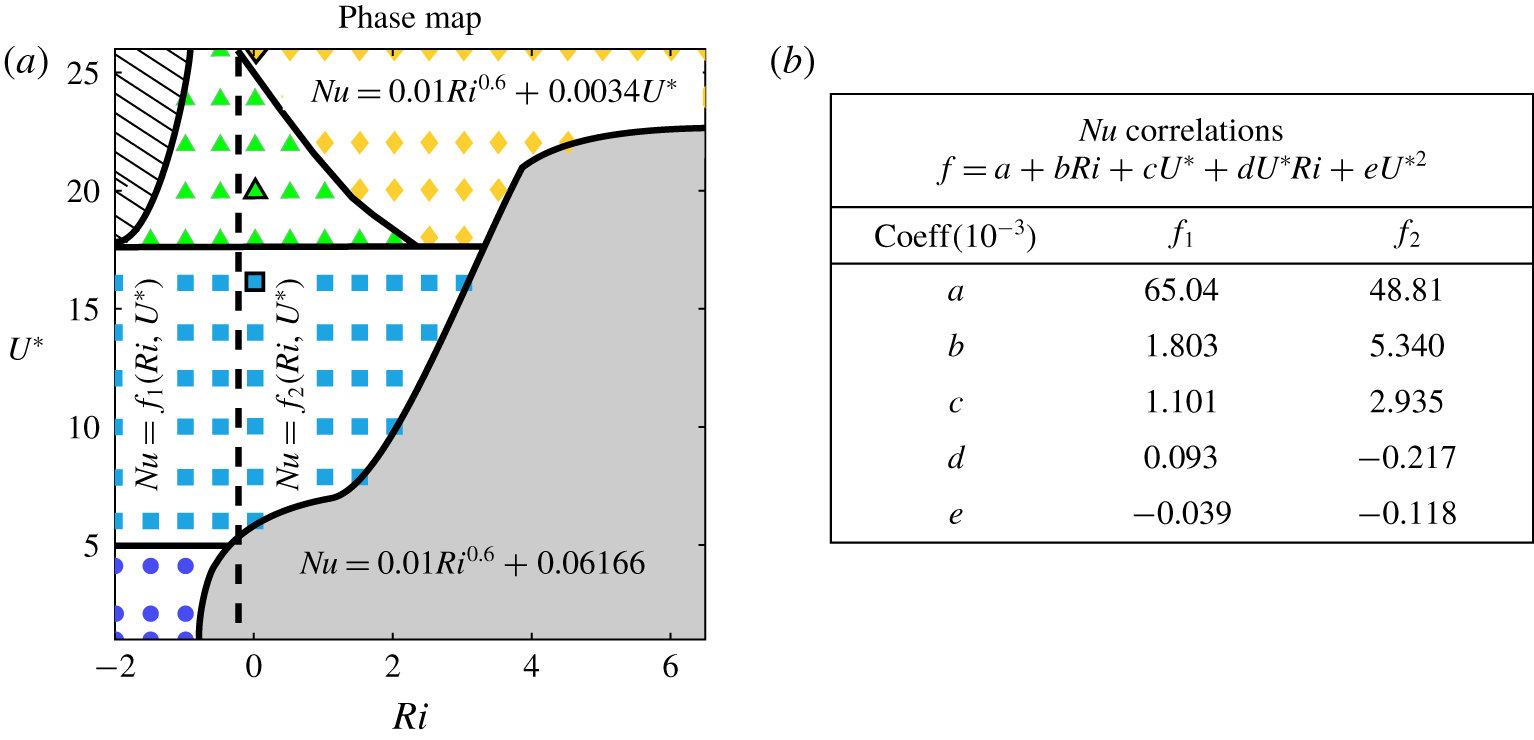
The response regimes as discussed in § 3.2 are reminiscent of previous observations in neutral flow conditions (Connell & Yue Reference Connell and Yue2007) although the thermal buoyancy modifies the amplitude and stability of the vibration. Within the limit cycle oscillation regime, there is a region in the  $Ri{-}U^{\ast }$ space with better thermal performance and higher
 $St$ attributed to the mode switching phenomenon. Different flapping regimes and their corresponding
 $Nu$ correlations are given in figure 6(a) with the colour showing the magnitude and different regimes of
 $Nu$. The region in the top left corner of figure 6(a) corresponds to a chaotic vibration response with no clear correlation for
 $Nu$, and the same is said for the transition mode ( ▲ (green)). Mode-1 (● (blue)) has a relatively constant and low
 $Nu$. The dependence of
 $Nu$ on
 $Ri$ (
 $Nu\propto Ri^{~0.6}$) is the same for the fixed state (grey) and mode-3 (♦ (yellow)) regions. This similarity is due to reduction of the flag’s overall motion in the mode-3 region. However,
 $Nu$ has a linear dependency on
 $U^{\ast }$ in the mode-3 region as the frequency of motion increases with
 $U^{\ast }$. In the region defined by mode-2 (▪ (baby blue)), the
 $Nu$ correlation is nonlinearly dependent on the
 $Ri$ and
 $U^{\ast }$. Moreover, it is found that the effects of
 $Ri$ and
 $U^{\ast }$ cannot be separated and the cross-correlation of these parameters, i.e. heat transfer induced by enhanced dynamic motion due to acceleration of the flow near the surface, remains important. Using Taylor’s expansion, it is determined that the first five terms (linear in
 $Ri$, quadratic in
 $U^{\ast }$ and the first cross-term
 $Ri\,U^{\ast }$) are sufficient to predict
 $Nu$ with a more than
 $99\,\%$ accuracy. There is, however, a difference between the negative and positive
 $Ri$ regions separated by a dashed line where the correlation coefficients change. An increase in
 $Nu$ and
 $St$ for
 $U^{\ast }>18$ are associated with the presence of new vibration modes. A
 $50\,\%$ enhancement in
 $Nu$ is observed mode-2 to mode-3 switch.
(a) The phase diagram depicting the different regimes of flapping and the corresponding  $Nu$ correlations. (b) The approximate
 $Nu$ expressions extracted from the Taylor expansion of nonlinear relation between heat flux and
 $U^{\ast }$ and
 $Ri$ in mode-2 (▪) being sufficient to represent the
 $Nu$ with at least
 $99\,\%$ accuracy.

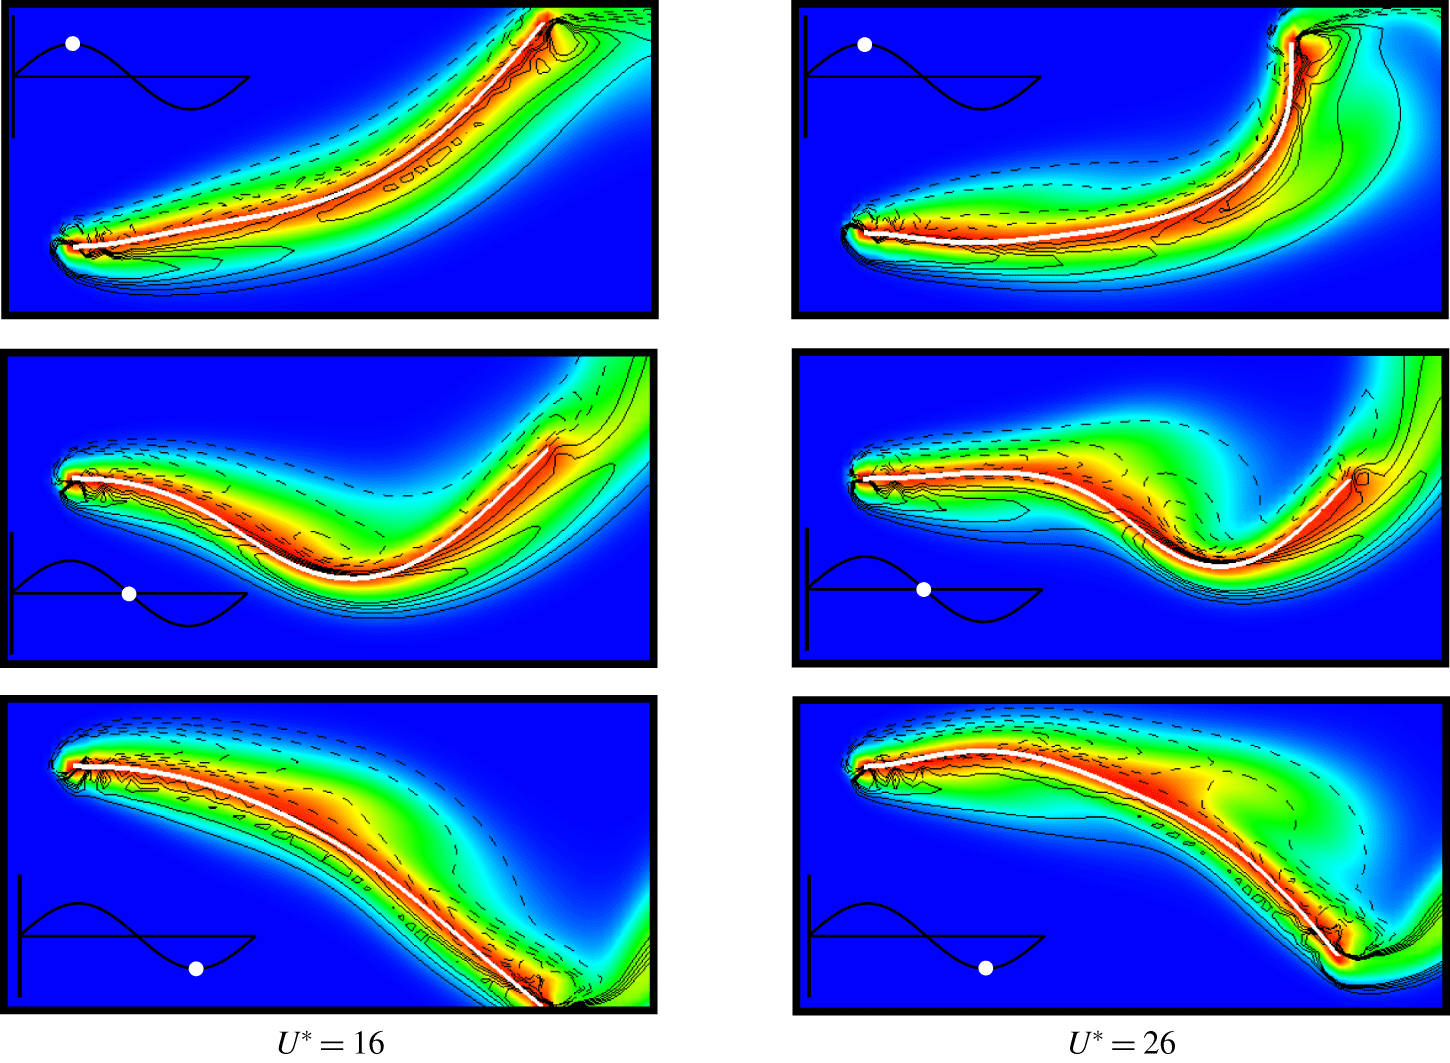
Instantaneous snapshots of vorticity contours (solid lines, positive; dashed lines, negative) and temperature distribution during the downstroke for  $Ri=0$ and
 $U^{\ast }=20,26$. The inset depicts the position of the trailing edge relative to its flapping period.

To further understand the effects of the mode switching on the heat transfer and flag dynamics, the instantaneous vorticity field, and temperature distribution at three instances during the flag’s half-cycle progression are shown in figure 7 for  $Ri=0$. The snapshots correspond to mode-2 (
 $U^{\ast }=16$) and mode-3 (
 $U^{\ast }=26$) flapping modes. In mode-2, a relatively constant thermal boundary layer (TBL) thickness is present throughout the flapping cycle while for mode-3, the boundary layer is characterized by the generation of coherent vortex structures around
 $L/2$ near the flag, seen in the middle snapshot. The two vortices on the top surface of the flag create a ‘jetting/wash-out’ of the TBL. This jetting causes the TBL to thin immediately downstream
 ${\sim}0.6L$, which corresponds to the increase in local
 $Nu$. Like mode-3, the transition mode also contains more nodes than mode-2. These extra nodes are the cause for intermediate vortex generation and separation along the flag’s surface and subsequent increase in the ‘washout’ effect. These vortices which are entrapping hot fluid from the TBL are then convected downstream into the wake thereby increasing the overall heat transfer.
4 Concluding remarks
The flow-induced fluttering of a flexible two-dimensional heated flag in the mixed convection regime is investigated over a range of Richardson numbers and reduced velocities. A linear stability analysis using the Pohlhausen–von Kármán boundary layer solution highlights the stabilizing effect expected from the buoyancy aided flow due to an increase in tension force proportional to  $Ri$. The stability analysis predicts the stability curve for critical
 $U^{\ast }$ as well as a separation point at
 $Ri\approx -0.5$.
A detailed computational study of the system confirms the predictions from the linear stability analysis, including the trend and asymptotic behaviour, and the point of instability due to the separation in the buoyancy opposed flow. The flapping amplitude and frequency are found to change substantially with  $Ri$ mainly through the mode switching behaviour that accounts for enhanced thermal performance. An increase in
 $U^{\ast }$ leads to a tension dominated system and therefore, greater sensitivity to the
 $Ri$ accelerated flow leading to higher modes. An interesting finding is related to the convoluted interconnected roles of flag inertia and buoyancy effects. While buoyancy effects for neutral and buoyancy aided flows primarily changes the onset of instability of the flag due to adjustment of the mean convective time scale of the flow, in the buoyancy opposed flow and heavy flags it induces global instability of the flag and much smaller instability threshold. It is shown that based on the thermal response of the flag, there are four periodic regimes, one transitional regime and one chaotic regime with a strong correlation to the flapping dynamics. The different mode regimes are separable based on
 $St$,
 $Ri$ and
 $U^{\ast }$ and these modes are connected to the role of vortex dynamics near the surface of the flag in its heat transfer performance.
This study provides insight into the coupling of fluid–thermal–structure interactions and shows that mode switching enhances the thermal response of vibrating compliant structures. It is argued that while sustained oscillation is related to synchronization of fluid and solid time clocks in neutral flow composed of the convection of the flow and the natural frequency of the structure, in the presence of a heated flag the acceleration or deceleration of the flow next to the structure disrupts this process and new dynamics emerge due to the competition between thermal, flow and solid phases. It is of interest to study the vortex generation and propagation from the surface of a deflecting flag and extend the observation to higher Reynolds number flows to investigate whether there are universal relations that delineate thermal response of a flexible plate at different conditions. These problems will be addressed in the future.
Declaration of interests
The authors report no conflict of interest.