1 Introduction
Turbulent flows are important in a variety of natural phenomena, industrial and civil applications. Their characteristic feature is the spontaneous development of intense and sporadic motions associated with extreme internal forces (Donzis & Sreenivasan Reference Donzis and Sreenivasan2010; Lesieur Reference Lesieur2011; Yeung, Zhai & Sreenivasan Reference Yeung, Zhai and Sreenivasan2015). ‘Extreme’ refers here to fluctuations that can deviate from the mean value by  $O(10)$ standard deviations. In engineering, the nature of such extreme dynamical events and their statistics are of crucial interest to predict excessive mechanical force, which can threaten the structural integrity of embedded structures (Kanev & van Engelen Reference Kanev and van Engelen2010).
From the viewpoint of chaotic dynamical systems, turbulence in fluids is linked to nonlinearity and strong departure from statistical equilibrium (Kraichnan & Chen Reference Kraichnan and Chen1989). The use of analytical perturbative methods in identifying resonant interactions (among degrees of freedom) responsible for extreme fluctuations is unsuccessful. Alternatively, simulation offers a practical approach to gain physical insight into these events, quantifying their intensity and estimating their frequency of occurrence. However, this requires very long simulations since these extreme events are rare. The computational cost for sampling a fluctuation of very small probability typically grows as the inverse of this probability (Wouters & Bouchet Reference Wouters and Bouchet2016). Rare-event sampling refers to a large body of methods that aim at preferentially exploring regions of phase space corresponding to events that would otherwise be accessed with a very low probability through a brute-force direct sampling. In the present work, a computational study of extreme mechanical force acting on an immersed bluff body is conducted using both very long time-series (direct sampling) and rare-event sampling techniques.
In fluid turbulence, rare-event sampling has been approached mainly from the perspective of simplified dynamics such as the one-dimensional Burgers’ equation with a stochastic forcing (Bec & Khanin Reference Bec and Khanin2007). In this case, the dynamics can be sampled by using a Markov chain Monte Carlo algorithm (Düben et al. Reference Düben, Homeier, Jansen, Mesterhazy, Münster and Urbach2008; Mesterházy & Jansen Reference Mesterházy and Jansen2011; Mesterházy et al. Reference Mesterházy, Biferale, Jansen and Tripiccione2013) that provides a framework for rare-event sampling. An alternative approach is based on instantons (Gurarie & Migdal Reference Gurarie and Migdal1996; Grafke, Grauer & Schäfer Reference Grafke, Grauer and Schäfer2015) and applies to stochastically driven systems in the limit of weak noise. Instantons refer to the most probable trajectories in phase space that achieve a given rare event (in the limit of weak noise). Suitable numerical schemes can be used to evaluate instantons as well as the related probabilities of rare events (Chernykh & Stepanov Reference Chernykh and Stepanov2001; Grafke, Grauer & Schäfer Reference Grafke, Grauer and Schäfer2013; Bouchet, Laurie & Zaboronski Reference Bouchet, Laurie and Zaboronski2014; Laurie & Bouchet Reference Laurie and Bouchet2015; Grigorio et al. Reference Grigorio, Bouchet, Pereira and Chevillard2017). An example is the investigation of the physics of rogue waves (Dematteis, Grafke & Vanden-Eijnden Reference Dematteis, Grafke and Vanden-Eijnden2018; Dematteis et al. Reference Dematteis, Grafke, Onorato and Vanden-Eijnden2019). However, a drawback of the aforementioned approaches is their limitation to simple and stochastically driven dynamics. Here, a more general approach is considered for complex, possibly deterministic, dynamical systems. It is based on sampling algorithms relying on selection rules applied to an ensemble of trajectories of the system. Even though such ideas date back to the early 1950s, they have received growing interest over the last twenty years with successful applications in various domains such as chemistry (van Erp & Bolhuis Reference van Erp and Bolhuis2005; Escobedo, Borrero & Araque Reference Escobedo, Borrero and Araque2009; Teo et al. Reference Teo, Mayne, Schulten and Lelièvre2016), biophysics (Huber & Kim Reference Huber and Kim1996; Bolhuis Reference Bolhuis2005; Zuckerman & Chong Reference Zuckerman and Chong2017), nuclear physics (Louvin, Dumonteil & Lelièvre Reference Louvin, Dumonteil and Lelièvre2017), nonlinear dynamical systems (Tailleur & Kurchan Reference Tailleur and Kurchan2007) and communication networks simulation (Villen-Altamirano & Villen-Altamirano Reference Villen-Altamirano and Villen-Altamirano1994). More importantly, such algorithms have been shown to be useful for the study of rare events in simple deterministic dynamics (Wouters & Bouchet Reference Wouters and Bouchet2016). Certainly, an original contribution of our study is to test the application of rare-event sampling algorithms in the context of far-from-equilibrium dynamics with an irreducible very large number of degrees of freedom. Two algorithms that are a priori suitable for such dynamics are considered, namely, the adaptive multilevel splitting (AMS) algorithm (Cérou & Guyader Reference Cérou and Guyader2007) and the Giardina–Kurchan–Tailleur–Lecomte (GKTL) algorithm (Giardinà, Kurchan & Peliti Reference Giardinà, Kurchan and Peliti2006). Another problem related to rare events is the estimation of parameters or statistics from a limited number of samples. Several authors have proposed original strategies (Mohamad & Sapsis Reference Mohamad and Sapsis2018; Blonigan, Farazmand & Sapsis Reference Blonigan, Farazmand and Sapsis2019) such as sequential sampling. These approaches and rare-event algorithms could also be considered for applications in wave–structure problems, ship motion and loads acting on offshore platforms (Belenky, Weems & Lin Reference Belenky, Weems and Lin2016). The paper is organized in two parts. The first part highlights the phenomenology of extreme fluctuations of the drag force acting on a square placed in a two-dimensional turbulent channel flow. This study is based on the simulation of the flow over a very long duration, made possible by the relative simplicity of the flow. The motivation for this study is twofold. Firstly, it provides a detailed description of the statistics and dynamics related to extreme drag fluctuations. This analysis is informative from the viewpoint of fluid mechanics and, to the best of our knowledge, has never been reported before. Secondly, it yields reference results that are required to validate the outputs of rare-event algorithms and to evaluate the possible computational gain obtained from them. This assessment is developed in the second part of the paper.
The flow set-up is introduced and the dynamics related to typical drag fluctuations is described in § 2. The statistical properties of the drag are then discussed. In § 3, the phenomenology of extreme drag fluctuations is investigated based on direct sampling. Both the instantaneous drag and time-averaged drag are considered. It is found in particular that sampled extreme fluctuations of the instantaneous drag result from a very similar dynamics. Section 4 examines the applicability of both the AMS and GKTL algorithms to the simulation of extreme drag fluctuations in the same flow configuration. In § 4.1, we show that the use of the AMS algorithm is not successful, or at least not straightforwardly. This difficulty is put into perspective with the phenomenology of extreme drag fluctuations developed in § 3. Subsection 4.2 presents the computation of extremes of the time-averaged drag by using the GKTL algorithm. This latter allows for an exceptional reduction of the computational cost needed to simulate trajectories corresponding to extreme values of the time-averaged drag. As a specific successful application, the GKTL algorithm is used to compute the return times of extreme fluctuations of the time-averaged drag acting on the immersed obstacle. Some perspectives and a conclusion end this work.
2 Description of the numerical case study
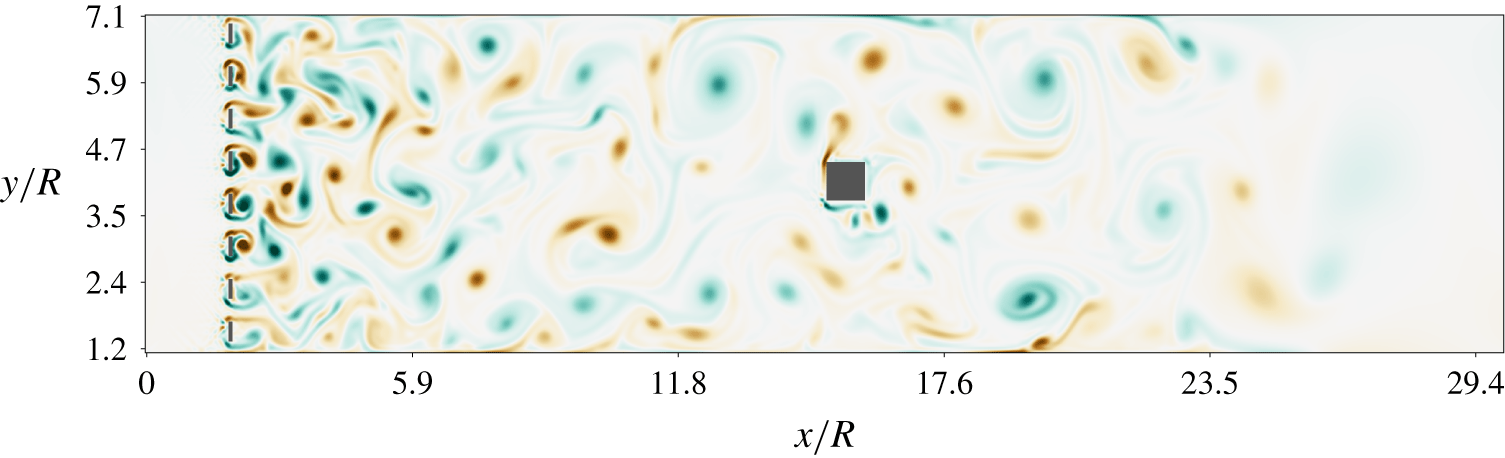
The drag exerted by a grid-generated turbulent flow onto a fixed squared obstacle is considered as a representative case study (see figure 1). Although real-world applications would eventually imply three-dimensional dynamics, a simplified two-dimensional setting has been chosen here to reduce the computational cost and allow for a systematic study. We believe that this system embeds the characteristic features that make this study both relevant and challenging for fluid–structure interaction problems.
Our case study is a grid-generated turbulent flow impinging onto a fixed squared obstacle (of size  $R$) located at the centre of a channel in two dimensions. The flow is artificially damped near the end of the channel. In the developed flow, turbulent eddies have typically the size of the square, which results in strong fluctuations of mechanical forces acting on the square. The vorticity is displayed with an arbitrary colour map from blue (negative values) to red (positive values).

Turbulent eddies generated in the near wake of the grid are carried downstream. They interact with each other and grow in size, as expected for two-dimensional turbulent dynamics. The dimension of the grid is such that the size of the eddies that hit the square is comparable to its size, resulting in strong fluctuations of the drag acting on the square. The flow dynamics is integrated numerically by the lattice Boltzmann method (LBM) (Krüger et al. Reference Krüger, Kusumaatmaja, Kuzmin, Shardt, Silva and Viggen2017). While traditional methods in computational fluid dynamics rely on a discretization of the Navier–Stokes equations, the LBM considers the fluid at an underlying mesoscopic level. Capturing the dynamics of collections of fluid particles moving and colliding on a lattice is here preferred to solving nonlinear partial differential equations (PDEs). Further details about the LBM are given in appendix A and references therein. In our context, this numerical method has been chosen principally for its computational efficiency.
The simulated flow develops in a long plane channel of dimension 513 × 129 mesh points. The square obstacle has size  $R=16$ (in mesh units) and is located at the centre of the channel. The spacing and bar height of the entrance grid are both equal to
 $R/2$ (see figure 1). No-slip boundary conditions are enforced on top and bottom walls of the channel and on the surface of the obstacle by using a half-way bounce-back procedure (Sukop & Thorne Reference Sukop and Thorne2006). Upstream of the grid, a constant parabolic velocity profile and a constant mass density (equal to unity) are imposed as an inlet condition. The centreline velocity is 0.05 in lattice units, i.e. normalized by
 $\unicode[STIX]{x0394}x$ and
 $\unicode[STIX]{x0394}t$ referring to the lattice resolution and the time step, respectively. The initial distributions are imposed at equilibrium (see appendix A). In the bulk, the viscosity is adjusted so that grid turbulence is generated with Reynolds number
 $Re_{grid}=1200$. The reference Mach number is equal to 0.06, in agreement with the assumption of weak compressibility of the LBM. Near the end of the channel, the flow is progressively damped within a sponge zone where the viscosity is artificially enhanced. Finally, the outlet boundary condition relies on a second-order extrapolation of the velocity and mass density. The extrapolated distributions are evaluated through a regularization procedure relying on a finite difference estimation of the local stress tensor, as introduced in Latt et al. (Reference Latt, Chopard, Malaspinas, Deville and Michler2008). For more details about the implementation of the flow, see the software repository attached to this paper (https://github.com/tlestang/paper_extreme_drag_fluctuations).
2.1 The drag force
The incoming turbulent flow exerts fluctuating mechanical force on the squared obstacle. The drag is defined as the resulting force in the streamwise  $x$-direction. Formally
 $$\begin{eqnarray}f_{d}(t)=\int _{{\mathcal{S}}}\unicode[STIX]{x1D749}_{x\unicode[STIX]{x1D6FD}}(\boldsymbol{x},t)\,\text{d}{\mathcal{S}}_{\unicode[STIX]{x1D6FD}}(\boldsymbol{x}),\end{eqnarray}$$
where  ${\mathcal{S}}$ is the surface of the obstacle and
 $\unicode[STIX]{x1D749}$ denotes the stress tensor (see appendix A). Here, the viscous stress makes a negligible contribution to the drag. The latter therefore results mostly from pressure forces. Since the pressure on the top and bottom sides of the square applies in the normal direction, it does not contribute to the drag. As a consequence, the drag can eventually be expressed as the difference
 $$\begin{eqnarray}f_{d}(t)=p_{fb}(t)-p_{base}(t)\end{eqnarray}$$
between the pressure integrated over the upstream side of the obstacle or forebody,  $p_{fb}(t)$, and the downstream side or base,
 $p_{base}(t)$. Pressure fluctuations are related to the dynamics of the vorticity field. Regions of strong vorticity correspond to strong local pressure gradients, e.g. as demonstrated analytically with a Rankine vortex.
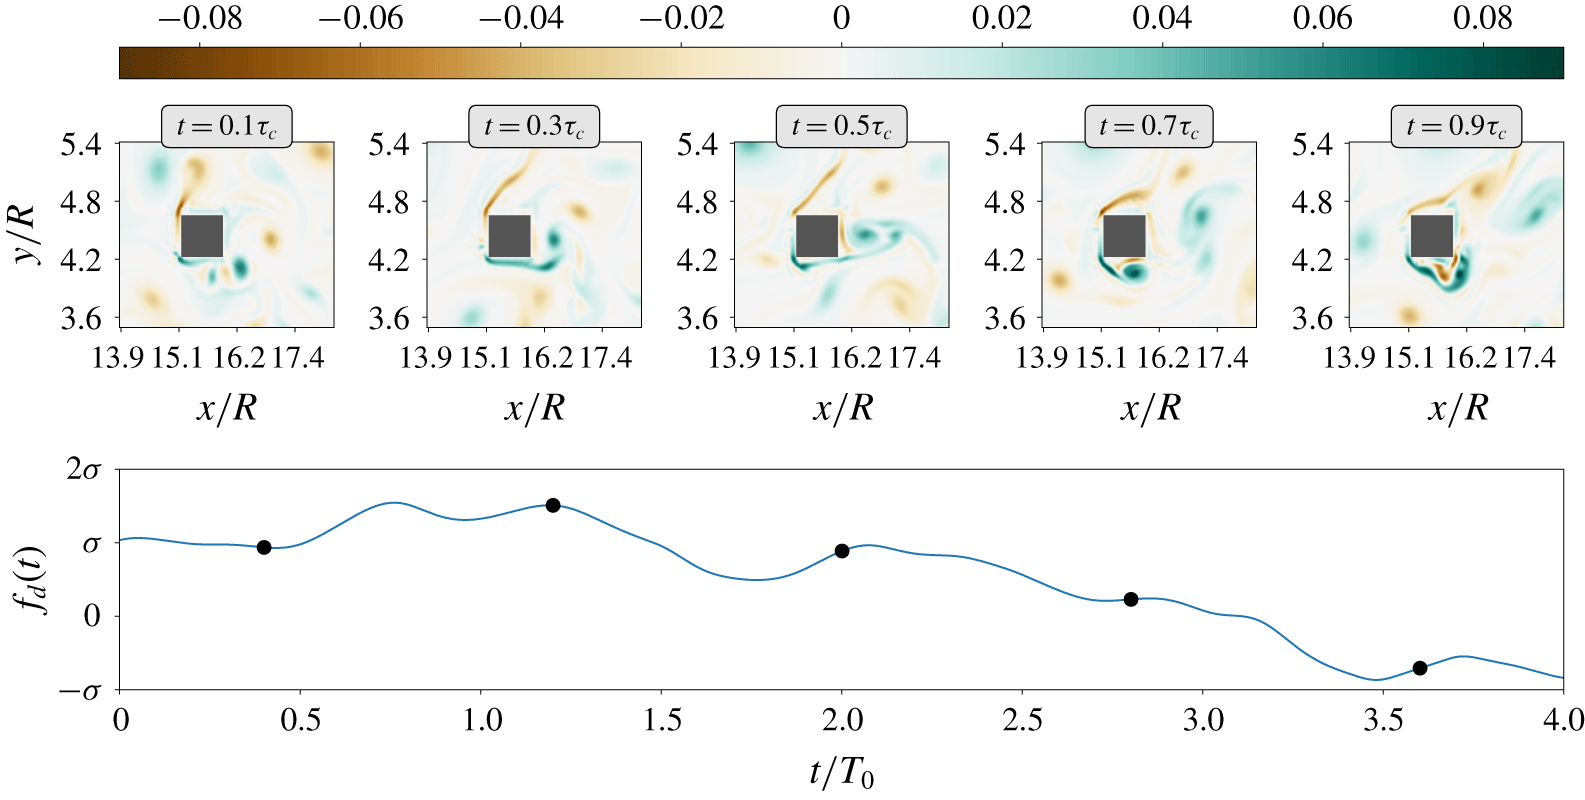
Snapshots of the vorticity related to typical drag fluctuations (within one standard deviation) over a time interval of length  $\unicode[STIX]{x1D70F}_{c}\simeq 4T_{0}$;
 $\unicode[STIX]{x1D70F}_{c}$ will later be identified as the correlation time of the drag signal. The vorticity is given in lattice units.

The typical time scale (turnover time) of drag fluctuations can be estimated from dimensional analysis as
 $$\begin{eqnarray}T_{0}=\frac{R}{U},\end{eqnarray}$$
where  $R$ is the size of the square and
 $U$ is the averaged velocity in the channel. Figure 2 displays the evolution of the vorticity field around the obstacle for typical drag fluctuations. Vorticity is generated along the forebody and eventually carried away by the flow. Typical fluctuations of the drag (within one standard deviation) do not result from some preferred arrangement of the vorticity around the obstacle.
2.2 The drag as a random process
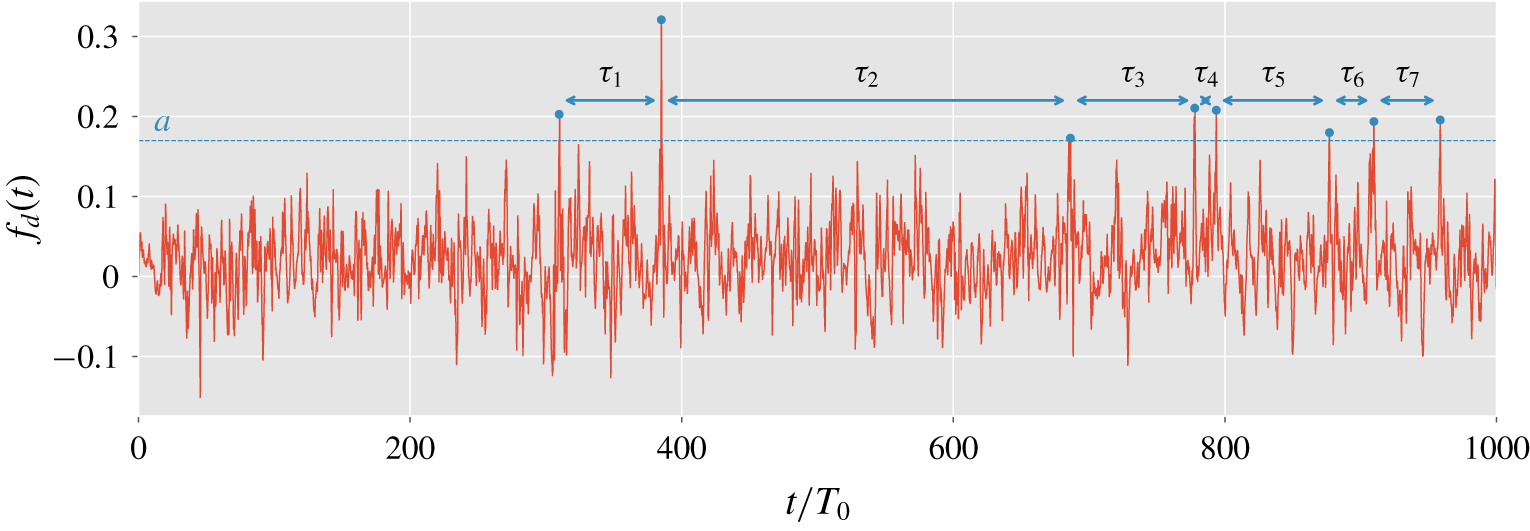
In figure 3, the time signal of the drag acting on the square,  $f_{d}(t)$, appears unpredictable in detail and exhibits repeated bursts of high amplitude that deviate significantly from the averaged value. Therefore, it is natural to model the drag as a (scalar) random process.
Temporal evolution of the drag (in lattice units) acting on the square under the action of the impinging turbulent flow. The time has been normalized by the turnover time related to the mean-flow velocity and the size of the obstacle, i.e.  $T_{0}=R/U$. The return time
 $r(a)$ is the averaged waiting time between the occurrence of peak fluctuations of amplitude larger than
 $a$. If the threshold
 $a$ is sufficiently high, one observes that
 $r(a)$ is much larger than the correlation time of the signal. The selected peak fluctuations are therefore well separated.

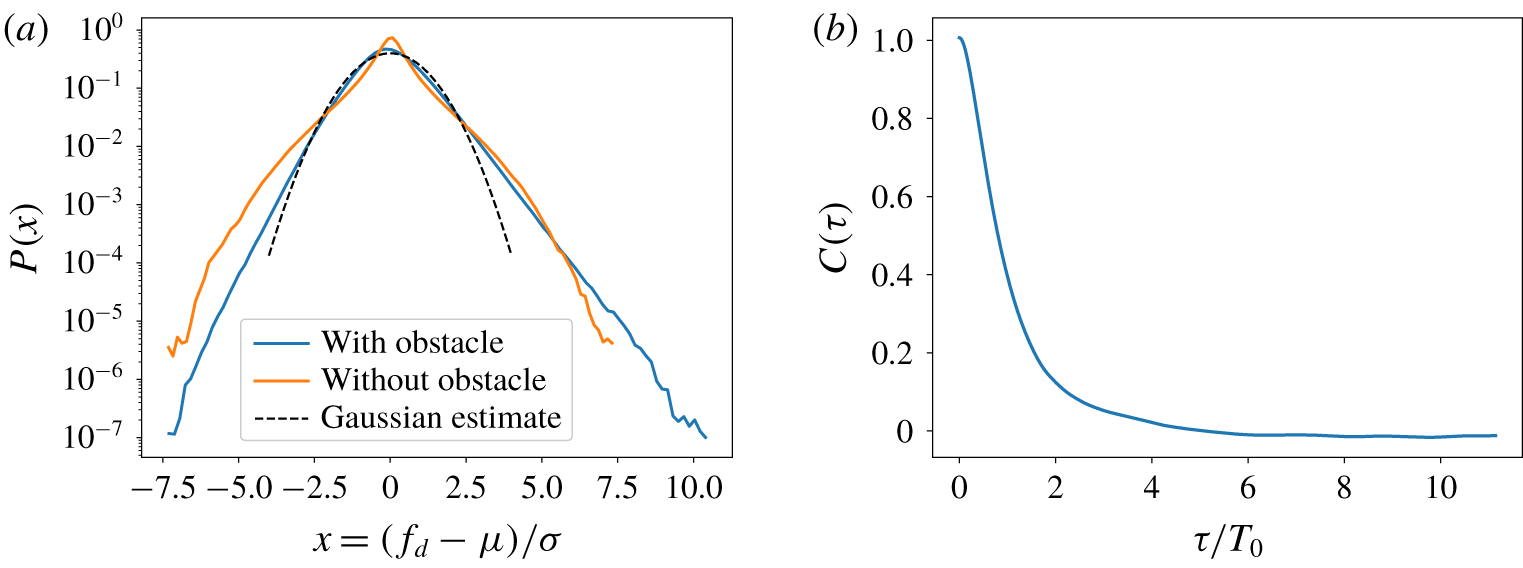
Drag fluctuations have been sampled along a simulation of duration  $T_{tot}=4\times 10^{6}~T_{0}$. This long simulation will be referred to as the control run in the following. It has been made possible by the relative simplicity of the investigated flow and the computational efficiency of the LBM. The probability density function (PDF) of drag fluctuations is shown in figure 4(a). It deviates from a normal law and shows an exponential tail for large positive fluctuations, i.e.
 $\mathbb{P}(f_{d})\propto \text{e}^{-\ell f_{d}}$. Figure 4(a) also displays the PDF of drag fluctuations acting on a control surface corresponding to the periphery of the obstacle but in the absence of the obstacle. In that case, the PDF is quasi-symmetric and does not display exponential tails. This shows that the asymmetry of the PDF and the development of a positive exponential tail are closely related to the no-slip condition on the obstacle boundary.
(a) The PDF of normalized drag fluctuations ( $\tilde{f}_{d}=f_{d}-\bar{f_{d}}$) where
 $\unicode[STIX]{x1D707}=\bar{f_{d}}$ denotes the time-averaged value and
 $\unicode[STIX]{x1D70E}=\sqrt{\overline{{\tilde{f}_{d}}^{2}}}$ is the standard deviation. The drag is evaluated both in the presence (blue) and in the absence (red) of the obstacle. (b) Autocorrelation function of the drag defined as
 $C(\unicode[STIX]{x1D70F})=\overline{\tilde{f}_{d}(t+\unicode[STIX]{x1D70F})\tilde{f}_{d}(t)}/\overline{{\tilde{f}_{d}}^{2}}$. The correlation time
 $\unicode[STIX]{x1D70F}_{c}\simeq 4T_{0}$ is given by
 $C(\unicode[STIX]{x1D70F}_{c})=0$.

Lastly, the autocorrelation function of the drag  $C(\unicode[STIX]{x1D70F})$ is shown in figure 4(b). It is found that drag fluctuations are correlated over a time interval
 $\unicode[STIX]{x1D70F}_{c}\simeq 4T_{0}$, illustrating that the drag loses its memory over a time scale corresponding to the sweeping of a few eddies past the obstacle. This observation is important for the application of rare-event algorithms as will be discussed in § 4. In the following,
 $\unicode[STIX]{x1D70F}_{c}$ will be referred to as the correlation time of the drag process. The ratio
 $T_{0}/\unicode[STIX]{x1D70F}_{c}$ may be viewed as a Strouhal number. The value
 $St=0.25$ is consistent with common observations for flows past blunt structures at comparable Reynolds numbers (Rodi Reference Rodi1998).
3 Extreme fluctuations of the drag by means of direct sampling
The phenomenology of extreme fluctuations of the drag is first investigated through brute-force direct sampling applied to the control run. Direct sampling is here used as opposed to approaches involving rare-event algorithms discussed in § 4. It will provide a trustworthy baseline for the validation of rare-event algorithms.
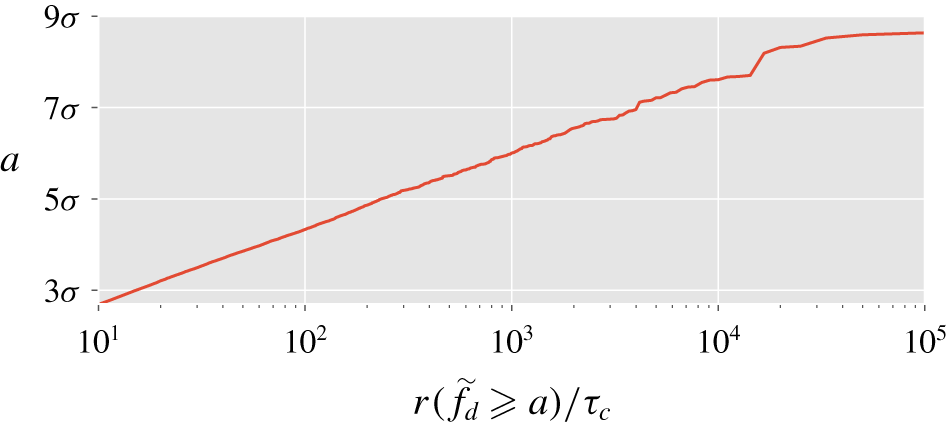
Amplitude of drag fluctuations as a function of the corresponding return time.  $\tilde{f}_{d}$ denotes the drag with zero mean, i.e.
 $\tilde{f}_{d}=f_{d}-\overline{f_{d}}$.

The waiting times  $\unicode[STIX]{x1D70F}$ are defined as the time between two consecutive occurrences of peak fluctuations with amplitude
 $f_{d}\geqslant a$, as illustrated in figure 3. The mixing time
 $\unicode[STIX]{x1D70F}_{m}$ is the time needed for the dynamics to lose the memory of its initial condition. As soon as the typical waiting times are much larger than the mixing time
 $\unicode[STIX]{x1D70F}_{m}$, the occurrences of such events follow a Poisson process and the distribution of the waiting times is exponential, i.e.
 $P(\unicode[STIX]{x1D70F})=\unicode[STIX]{x1D706}(a)\exp (-\unicode[STIX]{x1D706}(a)\unicode[STIX]{x1D70F})$ where
 $r(a)=1/\unicode[STIX]{x1D706}(a)$ is the averaged waiting time (Lestang et al. Reference Lestang, Ragone, Bréhier, Herbert and Bouchet2018);
 $r(a)$ is called the return time of the level
 $a$. For systems without multi-stability, it is common for the mixing time
 $\unicode[STIX]{x1D70F}_{m}$ to be of the order of the correlation time
 $\unicode[STIX]{x1D70F}_{c}$.
The rarity of a fluctuation  $a$ is quantified by the return time
 $r(a)$. We can define extreme drag fluctuations as rare events in the sense that the return time is much larger than the correlation time, i.e.
 $r(a)\gg \unicode[STIX]{x1D70F}_{c}$.
If one assumes that  $r(a)=t(a)/\mathbb{P}(f_{d}\geqslant a)$ where the time scale
 $t(a)$ is of order
 $\unicode[STIX]{x1D70F}_{c}$ and varies much more slowly with
 $a$ than
 $\mathbb{P}(f_{d}\geqslant a)$, one might expect that
 $$\begin{eqnarray}r(a)\underset{a\rightarrow \infty }{\propto }\exp (\ell a),\end{eqnarray}$$
where  $l$ is the rate describing the positive tail of the PDF of the drag (shown in figure 4). Figure 5 shows the evolution of the return time
 $r(a)$ with the amplitude of fluctuation
 $a$, computed from direct sampling of the drag signal
 $f_{d}(t)$ (Lestang et al. Reference Lestang, Ragone, Bréhier, Herbert and Bouchet2018). Consistently, it is found that the return time
 $r(a)$ is well approximated by an exponential for large levels
 $a$. Let us also point out some deviation from the exponential law at the largest levels, which is probably the consequence of under-sampling.
3.1 Extracting extreme drag fluctuations from a very long time series
We have extracted the fluctuations of the drag with a return time  $r(a)$ greater than
 $10^{4}\unicode[STIX]{x1D70F}_{c}$ from the control time series
 $\{\,f_{d}(t)\}_{0\leqslant t\leqslant T_{tot}}$. This set will be considered as representative of extreme events in the upcoming study. The choice of this particular threshold has been driven by the need to collect enough events with large amplitude and to possibly identify generic features. According to figure 5, the related amplitude
 $a$ is found equal to
 $7.6\unicode[STIX]{x1D70E}$ with
 $\unicode[STIX]{x1D70E}=\sqrt{\overline{\tilde{f_{d}}^{2}}}$ being the standard deviation of the drag process, where
 $\tilde{f_{d}}$ denotes the drag with zero mean, i.e.
 $\tilde{f}_{d}=f_{d}-\overline{f_{d}}$. Precisely, 104 independent fluctuations with
 $\tilde{f}_{d}(t)\geqslant 7.6\unicode[STIX]{x1D70E}$ have been identified. Each fluctuation is characterized by its maximal value,
 $f_{d}^{\star }$, and the time,
 $t^{\star }$, at which this maximum is reached. In the following, the phenomenology of extreme drag fluctuations will be examined on the basis of this set of events.
3.2 Extreme fluctuations of the instantaneous drag
3.2.1 Contribution of forebody and base pressure fluctuations to the overall drag fluctuation
In § 2, it was pointed out that drag fluctuations within one standard deviation were not associated with any particular arrangement of the vorticity around the obstacle. We shall see in the following that the situation is different in the case of extreme drag fluctuations. Let  $(t^{\star },f_{d}^{\star })$ refer to an extreme-drag event. The (zero-mean) fluctuation
 $\tilde{f}_{d}^{\star }=f_{d}^{\star }-\overline{f_{d}}$ can be decomposed into
 $$\begin{eqnarray}\tilde{f}_{d}^{\star }=\unicode[STIX]{x0394}p_{fb}^{\star }-\unicode[STIX]{x0394}p_{base}^{\star },\end{eqnarray}$$
where  $\unicode[STIX]{x0394}p_{fb}^{\star }$ and
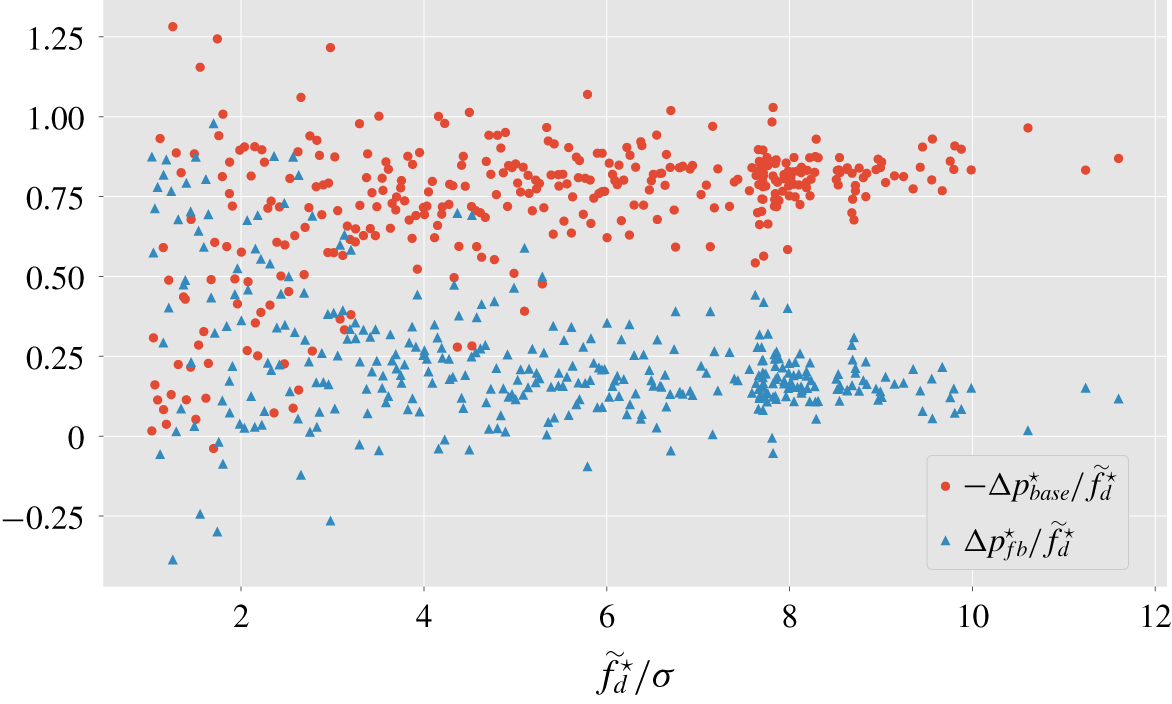
 $\unicode[STIX]{x0394}p_{base}^{\star }$ denote the variations of the forebody and base pressure, respectively. Figure 6 displays the relative contributions
 $\unicode[STIX]{x0394}p_{fb}^{\star }/\tilde{f}_{d}^{\star }$ and
 $-\unicode[STIX]{x0394}p_{base}^{\star }/\tilde{f}_{d}^{\star }$ to the drag fluctuation
 $\tilde{f}_{d}^{\star }$. It is found that very large fluctuations of the drag result mainly (∼80 %) from a drop in base pressure, whereas the variation of forebody pressure contributes much less to
 $\tilde{f}_{d}^{\star }$. On the contrary, moderate fluctuations arise from combined variations of the forebody and base pressures without any particular predominance, which is in agreement with the previous observations (see figure 2).
Relative contributions of the forebody and base pressure variations to extreme amplitudes of the drag fluctuation  $\tilde{f}_{d}$. An extreme event corresponds to an amplitude
 $\tilde{f}_{d}^{\star }$ and a unique pair (
 $\tilde{p}_{base}^{\star }$,
 $\tilde{p}_{fb}^{\star }$).

3.2.2 Fluid dynamics related to extreme drag fluctuations
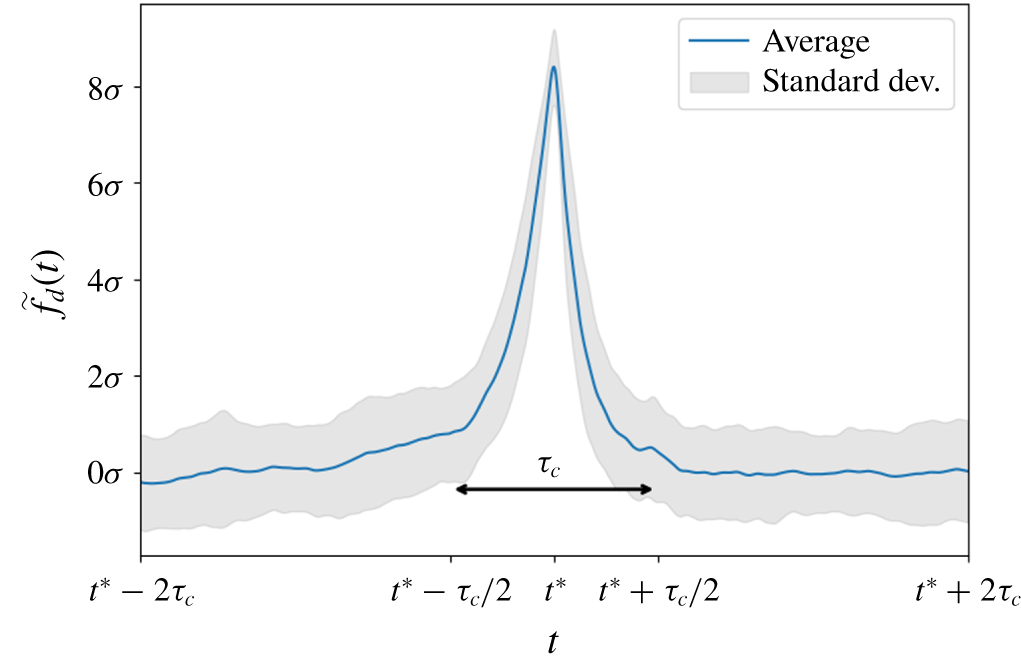
The focus is now on the flow scenarios that yield extreme values of the drag. Figure 7 displays the mean profile (in time) of the drag signal around extreme events. A peaked profile is observed with a width roughly corresponding to one correlation time  $\unicode[STIX]{x1D70F}_{c}$. This shows that the duration of extreme events corresponds typically to the sweeping time of the flow past the obstacle. Interestingly, the profile is also slightly skewed, indicating that the step up of the drag is slower than the return to typical values past the peak value. This asymmetry (under time reversal) is closely linked to the symmetry breaking in what happens before and after the obstacle. To better understand the flow scenarios leading to these events, the vorticity fields around the obstacle are now examined.
Ensemble average of drag signals centred around extreme fluctuations occurring at  $t=t^{\star }$. The blue line shows the mean profile whereas the shaded area indicates variations (around the mean profile) within one standard deviation. Extreme-drag events exhibit a typical lifetime of one correlation time
 $\unicode[STIX]{x1D70F}_{c}$. The profile is slightly skewed indicating that the step up is slower than the return to typical values.

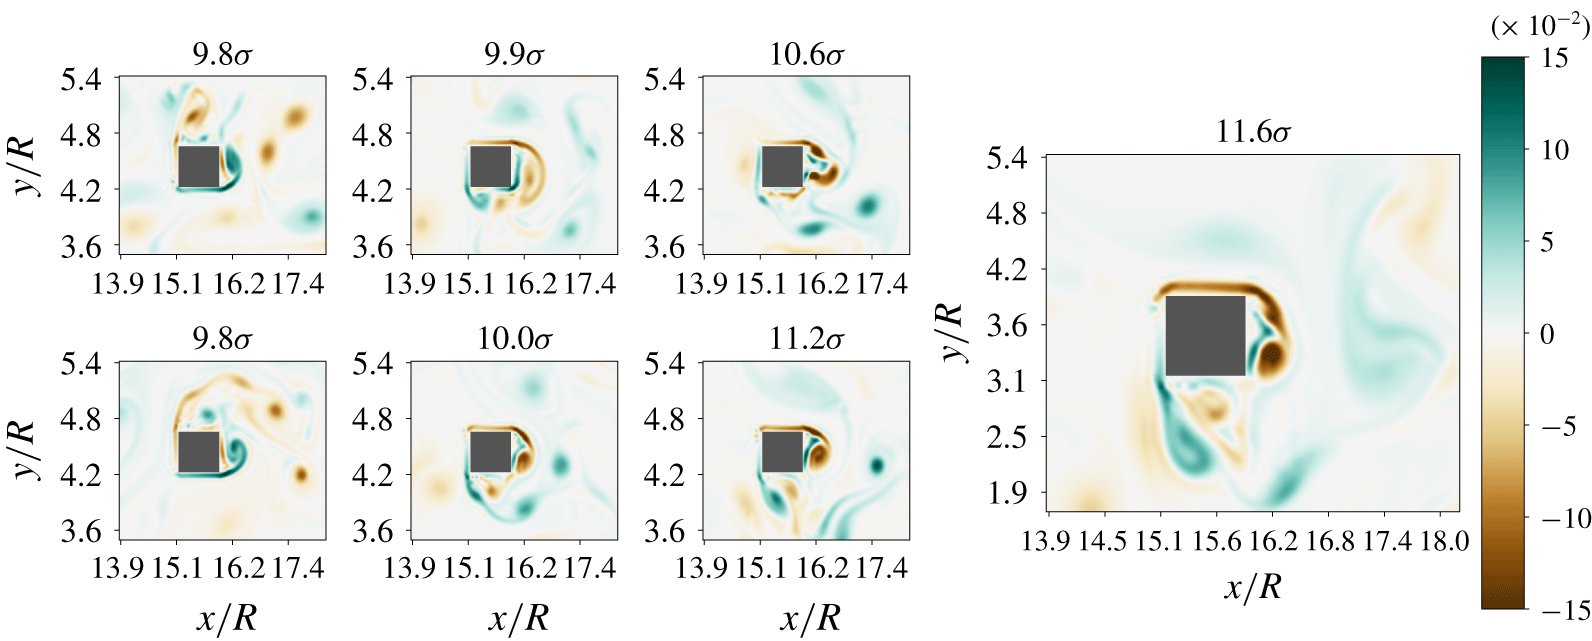
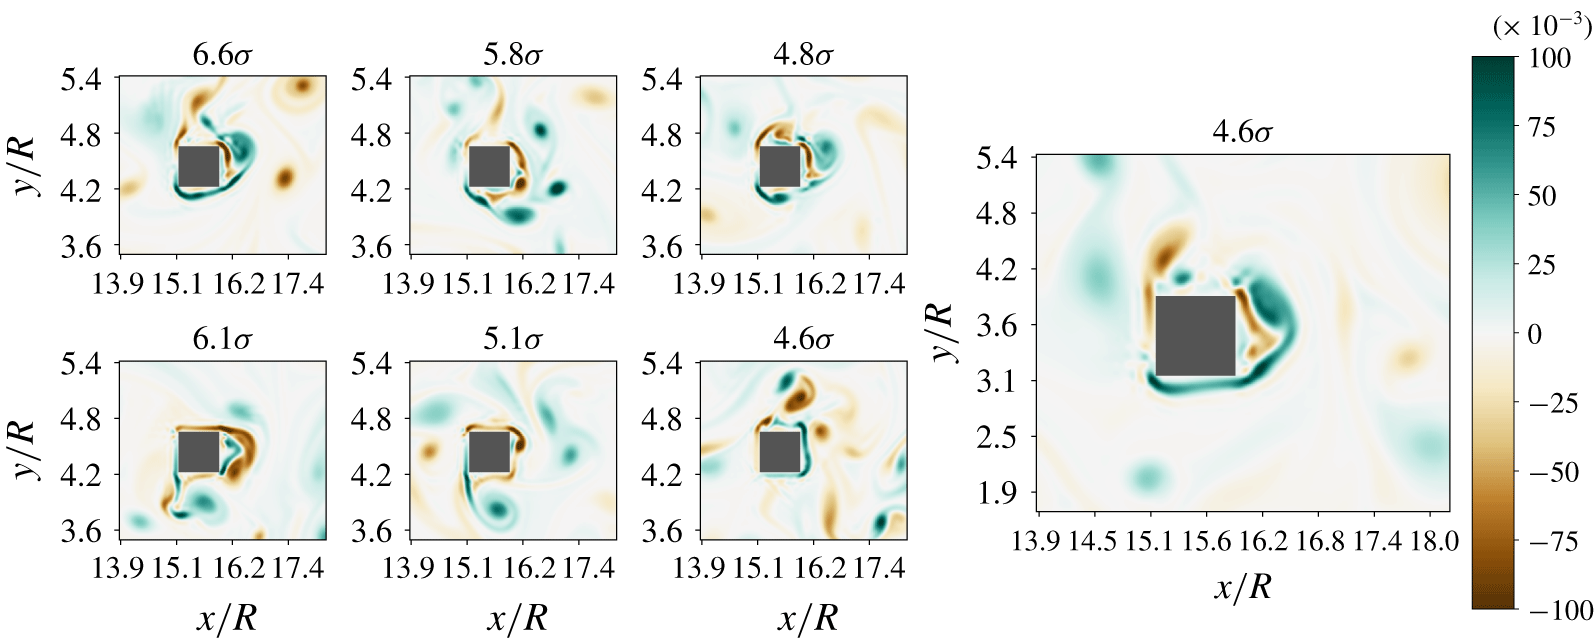
Vorticity field (in lattice units) around the obstacle at  $t=t^{\star }$ for the highest drag amplitudes recorded in the control run.

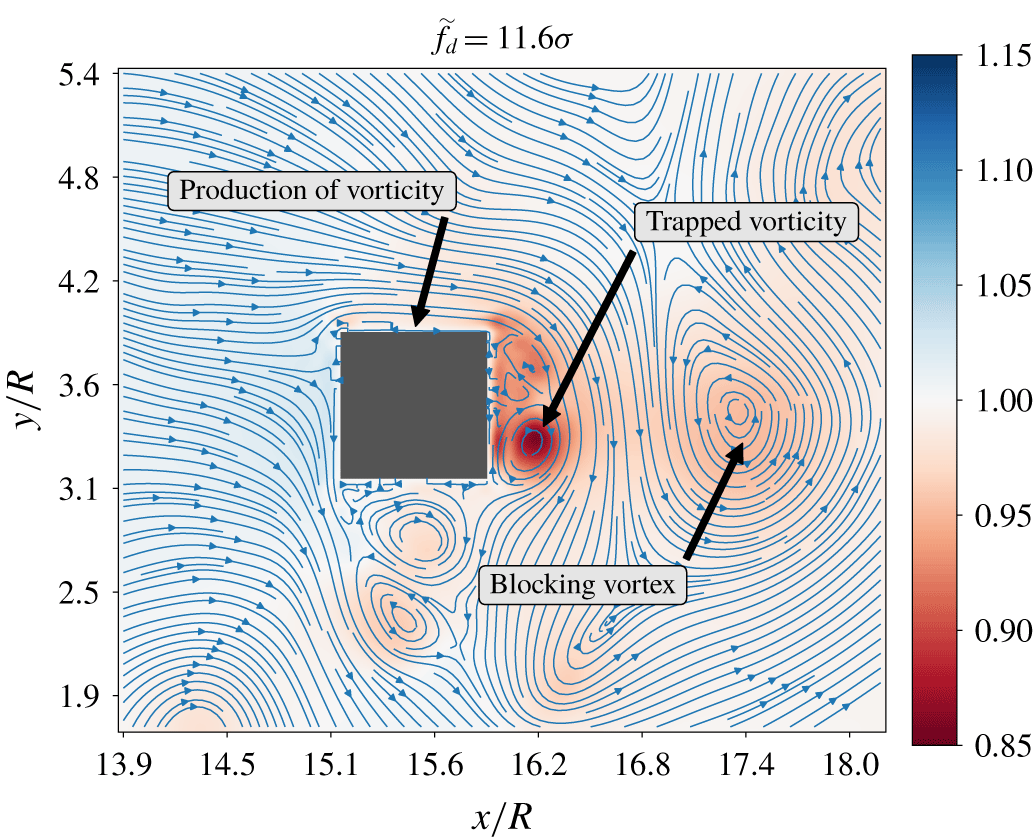
Pressure field (in lattice units) and velocity streamlines at  $t=t^{\star }$. In the near wake of the square, a (blocking) vortex blocks an intense vortex against the base of the obstacle.

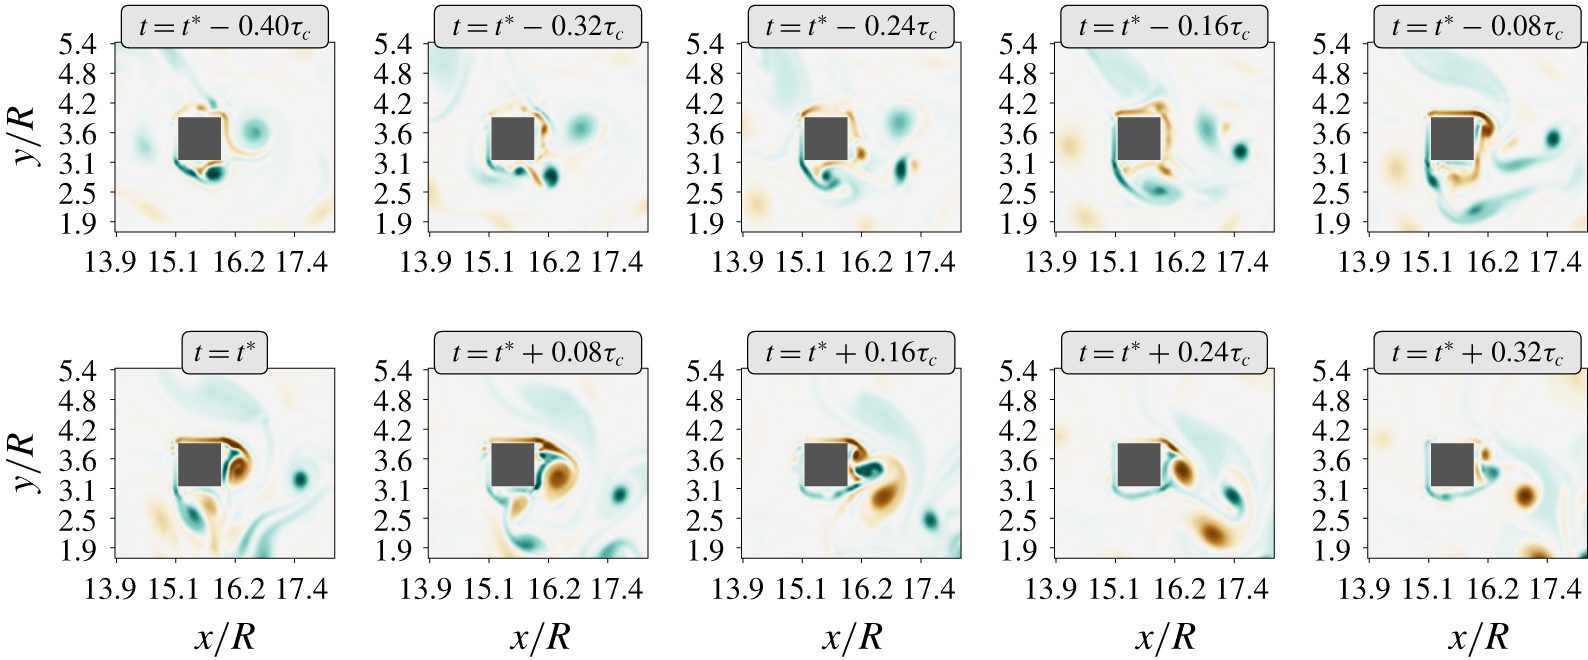
Snapshots of the vorticity field (in lattice units) around  $t=t^{\star }$.

Figure 8 displays the vorticity field (in lattice units) around the obstacle for the highest amplitudes of the drag during the control run. In each case, an intense vortical structure is visible near the base of the obstacle. The vorticity level of this structure is typically twice the amplitude of typical vorticity fluctuations observed in figure 2. The formation of this vortex originates from an intense negative (or positive) vorticity layer at the top (or bottom) boundary of the obstacle. This high vorticity is responsible for a significant pressure drop at the base of the obstacle and therefore a strong drag. In contrast, nothing special happens near the forebody of the obstacle during extreme-drag events.
The high pressure drop near the base of the obstacle appears to be closely related to the presence of a strong vortex blocked against the base. As illustrated in figure 9, this blockage is enforced by the presence of opposite vorticity in the near wake, which holds the vortex against the base of the obstacle and prevents it from being swept away for a while. This scenario is better evidenced by figure 10, where the time history of the vorticity field around  $t=t^{\star }$ for the same event is shown. Before the occurrence of the extreme event, positive vorticity originating from the bottom boundary layer develops in the near wake of the square. This positive vorticity prevents the shedding of negative vorticity and enforces the development of an intense vortex against the base of the square. As the blocking vortex is in turn advected downstream, the vortex against the base is released. Consistently, one can argue that the typical duration of this scenario is related to the sweeping time of the flow past the obstacle, and is therefore of the order of
 $\unicode[STIX]{x1D70F}_{c}$. This is in full agreement with the typical duration obtained from statistical consideration on the mean profile of large-drag fluctuations in figure 7. This scenario is generic and has been observed for most extreme events sampled in the control run.
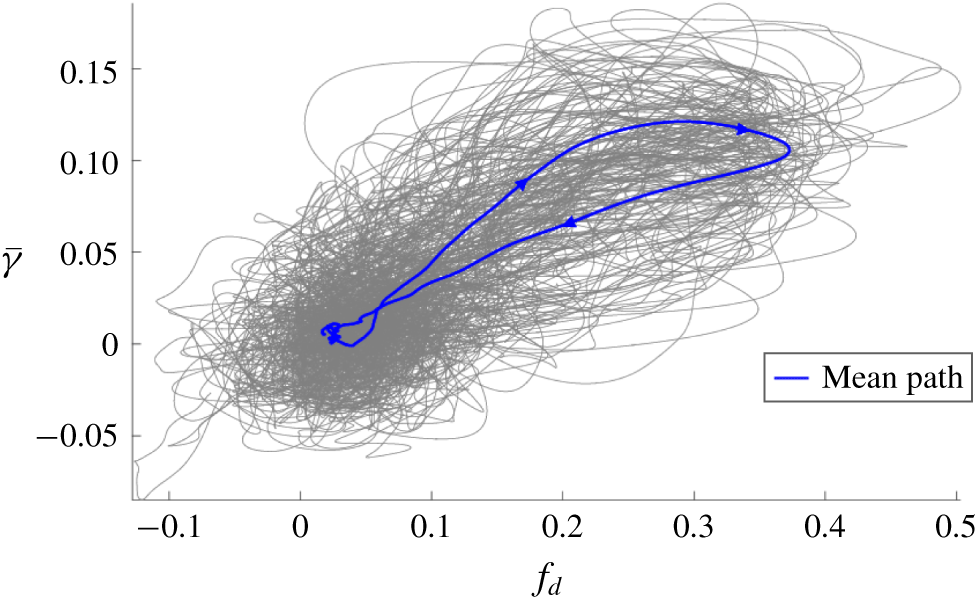
Evolution of the (integrated) shear along the top or bottom of the obstacle as a function of the drag for  $t^{\star }-2\unicode[STIX]{x1D70F}_{c}\leqslant t\leqslant t^{\star }+2\unicode[STIX]{x1D70F}_{c}$. Each trajectory corresponds to a single event. The blue line is the mean path averaged over the set of extreme events sampled in the control run.

Since the occurrence of large drag amplitudes arises from the production of vorticity along the top or bottom of the square, it is proposed to characterize the dynamics of extreme events by their trajectory in the parameter space  $(f_{d}(t),\bar{\unicode[STIX]{x1D6FE}}(t))$ where
 $\bar{\unicode[STIX]{x1D6FE}}(t)$ is the averaged shear along the top or bottom boundary of the square
 $$\begin{eqnarray}\overline{\unicode[STIX]{x1D6FE}}=\frac{1}{R}\int _{{\mathcal{S}}_{\Vert }}\frac{\unicode[STIX]{x2202}u(\boldsymbol{x})}{\unicode[STIX]{x2202}y}\,\text{d}\boldsymbol{x},\end{eqnarray}$$
where  $R$ denotes the size of the square,
 $u$ is the streamwise component of the velocity field and
 ${\mathcal{S}}_{\Vert }$ is the surface of either the top or the bottom boundary. Figure 11 shows
 $\overline{\unicode[STIX]{x1D6FE}}(t)$ as a function of the instantaneous drag
 $f_{d}(t)$ for
 $t^{\star }-2\unicode[STIX]{x1D70F}_{c}\leqslant t\leqslant t^{\star }+2\unicode[STIX]{x1D70F}_{c}$ for the 104 sampled extreme events. Before and after the extremal fluctuation, i.e. for
 $t^{\star }-2\unicode[STIX]{x1D70F}_{c}\leqslant t\leqslant t^{\star }-\unicode[STIX]{x1D70F}_{c}$ and
 $t^{\star }+\unicode[STIX]{x1D70F}_{c}\leqslant t\leqslant t^{\star }+2\unicode[STIX]{x1D70F}_{c}$, paths wander in a region related to typical values of both
 $\overline{\unicode[STIX]{x1D6FE}}$ and
 $f_{d}$. On the contrary, the drag abruptly varies for
 $t^{\star }-\unicode[STIX]{x1D70F}_{c}\leqslant t\leqslant t^{\star }+\unicode[STIX]{x1D70F}_{c}$ near the extremal amplitude. These excursions always go clockwise, that is,
 $\overline{\unicode[STIX]{x1D6FE}}$ attains its maximum value before
 $f_{d}$ does. This is consistent with an increase of
 $\overline{\unicode[STIX]{x1D6FE}}$ acting as a precursor for extreme drag fluctuations. In this representation, we also observe that the path related to the increase of the drag is longer than the path related to the return to typical values, which may be related to the asymmetry of the mean profile displayed in figure 7.
3.3 Extreme fluctuations of the time-averaged drag
We discussed previously the phenomenology of extreme fluctuations of the instantaneous drag, and identified the sweeping time of the flow past the obstacle as the characteristic lifetime of these events. In applications, this duration may be much smaller than the response time of the material structure subject to these fluctuations, justifying a practical interest in the averaged (in time) drag force. Therefore, another relevant observable is the time-averaged drag defined as
 $$\begin{eqnarray}F_{T}(t)=\frac{1}{T}\int _{t}^{t+T}f_{d}(t)\,\text{d}t,\end{eqnarray}$$
where  $f_{d}(t)$ denotes the instantaneous drag and
 $T$ is the investigated time scale (response time). In the following, we shall consider
 $T=10\unicode[STIX]{x1D70F}_{c}$, where
 $\unicode[STIX]{x1D70F}_{c}$ is the correlation time of the instantaneous drag. In that case, the PDF of
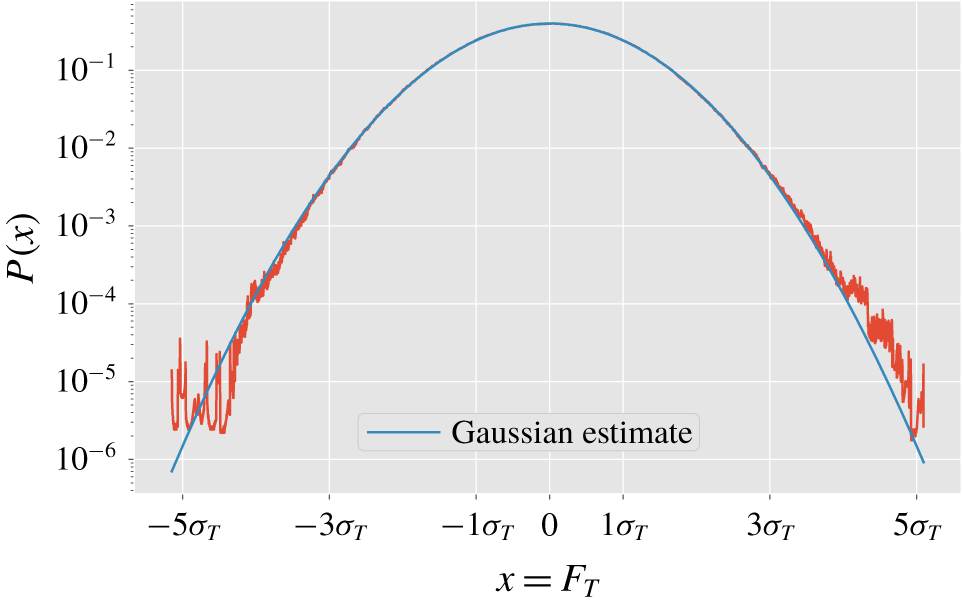
 $F_{T}$ is found nearly Gaussian as a consequence of the central limit theorem (see figure 13).
During a time interval  $[t;t+T]$, a fluctuation of
 $F_{T}(t)$ may be roughly viewed as the overall contribution of
 $T/\unicode[STIX]{x1D70F}_{c}$ independent fluctuations of the instantaneous drag
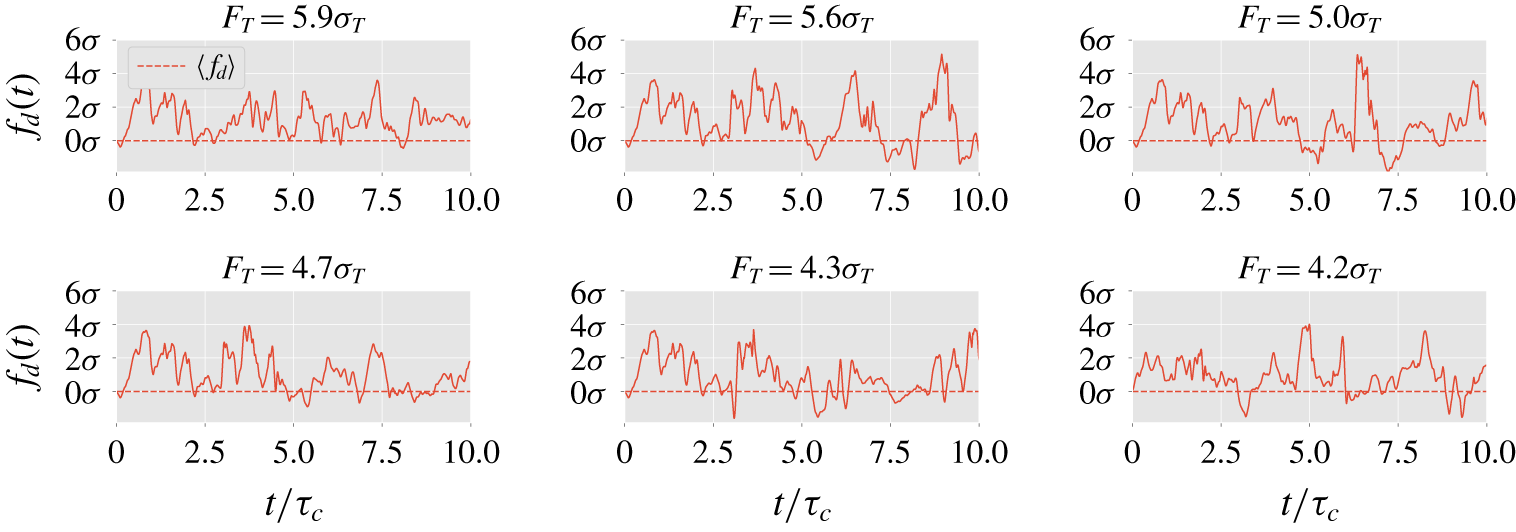
 $f_{d}$. It is thus legitimate to ask whether a large value of the averaged drag results from a single outstanding fluctuation of the instantaneous drag (case (i)), or from an unusual succession of moderate positive fluctuations (case (ii)). In the same way as in § 3.1, one can identify extreme fluctuations of
 $F_{T}$ exceeding some fixed threshold
 $a$, and sample a set of extreme events. Setting
 $a=5.2\unicode[STIX]{x1D70E}_{T}$ with
 $\unicode[STIX]{x1D70E}_{T}$ being the standard deviation of
 $F_{T}$,
 $84$ independent extreme events were sampled. Again, this choice results from a compromise between the need to consider large deviations from the mean value and the requirement to sample a sufficient number of events for meaningful statistics. As a rule of thumb, the threshold has been set so that approximately one hundred events are sampled.
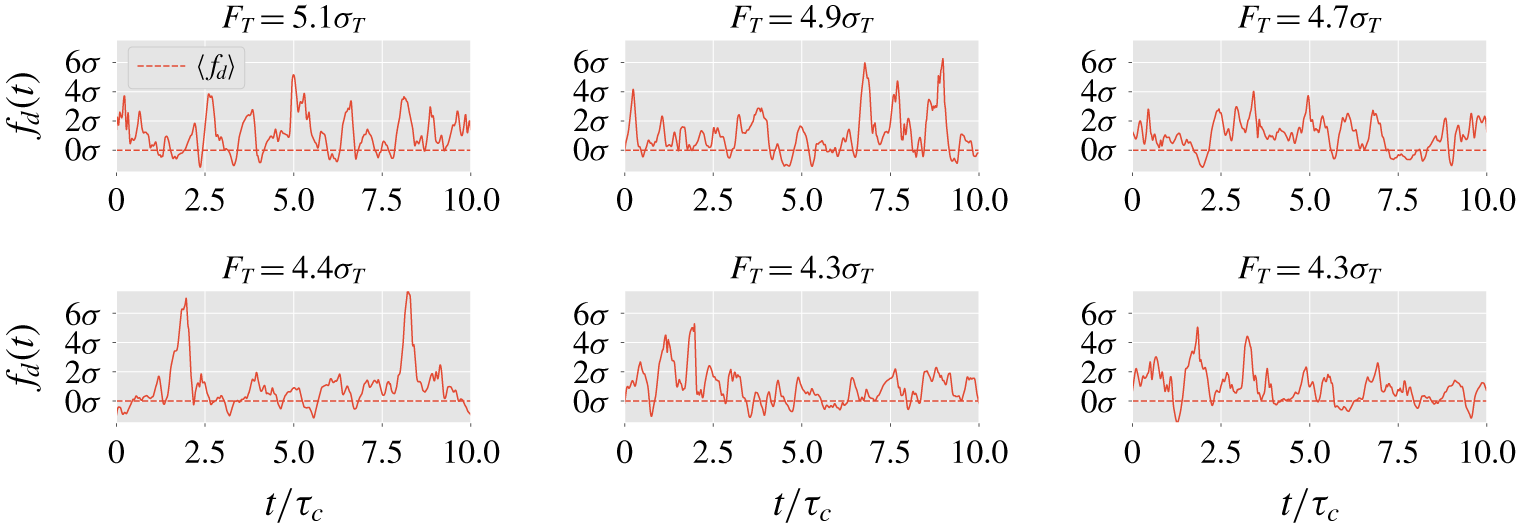
Instantaneous drag signals  $f_{d}(t)$ corresponding to the highest fluctuations of the averaged drag
 $F_{T}$ with a time window
 $T=10\unicode[STIX]{x1D70F}_{c}$;
 $\unicode[STIX]{x1D70E}$ and
 $\unicode[STIX]{x1D70E}_{T}$ denote the standard deviations of the instantaneous and the averaged drag, respectively.

The PDF of the time-averaged drag  $F_{T}$ with
 $T=10\unicode[STIX]{x1D70F}_{c}$.

Figure 12 displays the time series  $\{\,f_{d}(t)\}_{t^{\star }\leqslant t\leqslant t^{\star }+T}$ for several extreme fluctuations of
 $F_{T}$ occurring at
 $t=t^{\star }$. Qualitatively, it is found that extreme fluctuations of the time-averaged drag can neither be reduced to case (i) nor case (ii). Indeed, both cases are featured in figure 12; very large values of the averaged drag appear to result from either a very large fluctuation, or a significant succession of moderate (positive) fluctuations of the instantaneous drag.
4 Rare-event sampling algorithms
In the limit of very rare events and complex dynamics such as turbulent flows, the computational cost of direct sampling becomes prohibitive. Indeed, the return time of fluctuations  $f_{d}\geqslant a$ scales as
 $r(a)\propto \text{e}^{\ell a}~(\ell >0)$ according to (3.1). As a consequence, the computational cost required to sample events of amplitude
 $f_{d}\geqslant a$ through brute-force sampling diverges typically as
 $\text{e}^{\ell a}$. The aim of rare-event sampling algorithms is therefore to sample extreme fluctuations for a computational cost much lower than their return time. Rare-event (sampling) algorithms compute an ensemble of
 $N$ trajectories
 $\{\boldsymbol{x}_{n}(t)\}_{0\leqslant t\leqslant T_{a}}$ with
 $n=1\ldots N$, where
 $\{\boldsymbol{x}_{n}(t)\}_{0\leqslant t\leqslant T_{a}}$ refers to a trajectory of duration
 $T_{a}$ in the phase space of the system. At each step of the algorithm, some trajectories are discarded and others are replicated in order to preferably sample trajectories with extreme fluctuations. The algorithm tracks the ratio of the probability of the new ensemble with the probability of the previous one, allowing the estimation of the statistical bias and therefore the inference of the statistics of extreme events.
Different algorithms use different selection rules. The success of the algorithm essentially depends on the quality of the selection rule to detect the precursors of the extreme event (Rolland & Simonnet Reference Rolland and Simonnet2015). However, with the exception of rare analytical cases, the optimal selection rules are not a priori known (Lestang et al. Reference Lestang, Ragone, Bréhier, Herbert and Bouchet2018). In the following, we consider the AMS and GKTL algorithms. They both proved to be efficient for various dynamics but adopt opposite strategies: the AMS algorithm uses as a selection rule the value of a predetermined score function, whereas the GKTL uses a selection rule based on the increment of a score function. A complete description of these two algorithms and their operating principles is provided in appendices B and C.
The AMS algorithm (Cérou & Guyader Reference Cérou and Guyader2007) builds on previous ideas about splitting approaches (Kahn & Harris Reference Kahn and Harris1951; Glasserman et al. Reference Glasserman, Heidelberger, Shahabuddin and Zajic1999). In recent years, it has allowed for the computation of rare events in problems involving a large number of degrees of freedom such as molecular dynamics simulations (Aristoff et al. Reference Aristoff, Lelièvre, Mayne and Teo2015; Teo et al. Reference Teo, Mayne, Schulten and Lelièvre2016) or stochastic partial differential equations for the computation of rare trajectories in the Allen–Cahn equations (Rolland, Bouchet & Simonnet Reference Rolland, Bouchet and Simonnet2016). More recently it has been applied to rare events in stochastic models of wall turbulence (Rolland Reference Rolland2018) and atmospheric dynamics (Bouchet, Rolland & Simonnet Reference Bouchet, Rolland and Simonnet2019). A review of the AMS algorithm, its history and applications is also available in Cérou, Guyader & Rousset (Reference Cérou, Guyader and Rousset2019).
During the last decade, the main theoretical framework for the study of rare events in statistical physics has been the theory of large deviations (Touchette Reference Touchette2009). Alongside, numerical methods have been developed to sample rare events (Del Moral Reference Del Moral2004). Among them the GKTL algorithm (Giardinà et al. Reference Giardinà, Kurchan and Peliti2006) is particularly suitable for estimating the probability of observables which are temporal integrals over a very long period (Giardinà et al. Reference Giardinà, Kurchan, Lecomte and Tailleur2011; Laffargue et al. Reference Laffargue, Lam, Kurchan and Tailleur2013). Recently the GKTL algorithm has proven to be extremely efficient to simulate extreme heat waves in a comprehensive climate model (Ragone, Wouters & Bouchet Reference Ragone, Wouters and Bouchet2018), with a gain of a factor 100 to 1000 for the computation time. This achievement already represents a significant leap in the applicability of rare-event sampling to complex dynamical systems. The aim of this part of our work is to test rare-event algorithms for fluid–structure interaction in a turbulent flow, which is an unexplored area of application.
4.1 Extreme instantaneous drag forces with the Adaptive Multilevel Splitting algorithm
The AMS algorithm is here used with trajectories of fixed duration  $T_{a}$ (Lestang et al. Reference Lestang, Ragone, Bréhier, Herbert and Bouchet2018). At each iteration, trajectories with the lowest maxima of the score function
 $\unicode[STIX]{x1D709}(\boldsymbol{x}(t),t)$ during the time interval
 $0\leqslant t\leqslant T_{a}$ are discarded. These trajectories are re-sampled by branching them from the remaining trajectories. The operating principle of the AMS algorithm is detailed and sketched in appendix B. The objective is here to sample flow evolutions which exhibit extreme fluctuations of the drag
 $f_{d}(t)$ acting on the square obstacle. The observable itself is used as the score function, i.e.
 $\unicode[STIX]{x1D709}(\boldsymbol{x}(t),t)=f_{d}(t)$. Since the Navier–Stokes dynamics is deterministic, small random perturbations are artificially introduced at branching points; this procedure is detailed in appendix D. The chaotic dynamics then ensures that re-sampled trajectories separate from their parents over a time interval
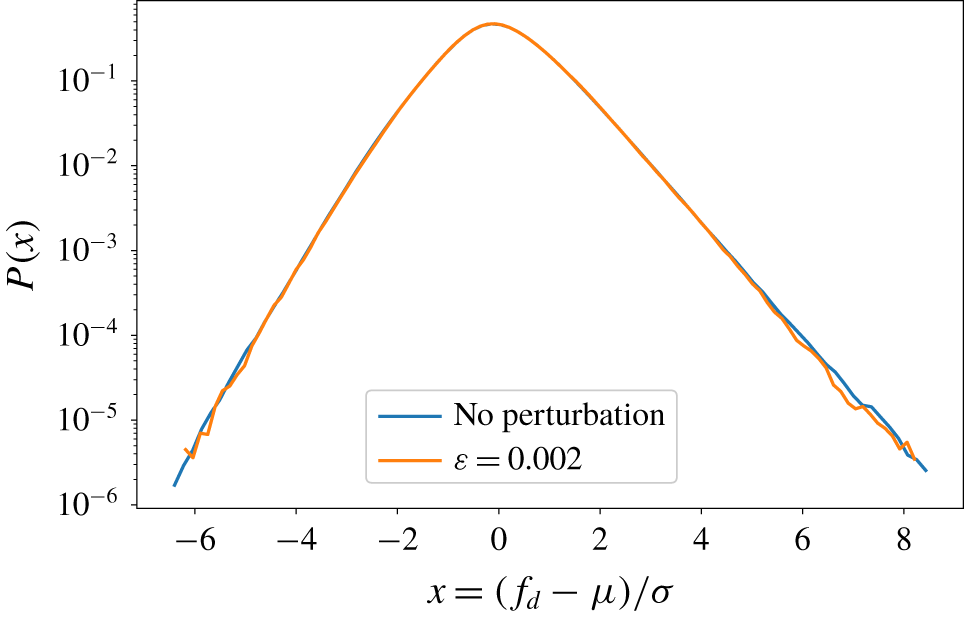
 $\unicode[STIX]{x1D70F}_{L}$, usually referred to as the Lyapunov time scale. Based on linear response theory, we expect this small perturbation to have a negligible impact on the statistics of the sampled rare events. This has been tested by performing a long simulation of the dynamics and by regularly perturbing the flow. We checked that the obtained statistics of the drag were consistent, within an error of the same amplitude as the perturbation amplitude, with the statistics computed from the (unperturbed) control simulation (see appendix D).
In addition to the score function, two important parameters are the number of trajectories  $N$ and their duration
 $T_{a}$. The size of the ensemble
 $N$ governs the statistical error affecting quantities averaged over the sampled set of trajectories. Therefore,
 $N$ should be taken as large as possible to reduce these errors with, nevertheless, a practical limit given by the available computational resources. In this work, we have performed two numerical simulations with
 $N=32$ and
 $N=256$. The duration
 $T_{a}$ should be much larger than
 $\unicode[STIX]{x1D70F}_{c}$ (Lestang et al. Reference Lestang, Ragone, Bréhier, Herbert and Bouchet2018) but, again, kept small enough to limit the computational effort. In practice, the duration of the trajectories was eventually set to
 $T_{a}=5\unicode[STIX]{x1D70F}_{c}$ in both simulations; we checked in particular that larger values of
 $T_{a}$ did not improve the results.
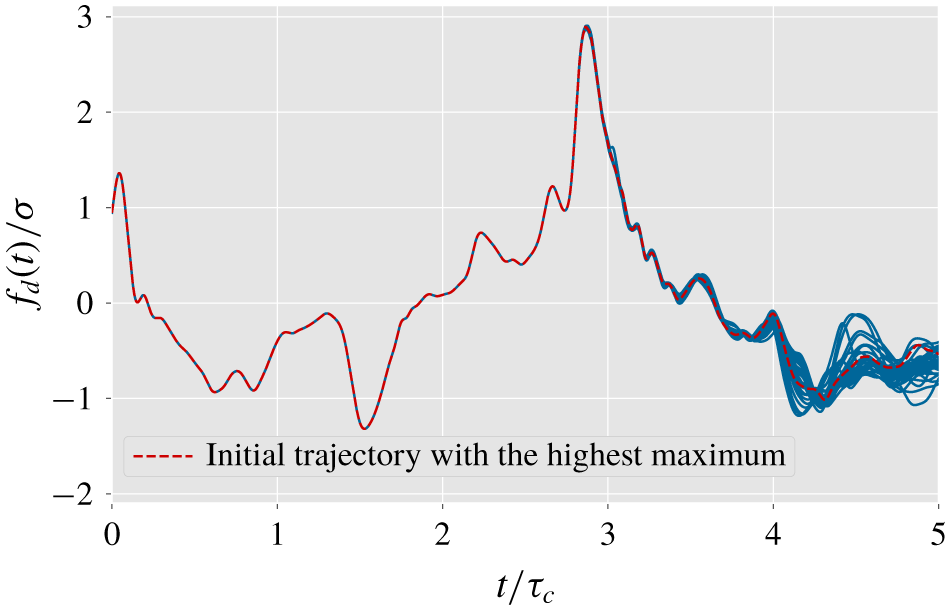
Ensemble of  $N=32$ trajectories after 181 iterations of the AMS algorithm. In this experiment, the algorithm is used with the instantaneous drag
 $f_{d}(t)$ as the score function. Each trajectory has a duration
 $T_{a}=5\unicode[STIX]{x1D70F}_{c}$ where
 $\unicode[STIX]{x1D70F}_{c}$ is the correlation time of the instantaneous drag.

Figure 14 displays the ensemble of drag values after many iterations of the AMS algorithm with  $N=32$. Interestingly, one obtains that all trajectories are eventually re-sampled from the same trajectory displaying the highest maximum in the initial ensemble, and overlap over most of their duration. The algorithm thus fails to enhance the sampling of extreme events. This result is also confirmed by increasing the number of initial trajectories to
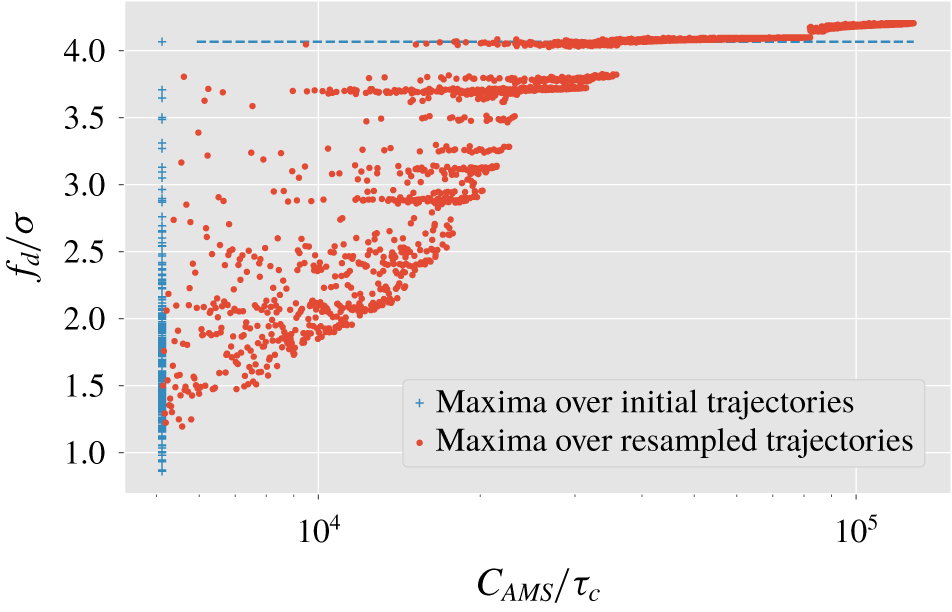
 $N=256$. The maximum drag achieved by the re-sampled trajectories is displayed as a function of the computational cost in figure 15; the distribution of the maximal drag for the initial trajectories is also shown. We observe that the trajectories with the lowest maxima of the score function are discarded after a few iterations, and new trajectories with higher maxima are re-sampled. However, the re-sampled trajectories never exceed the amplitude of the highest maximum already attained in the initial set of trajectories. A phenomenological explanation is developed in the next paragraph.
Maxima of the instantaneous drag throughout 256 re-sampled trajectories (vertical axis) as a function of the corresponding computational cost  $C_{AMS}$ in correlation time unit. The AMS algorithm fails to efficiently sample rare trajectories associated with drag fluctuations higher than the largest fluctuation already captured in the initial ensemble.

It takes a time  $\unicode[STIX]{x1D70F}_{L}$ (Lyapunov time scale) before a re-sampled trajectory separates from its parent. In our situation, this ‘memory effect’ is related to the fact that the score function is of a dimension much smaller (one) than the dimension of the phase space or, in other words, that the score function results from the contribution of a very large number of degrees of freedom. As shown in § 3.2.2, extreme drag fluctuations have a lifetime
 $\unicode[STIX]{x1D70F}_{c}$ related to the time scale over which a vortex remains trapped against the base of the obstacle. After
 $\unicode[STIX]{x1D70F}_{c}$, the vortex is swept away by the flow and further large fluctuations of the drag can only result from the trapping of new vortices. Figure 14 shows that
 $\unicode[STIX]{x1D70F}_{c}$ is shorter than the Lyapunov time scale
 $\unicode[STIX]{x1D70F}_{L}$. Therefore, the re-sampling of a trajectory branched close to
 $t=t^{\star }$ (when the maximum drag occurs) cannot lead to larger values at
 $t^{\star }\leqslant t\leqslant t^{\star }+\unicode[STIX]{x1D70F}_{L}$. For
 $t-t^{\star }>\unicode[STIX]{x1D70F}_{L}$, the drag process has lost the memory of the drag fluctuations on which the re-sampling was based and, thus, the probability of observing a new extreme fluctuation is also very low.
The difference between the typical duration of drag fluctuations  $\unicode[STIX]{x1D70F}_{c}$ and the Lyapunov time scale
 $\unicode[STIX]{x1D70F}_{L}$ may be heuristically associated with the so-called turbulence rate (Frisch Reference Frisch1995). As discussed previously, the duration of extreme fluctuations of the drag is closely related to the sweeping time of the flow past the obstacle, and consequently to the mean-flow velocity
 $U$. On the contrary, the Lyapunov time scale is rather associated with the intrinsic evolution of turbulent fluctuations in the reference frame of the mean flow, i.e. with the root-mean-square velocity
 $u_{rms}$. The ratio
 $u_{rms}/U$ (turbulence rate) is much lower than one in our case of grid-generated turbulence, which thus justifies that
 $\unicode[STIX]{x1D70F}_{L}>\unicode[STIX]{x1D70F}_{c}$.
In summary, a straightforward application of the AMS algorithm with the score function being the drag itself does not allow us to efficiently sample extreme fluctuations. This behaviour is independent of the choices of  $N$ and
 $T_{a}$. Increasing the size of the initial ensemble, or the duration of each trajectory, can only increase the amplitude of the global maximum reached initially but does not solve the issue of overlapping trajectories.
4.2 Extreme time-averaged drag forces with the Giardina–Kurchan–Tailleur–Lecomte algorithm
The sampling of extreme fluctuations of the time-averaged drag  $F_{T}$ is now examined. The AMS algorithm could be used in the same way as before by taking the time-averaged observable itself as the score function. However, this would lead to similar unsatisfactory results. For a time-averaged observable, an alternative approach is provided by the GKTL algorithm (Giardinà et al. Reference Giardinà, Kurchan and Peliti2006; Tailleur & Kurchan Reference Tailleur and Kurchan2007; Giardinà et al. Reference Giardinà, Kurchan, Lecomte and Tailleur2011). Similar to the AMS algorithm, the GKTL algorithm relies on the simulation of an ensemble of trajectories. At regular time intervals, some elements of the ensemble are killed and others are cloned according to a weight that depends on the history of the element itself. The weights are chosen so that, after several iterations of the algorithm, the trajectories in the ensemble are distributed according to a biased probability distribution that favours trajectories related to large values of the time average of the observable. The GKTL algorithm belongs to a family of algorithms known as ‘go with the winners’ (Aldous & Vazirani Reference Aldous and Vazirani1994; Grassberger Reference Grassberger2002). Similar ideas have already been applied in a wide range of fields such as polymer physics (Hsu & Grassberger Reference Hsu and Grassberger2011), out of equilibrium statistical physics (Nemoto, Jack & Lecomte Reference Nemoto, Jack and Lecomte2017), computer science (Aldous & Vazirani Reference Aldous and Vazirani1994), dynamical systems (Tailleur & Kurchan Reference Tailleur and Kurchan2007), quantum mechanics (Kosztin, Faber & Schulten Reference Kosztin, Faber and Schulten1996). The application of a go-with-the-winners approach to the computation of large deviations in non-equilibrium systems has first been proposed in (Giardinà et al. Reference Giardinà, Kurchan and Peliti2006). Over the last ten years, it has been successfully applied to investigate rare events in both stochastic (Giardinà et al. Reference Giardinà, Kurchan and Peliti2006; Garrahan et al. Reference Garrahan, Jack, Lecomte, Pitard, van Duijvendijk and van Wijland2007; Lecomte & Tailleur Reference Lecomte and Tailleur2007) and deterministic systems (Giardinà et al. Reference Giardinà, Kurchan and Peliti2006; Tailleur & Kurchan Reference Tailleur and Kurchan2007). The operating principle of the GKTL algorithm is developed in appendix C.
The application of the GKTL algorithm is considered for the flow dynamics introduced in § 2. The purpose is to speed-up the sampling of trajectories with extreme fluctuations of the time-averaged drag,  $F_{T}$. Our observable of interest is therefore the drag
 $f_{d}(t)$ and the duration
 $T_{a}$ of each trajectory corresponds to the period of averaging, i.e.
 $T_{a}=T$. In a nutshell, trajectories are first evolved in time independently up to
 $t=\unicode[STIX]{x1D70F}$, with
 $\unicode[STIX]{x1D70F}<T_{a}$ referring to a cloning period. Then, the selection (and cloning) rules apply according to the average of the observable of interest, here
 $f_{d}(t)$, over the interval
 $[0,\unicode[STIX]{x1D70F}]$. This procedure is repeated
 $n-1$ times over the intervals
 $[\unicode[STIX]{x1D70F},2\unicode[STIX]{x1D70F}],\ldots ,[(n-1)\unicode[STIX]{x1D70F},n\unicode[STIX]{x1D70F}=T_{a}]$. As a result, the resampled trajectories are distributed according to a probability distribution that is tilted towards large values of the averaged observable. Further details are provided in appendix C.
The algorithm depends on three parameters: the cloning strength  $k$, the number of trajectories
 $N$ and the resampling period
 $\unicode[STIX]{x1D70F}$. The higher
 $k$, the larger is the bias involved in the statistical resampling. Similar to the AMS algorithm,
 $N$ governs the error affecting the averaged quantities evaluated from the biased ensemble of trajectories, and should be chosen as high as possible. The cloning period
 $\unicode[STIX]{x1D70F}$ determines how often the resampling is performed. A small cloning period can result in a loss of information if the clones do not separate from their parents between two cloning steps. On the contrary, choosing
 $\unicode[STIX]{x1D70F}$ much higher than
 $\unicode[STIX]{x1D70F}_{c}$ results in insufficient cloning steps. As a result, a rule of thumb is
 $\unicode[STIX]{x1D70F}\approx \unicode[STIX]{x1D70F}_{c}$.
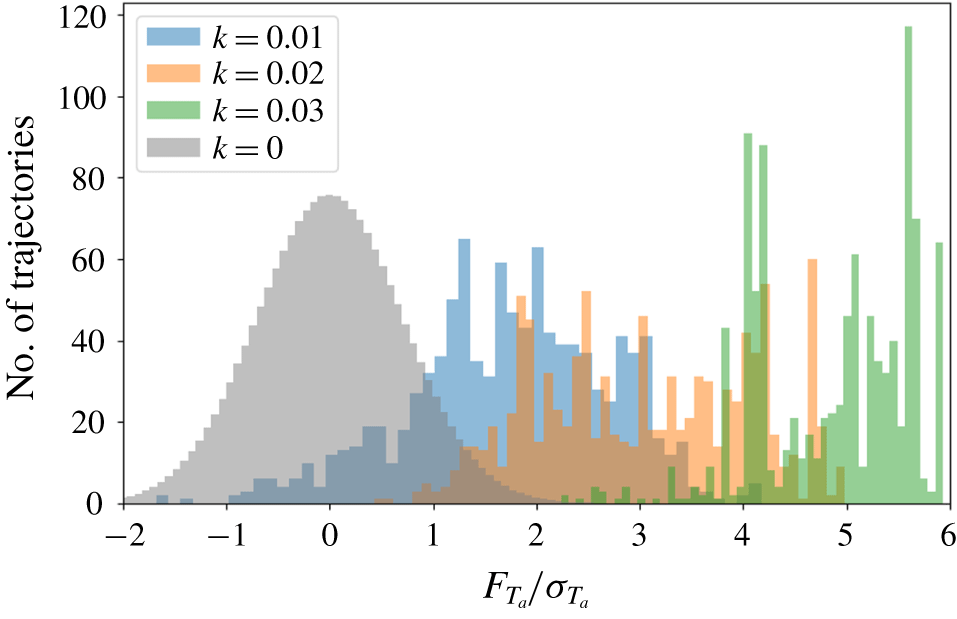
Rare-event sampling of the (zero-mean) time-averaged drag  $\tilde{F}_{T}=F_{T}-\overline{F_{T}}$ with
 $T=10\unicode[STIX]{x1D70F}_{c}$;
 $\unicode[STIX]{x1D70F}_{c}$ is the correlation time of the instantaneous drag. The shaded PDFs are estimated from the biased ensemble resulting from the GKTL algorithm applied to
 $N=1024$ trajectories of duration
 $T_{a}=T$ with the cloning period
 $\unicode[STIX]{x1D70F}=\unicode[STIX]{x1D70F}_{c}/2$. The dashed line refers to the unbiased PDF of
 $\tilde{F}_{T}$, i.e. obtained from direct sampling or with
 $k=0$ (no bias) in the GKTL algorithm.

Drag time series corresponding to the highest fluctuations of the averaged drag in the ensemble of trajectories sampled by the GKTL algorithm. The algorithm was applied with  $N=1024$,
 $\unicode[STIX]{x1D70F}=\unicode[STIX]{x1D70F}_{c}/2$ and
 $k=0.03$.

In the following experiments,  $N=1024$ and
 $T_{a}=10\unicode[STIX]{x1D70F}_{c}$, which yields a computational cost
 $C_{gktl}=N\times T_{a}\approx 10^{4}\unicode[STIX]{x1D70F}_{c}$. We fixed
 $\unicode[STIX]{x1D70F}=\unicode[STIX]{x1D70F}_{c}/2$ as a satisfactory compromise in order to ensure an efficient sampling (Lestang Reference Lestang2018). Three numerical experiments corresponding to three different values of the strength parameter
 $k$ have been carried out. Figure 16 shows the histograms of the (zero-mean) time-averaged drag for the three ensembles of trajectories, in addition to the unbiased histogram based on a Gaussian approximation of the PDF of the time-averaged drag. As expected, the algorithm samples preferentially trajectories with a higher value of the averaged drag. Furthermore, the higher
 $k$, the stronger the bias. Nevertheless, it should be mentioned that for a given number
 $N$ of trajectories, there is necessarily an upper limit
 $k_{max}$ of the strength parameter over which the finite number of trajectories becomes detrimental to the efficiency and accuracy of the selection procedure. For
 $k\gtrsim k_{max}$, the re-sampling relies only on a small number of ‘independent trajectories’ and most of the trajectories in the biased ensemble overlap. This effect is highlighted in figure 16, where the histogram corresponding to
 $k=0.03$ becomes artificially peaked. In the present simulations with
 $N=1024$ trajectories, one can empirically estimate that
 $k$ should be kept smaller than
 $k_{max}\approx 0.03$ to ensure the independence of the trajectories in the biased ensemble. Figure 17 displays the drag signal for the extreme trajectories sampled by the GKTL algorithm. In addition, figure 18 displays the vorticity field related to the maximum of the drag in sampled trajectories. One observes that the extreme events are consistent with the picture of strong vorticity being trapped in the vicinity of the base of the obstacle, as pointed out in § 3.2. Qualitatively, the related drag signals are also found very similar to those obtained from direct sampling. However, it should be stressed that the computational cost for sampling the events shown in figures 17 and 18 is approximately one hundred time lower than the computational cost required to capture by direct sampling the events displayed in figures 8 and 12.
Vorticity field associated with the maximum of the instantaneous drag  $f_{d}$ in trajectories sampled by the GKTL algorithm.

4.2.1 Computation of return times
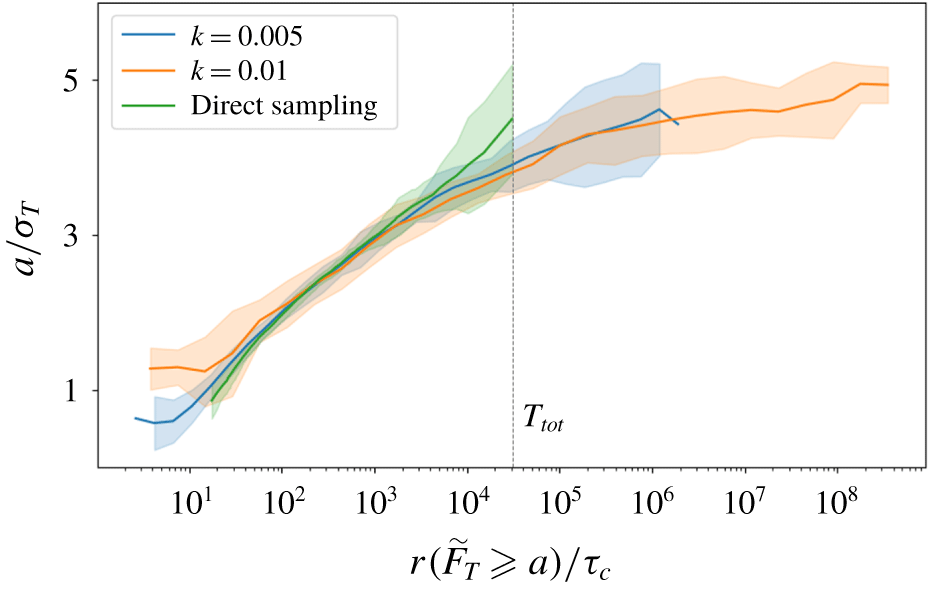
Importantly, the GKTL algorithm provides an ensemble of trajectories over which statistics of rare events can be evaluated. In this section, we show in particular that this ensemble allows for the estimate of return times for fluctuation amplitudes that would be unreachable by direct sampling (with the same computational cost). The method for estimating return times is described in appendix C.2.
Figure 19 displays the return times for extreme fluctuations of the time-averaged drag obtained by using the GKTL algorithm with two different values of the strength parameter  $k$. Both estimates have been obtained with the same computational cost
 $N\times T_{a}$. An estimate given by direct sampling with a time series of the same effective duration
 $T_{tot}=N\times T_{a}$ is also shown. Whilst a direct approach cannot access (by definition) events with a return time greater than
 $T_{tot}$, the GKTL algorithm allows us to estimate the statistics of time-averaged drag fluctuations having a return time several orders of magnitude above
 $T_{tot}$. Alternatively, for a fixed target return time, the use of the GKTL algorithm can reduce the computational cost of the estimation by several orders of magnitude. This is obviously a major advantage of this rare-event sampling algorithm.
Return times for the time-averaged drag acting on the square obstacle.  $\tilde{F}_{T}$ denotes the time-averaged drag with zero mean. The blue and red lines are obtained from the biased ensemble of trajectories generated by the GKTL algorithm with
 $N=1024$,
 $T_{a}=30\unicode[STIX]{x1D70F}_{c}$ and a cloning period
 $\unicode[STIX]{x1D70F}=\unicode[STIX]{x1D70F}_{c}/2$. The green line is the return times obtained from a single time series of duration equal to the computational cost of both GKTL experiments. Uncertainty ranges for the GKTL estimates are computed as the standard deviation over a set of 10 independent experiments. Uncertainty ranges for the direct estimation are computed as the standard deviation over a ensemble of direct estimates resulting from 60 independent time series.

5 Conclusion
The dynamics and statistics of extreme fluctuations of the drag acting on a squared obstacle mounted in a turbulent channel flow (in two dimensions) have been investigated numerically through both direct and rare-event sampling methods. By means of direct sampling based on a very long simulation, it was first observed that such extreme events are generically related to the trapping of a strong vortex against the base of the obstacle by a streamline cap. This arrangement does not persist over time, however, since the main flow eventually sweeps away the surrounding fluid structures responsible for this trapping. Therefore, the lifetime of extreme drag fluctuations is found to be of the order of the sweeping time of the flow past the obstacle, and the corresponding drag signal is very peaked around extreme fluctuations. In addition, it was found that extreme fluctuations of the time-averaged drag do not preferentially result from a small number of very large fluctuations or an exceptional succession of moderate fluctuations that pile up to yield a large value of the average; both configurations are observed. A second part of this study has been dedicated to the application of two representative rare-event algorithms, namely the Adaptive Multilevel Splitting and the Giardina–Kurchan–Tailleur–Lecomte algorithms, to our fluid mechanical problem. These algorithms rely on selection rules that determine how an initial ensemble of trajectories is evolved to possibly enhance the sampling of extreme fluctuations. On the one hand, the AMS algorithm fails (for this specific application) to generate trajectories exhibiting extreme events at a better rate than a direct sampling. This result can be related to the phenomenology of extreme drag fluctuations, whose lifetime is shorter than the time scale over which the replicated trajectories manage to separate from their duplicate. Therefore, the algorithm is unable to benefit from the precursors of extreme fluctuations to enhance the realization of new rare-event trajectories. On the other hand, the GKTL algorithm leads to a computational gain of several orders of magnitude. The latter is based on the cumulative evolution of the system rather than its instantaneous behaviour, as opposed to the AMS algorithm. The downside is that the algorithm provides only statistics of extreme values of the time-averaged fluctuations. This can nevertheless be of great interest for computing return times of extreme (time-averaged) fluctuations, for instance.
Selection rules at the heart of rare-event algorithms rely heavily on the choice of a score function that drives the selection and replication of trajectories. In this study, the observable itself (the drag) has been chosen as the score function. Optimizing the choice of this score function is desirable (especially for the AMS algorithm) but difficult in practice, since it should account for the phenomenology of the extreme events themselves, for example how these events build up. Our study shows this quite clearly. A possible direction would then be to take advantage of recent advances in learning methods to dynamically optimize the score function.
Acknowledgements
The authors thank F. Ragone, C. Herbert, C.-E. Bréhier and E. Simonnet for useful discussions and suggestions on various aspects of this work. T.L. and F.B. acknowledge support from the European Research Council under the European Union’s seventh Framework Program (FP7/2007-2013 grant agreement no. 616811). Simulations have been performed on the local HPC facilities at École Normale Supérieure de Lyon (PSMN) and École Centrale de Lyon (PMCS2I). The facilities at PSMN are supported by the Auvergne-Rhône-Alpes region (GRANT CPRT07-13 CIRA) and the national Equip@Meso grant (ANR-10-EQPX-29-01).
Declaration of interests
The authors report no conflict of interest.
Appendix A. The lattice Boltzmann method
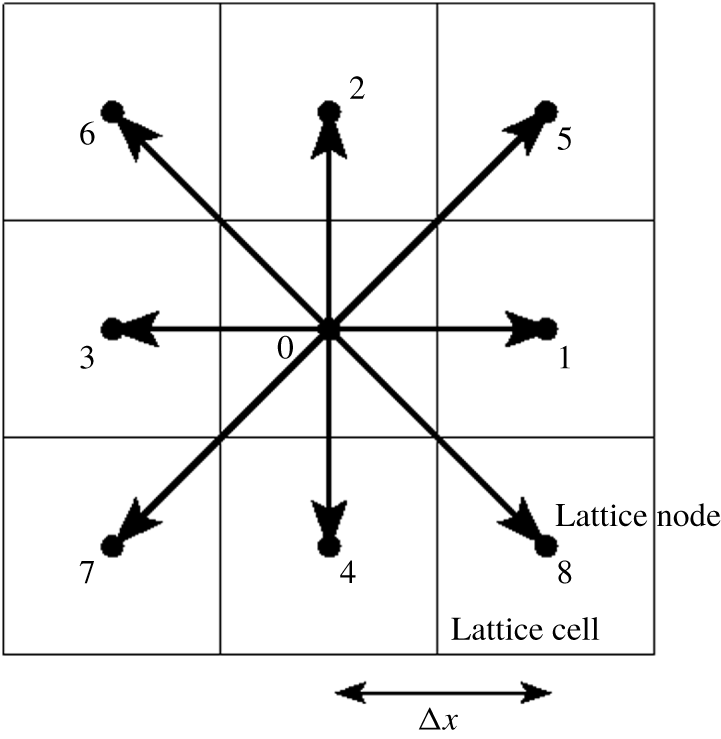
In the lattice Boltzmann method, the fluid is viewed as a population of particles that collide, redistribute and propagate along the different links of a discrete lattice (see Krüger et al. (Reference Krüger, Kusumaatmaja, Kuzmin, Shardt, Silva and Viggen2017) for a comprehensive introduction). In our two-dimensional situation, the so-called D2Q9 lattice with only nine possible velocities  $\{{\boldsymbol{c}_{\boldsymbol{i}}\}}_{i=0\ldots 8}$ at each node has been adopted (see figure 20). Locally, the macroscopic flow variables (per unit volume) are recovered by summing over the densities of particles
 $\{\,{f_{i}\}}_{i=0\ldots 8}$ moving with the different velocities, i.e.
 $$\begin{eqnarray}\unicode[STIX]{x1D70C}(\boldsymbol{x},t)=\mathop{\sum }_{i}f_{i}(\boldsymbol{x},t)\quad \text{and}\quad \unicode[STIX]{x1D70C}(\boldsymbol{x},t)\boldsymbol{u}(\boldsymbol{x},t)=\mathop{\sum }_{i}f_{i}(\boldsymbol{x},t)\boldsymbol{c}_{\boldsymbol{i}}\end{eqnarray}$$
for the mass density and the fluid momentum respectively. The assumption of weak compressibility (for an ideal gas) is made so that the pressure is directly proportional to the mass density:  $p=c_{s}^{2}\unicode[STIX]{x1D70C}$ where
 $c_{s}$ is interpreted as a speed of sound.
The complexity of the flow emerges from the repeated application of simple rules of streaming and collision. The LBM advances the local densities of particles  $f_{i}(\boldsymbol{x},t)$ moving with velocities
 $\boldsymbol{c}_{i}$ in a two-step procedure. Namely, an exact streaming step
 $$\begin{eqnarray}f_{i}(\boldsymbol{x}+\boldsymbol{c}_{i}\unicode[STIX]{x0394}t,t+\unicode[STIX]{x0394}t)=f_{i}^{out}(\boldsymbol{x},t)\end{eqnarray}$$
during which particles move with their own velocity to a neighbouring node, and an instantaneous collision step
 $$\begin{eqnarray}f_{i}^{out}(\boldsymbol{x},t)=-\frac{1}{\unicode[STIX]{x1D70F}_{\unicode[STIX]{x1D708}}}(f_{i}(\boldsymbol{x},t)-f_{i}^{eq}(\boldsymbol{x},t)),\end{eqnarray}$$
which achieves a relaxation of local densities towards an absolute equilibrium (at the macroscopic level). The time scale  $\unicode[STIX]{x1D70F}_{\unicode[STIX]{x1D708}}$ (in lattice unit) is related to the kinematic viscosity of the fluid by
 $$\begin{eqnarray}\unicode[STIX]{x1D708}=\left(\unicode[STIX]{x1D70F}_{\unicode[STIX]{x1D708}}-{\textstyle \frac{1}{2}}\right)c_{s}^{2}~\unicode[STIX]{x0394}t.\end{eqnarray}$$
This simplification of the collision kernel is known as the BGK approximation in the kinetic theory of gas (Bhatnagar, Gross & Krook Reference Bhatnagar, Gross and Krook1954). The equilibrium function is given by
 $$\begin{eqnarray}f_{i}^{eq}(\boldsymbol{x},t)=w_{i}\unicode[STIX]{x1D70C}(\boldsymbol{x},t)\left(1+\frac{u(\boldsymbol{x},t)\boldsymbol{\cdot }\boldsymbol{c}_{\boldsymbol{i}}}{c_{s}^{2}}+\frac{u_{\unicode[STIX]{x1D6FC}}(\boldsymbol{x},t)u_{\unicode[STIX]{x1D6FD}}(\boldsymbol{x},t)({c_{i}}_{\unicode[STIX]{x1D6FC}}{c_{i}}_{\unicode[STIX]{x1D6FD}}-c_{s}^{2}\unicode[STIX]{x1D6FF}_{\unicode[STIX]{x1D6FC}\unicode[STIX]{x1D6FD}})}{2c_{s}^{4}}\right)\end{eqnarray}$$
with the weight factors  $w_{0}=4/9,w_{1\ldots 4}=1/9$ and
 $w_{5\ldots 8}=1/36$ for the D2Q9 lattice. This discrete lattice Boltzmann scheme is second-order accurate in
 $\unicode[STIX]{x0394}x$ and compliant to the weakly compressible Navier–Stokes equations with a third-order error in
 $Ma=|\boldsymbol{u}|/c_{s}$ as the lattice spacing vanishes, i.e.
 $\unicode[STIX]{x0394}x\rightarrow 0$ (Succi Reference Succi2018).
Sketch of the D2Q9 lattice. Particles move exactly from a lattice node towards one of its nine neighbours (including the node itself) during one time step. By definition, the lattice spacing is related to the time step by  $\unicode[STIX]{x0394}x/\unicode[STIX]{x0394}t=\sqrt{3}c_{s}$ where
 $c_{s}$ is interpreted as a speed of sound.

As mentioned before, the pressure is directly accessible from the mass density:  $p=\unicode[STIX]{x1D70C}c_{s}^{2}$. The viscous stress is also obtained easily from the densities of particles by
 $$\begin{eqnarray}\unicode[STIX]{x1D70F}_{\unicode[STIX]{x1D6FC}\unicode[STIX]{x1D6FD}}^{visc.}=-\frac{\unicode[STIX]{x1D708}}{\unicode[STIX]{x1D70F}_{\unicode[STIX]{x1D708}}~c_{s}^{2}\unicode[STIX]{x0394}t}\mathop{\sum }_{i}{c_{i}}_{\unicode[STIX]{x1D6FC}}{c_{i}}_{\unicode[STIX]{x1D6FD}}(f_{i}-f_{i}^{eq}),\end{eqnarray}$$
so that the total stress is expressed as
 $$\begin{eqnarray}\unicode[STIX]{x1D70F}_{\unicode[STIX]{x1D6FC}\unicode[STIX]{x1D6FD}}=-c_{s}^{2}\mathop{\sum }_{i}f_{i}~\unicode[STIX]{x1D6FF}_{\unicode[STIX]{x1D6FC}\unicode[STIX]{x1D6FD}}-\frac{\unicode[STIX]{x1D708}}{\unicode[STIX]{x1D70F}_{\unicode[STIX]{x1D708}}~c_{s}^{2}\unicode[STIX]{x0394}t}\mathop{\sum }_{i}{c_{i}}_{\unicode[STIX]{x1D6FC}}{c_{i}}_{\unicode[STIX]{x1D6FD}}(f_{i}-f_{i}^{eq}).\end{eqnarray}$$
Finally, let us mention that in the present context of turbulent flows, the single-relaxation-time BGK collision has been replaced by a multi-relaxation-time procedure based on central moments with an improved stability (Rosis Reference Rosis2016).
Appendix B. The AMS algorithm
B.1 Operating principle
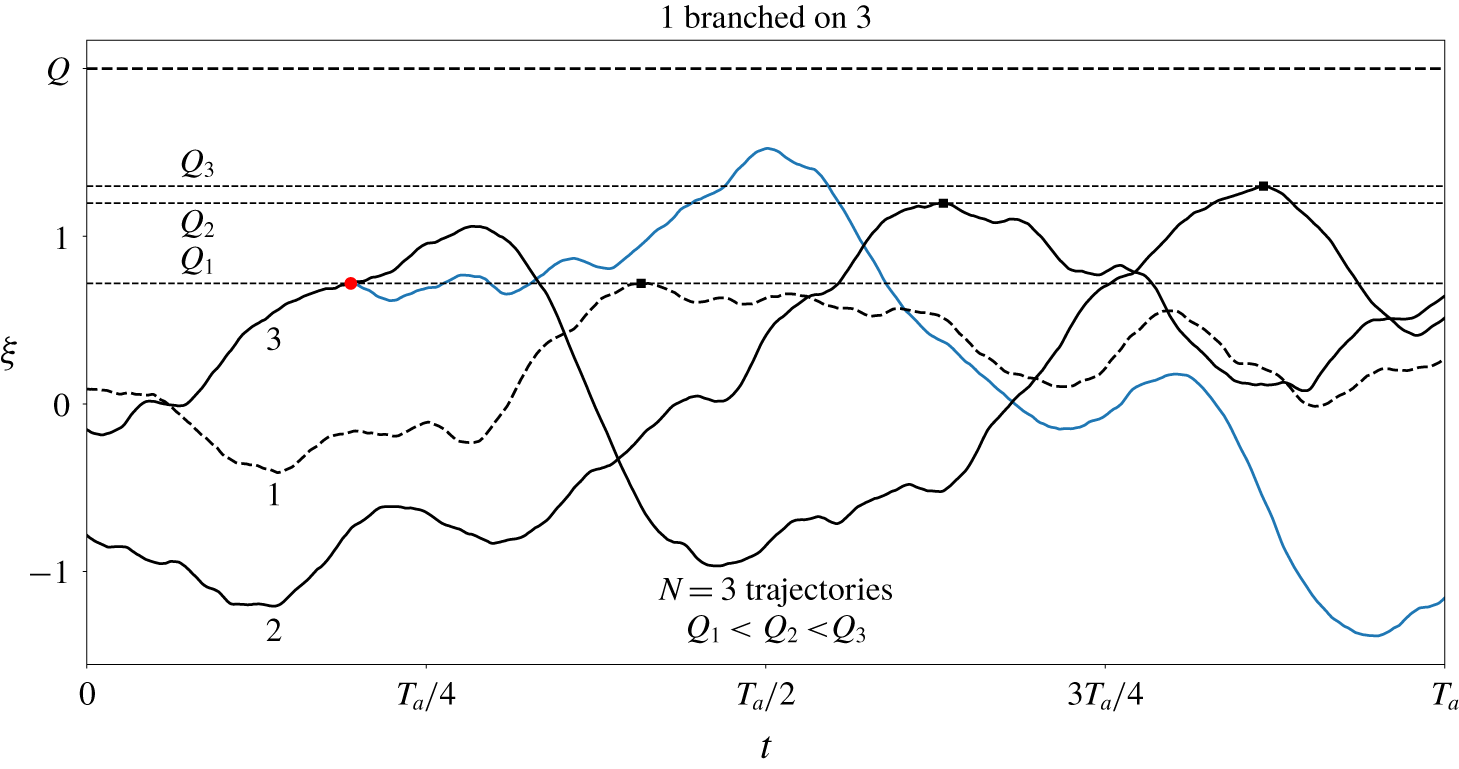
The operating principle of the AMS algorithm is sketched in figure 21. The trajectories 1, 2 and 3 represent the evolution of the score function for the current ensemble of trajectories. On the basis of their respective maxima:  $Q_{1}$,
 $Q_{2}$ and
 $Q_{3}$, the trajectory with the lowest maximum is discarded in the ensemble (dashed line). Among the two remaining trajectories, trajectory 3 is chosen randomly and copied until it reaches the value
 $Q_{1}$. It is then simulated from this branching point to the final time
 $T_{a}$. In the present case of deterministic dynamics, a small perturbation is introduced at the branching to separate the trajectories. This re-sampling procedure can be iterated
 $J$ times or until all trajectories do exceed a fixed threshold
 $Q$.
Operating principle of the AMS algorithm with three trajectories of duration  $T_{a}$. Here,
 $\unicode[STIX]{x1D709}(x(t))$ is a prescribed score function defined along each trajectory. Selection and branching rules are applied in order to reach a maximum score value within the time interval
 $[0,T_{a}]$.

B.2 Application to a simple case: the Ornstein–Uhlenbeck process
A one-dimensional Ornstein–Uhlenbeck process is considered:
 $$\begin{eqnarray}{\dot{x}}=-x+\unicode[STIX]{x1D702}(t),\end{eqnarray}$$
where  $\unicode[STIX]{x1D702}$ is a Gaussian noise with
 $\langle \unicode[STIX]{x1D702}(t)\unicode[STIX]{x1D702}(t-t^{\prime })\rangle =\unicode[STIX]{x1D6FF}(t-t^{\prime })$.
The AMS is applied to a set of  $N=32$ trajectories
 $\{x_{n}(t)\}_{0\leqslant t\leqslant T_{a}}$ with
 $T_{a}=5\unicode[STIX]{x1D70F}_{c}$. Let us note that the correlation time is
 $\unicode[STIX]{x1D70F}_{c}=1$ for the process defined by (B 1). Our objective is to sample fluctuations
 $x\geqslant a$ with
 $a$ being very large compared to the typical values of
 $x$. The score function is simply
 $x(t)$ and only one trajectory is re-sampled at each iteration. The computational cost of the algorithm after
 $J$ iterations is therefore related to the simulation of the
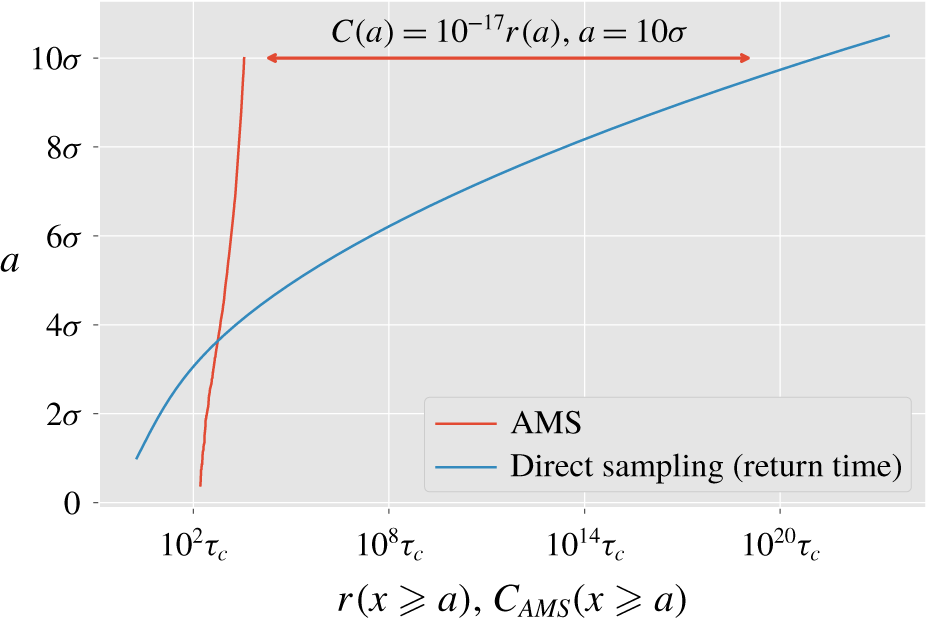
 $N$ initial trajectories and the number of re-sampled trajectories. Figure 22 compares the computational cost of the AMS algorithm with that of a direct sampling. In the latter, the typical computational cost is simply the return time
 $r(a)$. One can see that the successive re-samplings of the AMS algorithm lead rapidly to trajectories exhibiting extreme fluctuations. For large
 $a$, the computational cost is many orders of magnitude lower than that obtained by direct sampling.
Efficiency of the AMS algorithm with respect to direct sampling in the case of an Ornstein–Uhlenbeck process (Lestang et al. Reference Lestang, Ragone, Bréhier, Herbert and Bouchet2018). The red line represents the evolution of the maximum obtained from re-sampled trajectories as a function of the computational cost  $C_{AMS}$. The blue line is the analytical solution for the return time of amplitude
 $a$.

The Ornstein–Uhlenbeck process showcases the efficiency of the AMS algorithm. However, the state space is here one-dimensional and the choice of the score function is straightforward: it is  $x$ itself. In addition, the noise term in (B 1) has no correlation in time, which implies that newly generated trajectories quickly separate from their parents. Such favourable features do not persist in the case of fluid dynamics.
Appendix C. The Giardina–Kurchan–Tailleur–Lecomte algorithm
C.1 The operating principle
The GKTL algorithm is based on the simulation of an ensemble of  $N$ trajectories
 $\{\boldsymbol{x}_{n}(t)\}_{0\leqslant t\leqslant T_{a}}$ with
 $n=1\ldots N$ starting from independent random initial conditions. Let us consider a real-valued observable of interest
 $A(\boldsymbol{x}(t))$, e.g. the drag
 $f_{d}(t)$, and introduce a cloning period
 $\unicode[STIX]{x1D70F}$. At time instants
 $t_{i}=i\unicode[STIX]{x1D70F}$ with
 $i=1,2,\ldots ,T_{a}/\unicode[STIX]{x1D70F}$ (
 $T_{a}$ is a multiple of
 $\unicode[STIX]{x1D70F}$) a weight
 $W_{n}^{i}$ is assigned to each trajectory. This weight is defined (
 $t_{0}=0$) by
 $$\begin{eqnarray}W_{n}^{i}=\frac{\text{e}^{k\int _{t_{i-1}}^{t_{i}}A(\boldsymbol{x}_{n}(t))\,\text{d}t}}{R_{i}}\quad \text{with the normalization factor}\quad R_{i}=\frac{1}{N}\mathop{\sum }_{n=1}^{N}\text{e}^{k\int _{t_{i-1}}^{t_{i}}A(\boldsymbol{x}_{n}(t))\,\text{d}t}\end{eqnarray}$$
so that  $\sum _{n=1}^{N}W_{n}^{i}=N$. The weights
 ${\{W_{n}^{i}\}}_{n=1\ldots N}$ determine how many copies of each trajectory are made at time
 $t=t_{i}$. The parameter
 $k$ characterizes the amplitude of the statistical bias involved in the algorithm (see figure 16). For more information about the practical implementation of the algorithm, the interested reader can refer to Brewer et al. (Reference Brewer, Clark, Bradford and Jack2018) and Lestang (Reference Lestang2018). The application of this re-sampling at each step
 $t_{i}$ eventually leads to a biased sampling in the trajectory space; the trajectories corresponding to extreme values of
 $\int _{0}^{T_{a}}A(\boldsymbol{x}_{n}(t))\,\text{d}t$ have a higher probability. The sampled biased distribution writes
 $$\begin{eqnarray}\displaystyle \mathbb{P}_{k}(\{\boldsymbol{X}(t)\}_{0\leqslant t\leqslant T_{a}}=\{\boldsymbol{x}(t)\}_{0\leqslant t\leqslant T_{a}})\underset{N\rightarrow \infty }{{\sim}}\frac{\text{e}^{k\int _{0}^{T_{a}}A(\boldsymbol{x}(t))\,\text{d}t}}{Z(k,T_{a})}\mathbb{P}_{0}(\{\boldsymbol{X}(t)\}_{0\leqslant t\leqslant T_{a}}=\{\boldsymbol{x}(t)\}_{0\leqslant t\leqslant T_{a}}),\quad & & \displaystyle\end{eqnarray}$$
where  $\mathbb{P}_{0}(\{\boldsymbol{X}(t)\}_{0\leqslant t\leqslant T_{a}}=\{\boldsymbol{x}(t)\}_{0\leqslant t\leqslant T_{a}})$ refers formally to the probability of observing the trajectory
 $\{\boldsymbol{x}(t)\}_{0\leqslant t\leqslant T_{a}}$. The normalization factor is given by
 $Z(k,T_{a})=\prod _{i=1}^{T_{a}/\unicode[STIX]{x1D70F}}R_{i}$. One can mention that
 $$\begin{eqnarray}Z(k,T_{a})\underset{N\rightarrow \infty }{{\sim}}\mathbb{E}_{0}[\text{e}^{k\int _{0}^{T_{a}}A(\boldsymbol{X}(t))\,\text{d}t}],\end{eqnarray}$$
with  $\mathbb{E}_{0}$ being the expectation value with respect to the distribution
 $\mathbb{P}_{0}$. This result relies on the mean-field approximation
 $$\begin{eqnarray}R_{i}=\frac{1}{N}\mathop{\sum }_{n=1}^{N}\text{e}^{k\int _{t_{i-1}}^{t_{i}}A(\boldsymbol{X}_{n}(t))\,\text{d}t}\underset{N\rightarrow \infty }{{\sim}}Z(k,t_{i})=\mathbb{E}_{i}[\text{e}^{k\int _{t_{i-1}}^{t_{i}}A(\boldsymbol{X}(t))\,\text{d}t}],\end{eqnarray}$$
where  $\mathbb{E}_{i}[.]$ denotes the expectation value with respect to the biased distribution
 $\mathbb{P}_{k}^{(i)}$ obtained after
 $i$ cloning steps. The typical relative error related to this approximation can be shown to be of order
 $1/\sqrt{N}$ for a family of rare-event algorithms including the GKTL algorithm (Del Moral Reference Del Moral2004, Reference Del Moral2013). Rejected trajectories are discarded from the statistics. Eventually, an effective ensemble of
 $N$ trajectories of duration
 $T_{a}$ is obtained, distributed according to
 $\mathbb{P}_{k}$.
A key feature of the GKTL algorithm is that all resampled trajectories are solutions of the original dynamics. Nevertheless, it should be noted that a small random perturbation is introduced in the cloning procedure to force clones from the same trajectory to separate, i.e. artificial randomness is introduced so that the cloning procedure is effective for deterministic dynamics. As for the AMS algorithm, it has been checked that this perturbation did not affect the statistics of the sampled trajectories. Eventually, the sampled trajectories obtained with the GKTL algorithm can be used to compute the statistical properties of any observable with respect to the distribution  $\mathbb{P}_{0}$ from the distribution
 $\mathbb{P}_{k}$ by using (C 2).
C.2 Computation of return times
Each trajectory in the biased ensemble results in a time series of the time-averaged drag
 $$\begin{eqnarray}F_{T}^{(j)}(t)=\int _{t-T}^{t}f_{d}^{(j)}(\unicode[STIX]{x1D70F})\,\text{d}\unicode[STIX]{x1D70F},\quad t\in [T,T_{a}]\end{eqnarray}$$
and the return time of a fluctuation  $F_{T}\geqslant a$ is given by (Lestang et al. Reference Lestang, Ragone, Bréhier, Herbert and Bouchet2018)
 $$\begin{eqnarray}r(a)=-\frac{T_{a}-T}{\ln (1-\mathbb{P}(F_{T}\geqslant a))}.\end{eqnarray}$$
The probability  $\mathbb{P}(F_{T}\geqslant a)$ can be estimated from the biased ensemble by inverting (C 2)
 $$\begin{eqnarray}\mathbb{P}(f_{d}\geqslant a)\approx \frac{1}{N}\mathop{\sum }_{j=1}^{N}\text{e}^{T_{a}\unicode[STIX]{x1D706}(k)}\text{e}^{kT_{a}F_{T}^{(j)}}s_{j}(a)\end{eqnarray}$$
with  $s_{j}(a)=1$ if
 $\max _{T\leqslant t\leqslant T_{a}}[F_{T}^{(j)}]\geqslant a$ and
 $s_{j}(a)=0$ otherwise, i.e. by summing the weights of the time series which maximum is larger than
 $a$.
Appendix D. Perturbation at branching time
The application of the AMS and GKTL algorithms to a deterministic dynamical system requires a perturbation at initial time of the resampled trajectories. In the absence of such a perturbation, the resampling would not yield new trajectories but exact copies of the original trajectories. In the framework of lattice Boltzmann simulations, the state of the system is described at a mesoscopic level by the particle densities  $\{\,f_{i}(\boldsymbol{x},t)\}_{i=0\ldots 8}$ (see appendix A). Therefore, the perturbation of the solution at time
 $t_{0}$ applies directly to the
 $f_{i}$ values with
 $$\begin{eqnarray}f_{i}(\boldsymbol{x},t_{0})\longrightarrow f_{i}(\boldsymbol{x},t_{0})+\unicode[STIX]{x1D716}\mathop{\sum }_{n=1}^{N_{s}}\unicode[STIX]{x1D6FC}_{n}\,f_{i}^{(n)}(\boldsymbol{x}),\end{eqnarray}$$
where the  $\unicode[STIX]{x1D6FC}_{n}$ values are random numbers uniformly picked in the interval
 $[0,1]$,
 $\unicode[STIX]{x1D716}$ is the relative amplitude of the perturbation and
 $\{\,f_{i}^{(n)}\}_{n=1\ldots N_{s}}$ is a set of arbitrary snapshots of the flow. In other words, the perturbation is a random linear combination of
 $N_{s}$ snapshots. Eventually, the perturbed densities are rescaled so that the mass of the system is preserved. In practice, we chose
 $\unicode[STIX]{x1D716}=0.002$ and
 $N_{s}=10$ to ensure that the perturbations remain sufficiently small, random and independent. In order to check that this perturbation does not impact the statistics of drag fluctuations, a long simulation of duration
 $T_{tot}=10^{5}\unicode[STIX]{x1D70F}_{c}$ has been performed with a periodic perturbation (with period
 $\unicode[STIX]{x1D70F}_{c}/2$) mimicking the perturbation of the clones in the algorithm (see § 4). Figure 23 shows that the statistics of the perturbed and unperturbed simulations are equivalent.
The PDFs of (normalized) drag fluctuations obtained from the perturbed (at branching points) and unperturbed numerical simulations;  $\unicode[STIX]{x1D716}$ is the relative amplitude of the perturbation.