1 Introduction
The estimation of outstanding claims and claim reserves is crucial for the regular operation of insurance companies in order to manage losses, pay all possible claims, avoid insolvencies and determine the profit. Usually, in a loss reserving process embedded with ordinary least squares estimation, it is assumed that the regression coefficients are fixed, which means that the claims run-off pattern remains the same for each accident year.
In practice, many times, the claims run-off pattern is not the same because of unobserved endogenous or exogenous factors, which affect accident years and cannot be incorporated into the model. Thus, the assumption of fixed coefficients can be relaxed by allowing the regression coefficients to vary across individual claims and a linear regression model with random coefficients is proposed. In this way, the chain-ladder technique is presented in a regression form, where coefficients of explanatory variables (in our model the explanatory variables are dummy variables, indicating the position of a cell in a run-off triangle) may be subject to random variations, which means that the development of claims differs over the accident years.
Verrall (Reference Verrall1994) proposed a model, which adapts a chain-ladder technique by allowing the development factor to evolve over the accident years, as a special application of his general state-space model (Verrall Reference Verrall1989), where a recursive model for row parameters had been used. De Alba (Reference De Alba2002) and Wüthrich (Reference Wüthrich2007) incorporated Bayesian methods to claims reserving. Furthermore, De Jong & Zehnwirth (Reference De Jong and Zehnwirth1983) described a state-space approach for claims reserving that focuses on the forecasting nature of the claims reserving problem accommodating both objective and subjective information.
It is also well known that the loss reserving estimation is very sensitive to outliers (large claims or catastrophic events), which can lead to an unsatisfactory behaviour of the chain-ladder technique. Even small changes in observed values, in certain regions of the run-off triangle, can result in a large change in the predicted values and consequently to a mis-estimation of ultimate reserves. Kremer (Reference Kremer1997) incorporated the ideas of robust statistics into loss reserving techniques. Verdonck et al. (Reference Verdonck, Van Wouwe and Dhaene2009) created a technique for detecting outliers in a run-off triangle of claim amounts and solved the problem of the non-robustness of the chain ladder by replacing the mean by the median, while Busse et al. (Reference Busse, Müller and Dacorogna2010) designed a filter for outliers and large jumps and proposed a robust version of Mack’s variance estimator. Verdonck & Debruyne (Reference Verdonck and Debruyne2011) exploited the influence function approach to present a diagnostic tool for highlighting the influence of every individual claim on the classical chain-ladder estimations and obtained robust estimations of generalised linear models in a chain-ladder framework. Also, a detailed overview of research papers related to the use of state-space models in claims reserving, where robustness can be achieved by using kalman filtering is presented by Chukhrova & Johannssen (Reference Chukhrova and Johannssen2017).
Regarding some other robust approaches within the chain-ladder technique, Hubert et al. (Reference Hubert, Verdonck and Yorulmaz2017) proposed the “FastSUR” algorithm in order to robustify the general multivariate chain-ladder method of Zhang (Reference Zhang2010), where the parameters are estimated using seemingly unrelated regression (SUR). Based on the MM estimators, Peremans et al. (Reference Peremans, Van Aelst and Verdonck2018) suggested an alternative, robust method to estimate the SUR parameters in a more outlier-resistant way. Pitselis et al. (Reference Pitselis, Grigoriadou and Badounas2015) applied a class of robust estimators to the chain-ladder procedure, where data are in a log-linear form, including robust estimators that simultaneously attain maximum breakdown point and full asymptotic efficiency under error normality. The aim of the present paper is to incorporate robust statistical procedures to the loss reserving estimation when regression coefficients are random.
The remainder of this paper is organised as follows. In section 2, we describe the random coefficient regression (RCR) model, the parameter estimation and how the loss reserving model can be incorporated into the RCR model. Section 3 deals with the identification of outliers and robust M and MM estimators of RCR models are proposed in order to remedy the effects of outliers that might appear in the data. In the same section, robust algorithms of the RCR models are constructed and applied to the loss reserving estimation. Numerical examples of the proposed methods are illustrated in section 4 and our concluding remarks are given in section 5.
2 Random Coefficient Regression Models
In insurance loss reserving applications, the idea of considering constant regression coefficients in successive observations may be questioned. There are cases where the coefficients are random, due to the fact that the claims development vary with accident years. The model of random coefficients has frequently different implications for decision-making problems. While in the ordinary least squares model, a decision affects only the mean, and in the RCR model, it both affects the mean and the variance. Here, we relax the usual regression assumptions by allowing the development factors to be subject to random variations. We consider the model of Hildreth & Houck (Reference Hildreth and Houck1968), where the response coefficients in a general linear model are considered as random variables and the mean of the distribution of these coefficients can be estimated. Some other key references related to random coefficient models are those of Swamy (Reference Swamy1971), Hsiao (Reference Hsiao2003) and Greene (Reference Greene2012).
The multiple linear regression model with random coefficients is given by
 \begin{equation}Y_{i}= \beta_{1i}+\sum_{k= 2}^p\beta_{ki}X_{ki}+\upsilon_{0i}= (\beta_{1}+\upsilon_{1i}) + \sum_{k= 2}^p(\beta_{k}+\upsilon_{ki})X_{ki}+\upsilon_{0i},\end{equation}
where Y is the dependent variable and the X s are the explanatory variables. We assume that for
 $ i= 1, \dots,n $
, the
 $\upsilon_{0i}$
’s are independently distributed with zero mean and constant variance
 $\sigma_{0}^{2}$
, while
 $\beta_{k} $
and
 $\upsilon_{ki}$
are the deterministic and random parts, respectively, with
 $E(\beta_{ki})= \beta_{k}$
, for all i,
 ${\mbox{Var}}(\beta_{ki})={\mbox{Var}}(\upsilon_{ki})= \sigma_{k}^{2}$
, for all i, and
 ${\mbox{Cov}}(\beta_{ki},\beta_{k'i'})={\mbox{Cov}}(\upsilon_{ki},\upsilon_{k'i'})= 0$
for
 $i\neq i'$
and
 $k\neq k'$
, where
 $i'= 1,...,n$
and
 $k'= 1,...,p$
.
Let
 $u_{i}= \upsilon_{0i}+\upsilon_{1i}+\sum_{k= 2}^pX_{ki}\upsilon_{ki}$
as the error term, with
 $E(u_{i})= 0,$
 ${\mbox{Cov}}(u_{i},u_{i'})= 0\ {\rm for}\ i\neq i'$
and
 ${\mbox{Var}} (u_{i})= (\sigma_{0}^{2}+\sigma_{1}^{2})+\sum_{k= 2}^p\sigma_{k}^{2} X_{ik}^{2}= \lambda_{ii} $
, then (1) becomes
 \begin{equation}Y_{i}=\beta_{1}+\sum_{k= 2}^p\beta_{k}X_{ki}+u_{i}.\end{equation}
For n observations, (2) can be written as
 \begin{equation*}\left| \begin{array} {c}Y_{1}\\ \\[-7pt] \vdots\\ \\[-7pt]Y_{n}\\ \\[-7pt] \end{array}\right| =\left| \begin{array} {cccccc}1&X_{11}&...&X_{p-1,1}\\ \\[-7pt] \vdots\\ \\[-7pt] 1&X_{1n}&...&X_{p-1,n}\\ \\[-7pt] \end{array}\right|\left| \begin{array} {c}\beta_{1}\\ \\[-7pt] \vdots\\ \\[-7pt] \beta_{p}\\ \\[-7pt] \end{array}\right|+\left| \begin{array} {c}u_{1}\\ \\[-7pt] \vdots\\ \\[-7pt] u_{n}\\ \\[-7pt] \end{array}\right|,\end{equation*}
or compactly as
 \begin{equation}\textbf{\textit{Y}}= \textbf{\textit{X}}\boldsymbol{\beta} +\textbf{\textit{u}},\end{equation}
where
 $\textbf{\textit{Y}}=(Y_{1},...,Y_{n})^{'}$
is a
 $n\times 1$
vector,
 $\textbf{\textit{X}}$
is a
 $n\times p$
matrix of explanatory variables (design matrix),
 $\boldsymbol{\beta}=(\beta_{1},...,\beta_{p})^{'}$
is a
 $p\times 1$
vector of coefficients and
 $\textbf{\textit{u}}=(u_{1},...,u_{n})^{'}$
is a
 $n\times 1$
vector of errors with
 $E(\textbf{\textit{u}})= 0$
and
 $\boldsymbol{\Lambda} =E(\textbf{\textit{u}}{\textbf{\textit{u}}}^{'})= \mbox{diag}(\lambda_{11},...,\lambda_{nn})$
. The regression coefficients
 $\boldsymbol{\beta}=(\beta_{1},\beta_{2},...,\beta_{p})^{'}$
and their variance are estimated by
 \begin{equation}\widehat{\boldsymbol{\beta}}= (\textbf{\textit{X}}^{'}\boldsymbol{\Lambda}^{-1}\textbf{\textit{X}})^{-1}\textbf{\textit{X}}^{'}\boldsymbol{\Lambda}^{-1}\textbf{\textit{Y}}\ \ \mbox{and} \ \ {\mbox{Var}}(\widehat{\boldsymbol{\beta}})= (\textbf{\textit{X}}^{'}\boldsymbol{\Lambda}^{-1}\textbf{\textit{X}})^{-1}.\end{equation}
But,
 $\boldsymbol{\Lambda}$
is also unknown since
 $\sigma_{k}^{2}$
’s are unknown. Thus, in practice, the estimated regression coefficients in (4) can be obtained by using an estimator of
 $\boldsymbol{\Lambda}$
. Following Hildreth & Houck (Reference Hildreth and Houck1968) we consider the least square residuals
 $ \textbf{\textit{r}} = (r_{1},...,r_{n})^{'} = \textbf{\textit{Y}}-\textbf{\textit{X}}\textbf{\textit{b}}= \textbf{\textit{M}} \textbf{\textit{Y}}= \textbf{\textit{M}} \textbf{\textit{u}}$
, where
 $\textbf{\textit{b}}$
is the least squares estimator of
 $\boldsymbol{\beta}$
, i.e.,
 $\textbf{\textit{b}}= (\textbf{\textit{X}}^{'}\textbf{\textit{X}})^{-1}\textbf{\textit{X}}^{'}\textbf{\textit{Y}}$
and
 $\textbf{\textit{M}}= \{m_{ij}\}_{i,j = 1,..n} = \textbf{\textit{I}}-\textbf{\textit{X}}(\textbf{\textit{X}}^{'}\textbf{\textit{X}})^{-1}\textbf{\textit{X}}^{'}$
. Then we have
 $E(r_{i})= 0$
and
 $ E(r_{i}^{2})= {\mbox{Var}}(r_{i})= \sum_{j= 1}^{n}m_{ij}\lambda_{ij} $
, or in matrix form
 \begin{equation}E(\dot{\textbf{\textit{r}}})= \dot{\textbf{\textit{M}}}\dot{\textbf{\textit{X}}}\dot{\sigma},\end{equation}
where
 $\dot{\textbf{\textit{r}}} = (r _{1}^{2},...,r _{n}^{2})^{'}$
,
 $\dot{\textbf{\textit{M}}}= \textbf{\textit{M}}*\textbf{\textit{M}}= \{m_{ij}^{2}\}_{ i,j= 1,...,n}$
and
 $\dot{\boldsymbol{\sigma}} = (\sigma_{1}^{2},...,\sigma_{p}^{2})^{'}$
. The symbol
 $*$
represents the Hadamard matrix product, i.e., for two matrices
 $\textbf{\textit{A}}= \{a_{ij}\}_{i,j= 1,..n}$
and
 $\textbf{\textit{B}}= \{b_{ij}\}_{i,j= 1,..n}$
,
 $\textbf{\textit{A}}*\textbf{\textit{B}}= \{a_{ij}b_{ij}\}_{i,j= 1,..n}$
. Then (5) can be written as
 \begin{equation}\dot{\textbf{\textit{r}}} = \dot{\textbf{\textit{M}}}\dot{\textbf{\textit{X}}}\dot{\boldsymbol{\sigma}}+\textbf{\textit{w}}=\textbf{\textit{G}} \ \dot{\boldsymbol{\sigma}}+\textbf{\textit{w}}.\end{equation}
The formulation of (6) can be considered as a regression of the ordinary least squares residuals
 $\dot{\textbf{\textit{r}}}$
on
 $\dot{\boldsymbol{\sigma}}$
, where
 $\textbf{\textit{G}} = \dot{\textbf{\textit{M}}}\dot{\textbf{\textit{X}}}$
,
 $E(\textbf{\textit{w}})= 0$
and variance–covariance matrix
 ${\mbox{Cov}}(\textbf{\textit{w}})= E(\textbf{\textit{w}}{\textbf{\textit{w}}}^{'})= 2\dot{\boldsymbol{\Omega}} $
, where
 $ \dot{\boldsymbol{\Omega}} = {\boldsymbol{\Omega}} * {\boldsymbol{\Omega}} $
, with
 ${\boldsymbol{\Omega}}= E(\textbf{\textit{r}}{\textbf{\textit{r}}}^{'})= E(\textbf{\textit{M}}\textbf{\textit{u}}{\textbf{\textit{u}}}^{'}\textbf{\textit{M}})= \textbf{\textit{M}}\boldsymbol{\Lambda} \textbf{\textit{M}}.$
Then, the generalised least squares estimator of
 $\dot{\boldsymbol{\sigma}}$
in (6) is given by (see Hildreth & Houck (Reference Hildreth and Houck1968))
 \begin{equation}\widehat{\dot{\boldsymbol{\sigma}}}= (\textbf{\textit{G}}^{T}\dot{\boldsymbol{\Omega}}^{-1}\textbf{\textit{G}})^{-1}\textbf{\textit{G}}^{T}\dot{\boldsymbol{\Omega}}^{-1}\dot{\textbf{\textit{r}}},\end{equation}
where
 $\widehat{\dot{\boldsymbol{\Omega}}}= \widehat{\boldsymbol{\Omega}}*\widehat{\boldsymbol{\Omega}}, \ \mbox{with} \ \widehat{\boldsymbol{\Omega}}= \textbf{\textit{M}}\widehat{\boldsymbol{\Lambda}}\textbf{\textit{M}}$
and
 $\widehat{\boldsymbol{\Lambda}}= \mbox{diag}(\hat{\lambda}_{11},...,\hat{\lambda}_{nn}),$
with
 \begin{equation}\hat{\lambda}_{ii}= \hat{\sigma}_{1}^{2}+\sum_{k}^{p}\hat{\sigma}_{k}^{2}X_{ki}^{2}.\end{equation}
2.1 Actual response coefficients in a purely random coefficient model
Sometimes, it is useful to predict the individual component of the actual response coefficients
 $\beta_{i}$
that provides information about the behaviour of each individual claim. Griffiths (Reference Griffiths1972) derived the minimum variance and linear unbiased estimators for the actual response coefficients, and has shown that the best estimator of the actual response coefficients is not identical to the best estimator of the mean response coefficients.
The vector
 $\boldsymbol{\beta}$
in (3) contains the mean response coefficients and the actual response coefficients given by
 \begin{equation}\textbf{\textit{b}}=\textbf{\textit{L}}\boldsymbol{\beta}+ \textbf{\textit{v}},\end{equation}
where
 $\textbf{\textit{L}}^{'}$
is a
 $p\times np$
matrix,
 $\textbf{\textit{b}}^{'}$
and
 $ \textbf{\textit{v}}^{'} $
are
 $1\times np$
vectors defined, respectively, as
 \begin{equation*} \textbf{\textit{L}}^{'}=\left| \begin{array} {cccccc}1 \ 1..\ 1& & & & & \\& 1 \ 1...\ 1&&& &\\&&\ddots&&& \\&&&&& 1 \ 1...\ 1\\ \end{array}\right|,\end{equation*}
 \begin{equation*}\textbf{\textit{b}}^{'}=(\textbf{\textit{b}}^{'}_{1},\textbf{\textit{b}}^{'}_{2},...,\textbf{\textit{b}}^{'}_{p}), \ \mbox{with} \ \ \textbf{\textit{b}}_{k}=(b_{1k},b_{2k},...,b_{nk})^{'}\end{equation*}
and
 \begin{equation*}\textbf{\textit{v}}^{'}=(\textbf{\textit{v}}^{'}_{1},\textbf{\textit{v}}^{'}_{2},...,\textbf{\textit{v}}^{'}_{p}),\ \mbox{with} \ \ \textbf{\textit{v}}_{k}=(v_{1k},v_{2k},...,v_{nk})^{'} .\end{equation*}
Then, we obtain
 \begin{equation*}\textbf{\textit{V}}=E(\textbf{\textit{v}}{\textbf{\textit{v}}}^{'})=\left| \begin{array} {cccccc}\sigma_{11}\textbf{\textit{I}} & & & & & \\&\sigma_{22}\textbf{\textit{I}} &&& &\\&&\ddots&&& \\&&&&& \sigma_{pp}\textbf{\textit{I}}\\ \end{array}\right|.\end{equation*}
If
 $\textbf{\textit{X}}_{k}=diag(X_{1k},X_{2k},...,X_{nk})$
and
 $\textbf{\textit{Z}}$
a
 $n\times np$
matrix defined as
 $\textbf{\textit{Z}}=(\textbf{\textit{X}}_{1},\textbf{\textit{X}}_{2},..., \textbf{\textit{X}}_{p}) $
, then
 \begin{equation*}\textbf{\textit{u}}=\textbf{\textit{Z}}\textbf{\textit{v}} \ \ \mbox{and}\ \ \boldsymbol{\Lambda}= E(\textbf{\textit{u}}{\textbf{\textit{u}}}^{'})=\textbf{\textit{Z}} \textbf{\textit{V}} \textbf{\textit{Z}}^{'}.\end{equation*}
Following Griffiths (Reference Griffiths1972), the estimates of the disturbances associated with the kth coefficient can be written as
 $ \hat{\textbf{\textit{v}}}_{k}=\sigma_{kk}\textbf{\textit{X}}_{k}\boldsymbol{\Lambda}^{-1}\hat{\textbf{\textit{u}}}, $
or compactly as
 \begin{equation*}\hat{\textbf{\textit{v}}} =\textbf{\textit{V}} \textbf{\textit{Z}}_{k}\boldsymbol{\Lambda}^{-1}\hat{\textbf{\textit{u}}}. \end{equation*}
Thus, we can obtain an estimator of
 $\textbf{\textit{b}}$
as
 \begin{eqnarray*}\hat{\textbf{\textit{b}}} = \textbf{\textit{L}} \hat{\boldsymbol{\beta}} +\hat{\textbf{\textit{v}}} = \textbf{\textit{L}}(\textbf{\textit{X}}^{'}\boldsymbol{\Lambda}^{-1}\textbf{\textit{X}})^{-1}\textbf{\textit{X}}^{'} \boldsymbol{\Lambda}^{-1}\textbf{\textit{Y}}+\textbf{\textit{V}}\textbf{\textit{Z}}^{'}\boldsymbol{\Lambda}^{-1}\hat{\textbf{\textit{u}}}, \end{eqnarray*}
which via
 $ \hat{\textbf{\textit{u}}}=[\textbf{\textit{I}}-\textbf{\textit{X}}(\textbf{\textit{X}}^{'}\boldsymbol{\Lambda}^{-1}\textbf{\textit{X}})^{-1} \textbf{\textit{X}}^{'}\boldsymbol{\Lambda}^{-1}]\textbf{\textit{Y}} $
leads to the following linear expression:
 \begin{equation}\hat{\textbf{\textit{b}}} = \textbf{\textit{L}}(\textbf{\textit{X}}^{'}\boldsymbol{\Lambda}^{-1}\textbf{\textit{X}})^{-1}\textbf{\textit{X}}^{'} \boldsymbol{\Lambda}^{-1}+\textbf{\textit{V}}\textbf{\textit{Z}}^{'}\boldsymbol{\Lambda}^{-1}[\textbf{\textit{I}}-\textbf{\textit{X}}(\textbf{\textit{X}}^{'}\boldsymbol{\Lambda}^{-1}\textbf{\textit{X}})^{-1} \textbf{\textit{X}}^{'}\boldsymbol{\Lambda}^{-1}]\textbf{\textit{Y}}= \textbf{\textit{Q}} \textbf{\textit{Y}}\end{equation}
and the variance of
 $\textbf{\textit{b}}$
as
 \begin{eqnarray*}Var(\hat{\textbf{\textit{b}}}) &=& \textbf{\textit{Q}} \boldsymbol{\Lambda} \textbf{\textit{Q}}^{'} - \textbf{\textit{Q}} \textbf{\textit{Z}} \textbf{\textit{V}} - \textbf{\textit{V}} \textbf{\textit{Z}}^{'} \textbf{\textit{Q}} + \textbf{\textit{V}} .\end{eqnarray*}
2.2 Random coefficients regression in loss reserving procedures
A run-off triangle can be divided into cells, where each cell is the corresponding payment arising from a specific accident year
 $i \in \{ 1, \cdots, n\}$
(rows) and a development year
 $j \in \{ 1, \cdots, n\}$
(columns). The accident year shows the losses that occurred during a specific period, while the development year specifies after how many years the reported claim is getting settled.
The calendar year k is the diagonal element of the triangle and is defined as
 $k = i + j$
, with
 $k \in \{ 1,2, \cdots, n\}$
. Then,
 $Y_{ij}$
is defined as the total incremental payments in accident year i with development year j, where
 $i + j \leq n$
as the calendar
 $i + j > n$
has not occurred yet. Some reserving methods use the cumulative payments
 $S_{in} = \sum_{j=1}^{n}{Y_{ij}}$
. Let
 $D_n$
denote the information available in calendar year n (the upper part of the triangle)
 \[D_n = \{ Y_{ij}, i+j \leq n \} = \{ S_{ij}, i+j \leq n \}. \]
For accident year i, we want to get the best estimate for the total amount of payment, given the information
 $D_n$
, i.e.,
 \[\widehat{S}_{i\infty}^{n-i} = \lim_{j \to \infty} E[S_{ij}| D_n ] = E[S_{i\infty} |D_n],\]
and the difference with the payment made in calendar year n gives the required reserve
 \[ \widehat{R}_{i} = \widehat{S}_{i\infty}^{n-i} - {S}_{i,n-i+1}. \]
Finally, an interesting quantity is the (ultimate) uncertainty, which is the variance of the total amount of payment
 $ Var( S_{i\infty} | D_n )$
or
 $Var( \widehat{S}_{i\infty}^{n-i} )$
. In our examples, we make the assumption that all claims have a lifetime of n years. After n years all claims have been settled, which means that
 $Y_{ij} = 0$
for each
 $j = n + 1, n + 2, \dots$
The RCR model defined in (1) can also be written, in connection with Figure 1, as
Run-off triangle of paid claims.

 \begin{equation*}\left| \begin{array} {c}Y_{1,\leq n }\\\vdots\\Y_{n,\leq 1}\\ \end{array}\right| \ =\left| \begin{array} {cccccc}1&X_{11}&...&X_{p-1,1}\\\vdots\\1&X_{1n}&...&X_{p-1,n}\\ \end{array}\right|\left| \begin{array} {cc}\beta_{1}\\\vdots\\\beta_{p}\\ \end{array}\right|+\left| \begin{array} {cccccc}\textbf{\textit{X}}_{1}^{'}&0&\dots& 0 \\\vdots&\ddots&&\vdots\\0&0&\dots&\textbf{\textit{X}}_{n}^{'}\\ \end{array}\right|\left| \begin{array} {c}{\boldsymbol{\upsilon}}_{1}\\\vdots\\{\boldsymbol{\upsilon}}_{n}\\ \end{array}\right|, \end{equation*}
or compactly as
 \begin{equation}\textbf{\textit{Y}}= \textbf{\textit{X}}\boldsymbol{\beta} + \textbf{\textit{D}}_{x}{\boldsymbol{\upsilon}},\end{equation}
where
-
(i)
 $\textbf{\textit{Y}}=(Y_{1,\leq n}, Y_{2,\leq n-1}, ...,Y_{n, \leq 1})^{'}$
is the
$[n(n+1)/2]\times 1$
vector of the past and present incremental claims in the upper triangle,
-
(ii)
$\textbf{\textit{X}}=(\textbf{\textit{X}}_{1}^{'},...,\textbf{\textit{X}}_{n}^{'})^{'}$
is a
$n(n+1)/2\times p$
design matrix, with
$p=2n-1$
, reflecting the position of incremental claims in Table 1, -
(iii)
$\boldsymbol{\beta}=(\beta_{1},...,\beta_{p})^{'}$
, with
$p=2n-1$
unknown parameters, -
(iv)
$\textbf{\textit{D}}_{x}$
is a block diagonal matrix of
$\textbf{\textit{X}}_{i}^{'}s$
, with
$\textbf{\textit{X}}_{i}^{'}$
being the ith row of
X
, -
(v)
${\boldsymbol{\upsilon}} = ({\boldsymbol{\upsilon}} _{1}^{'}, ...,{\boldsymbol{\upsilon}} _{n}^{'})^{'}$
is a
$[n(n+1)/2]\times 1$
vector, with
${\boldsymbol{\upsilon}} _{i} = (\upsilon _{1i}, ...,\upsilon _{ni})^{'}$
.


Remark 1. The magnitude of p depends on the choice of the appropriate design matrix that reflects the position of the claims in the run-off triangle (see Christofides (Reference Christofides1997)).
3 Robust Estimation and Identification of Outliers
Most of the insurance data include claim size distributions with long tail. Robust regression techniques are complementary tools for the ordinary least squares estimation when the errors do not satisfy the normality condition due to large deviations or outlier observations.
Outliers are observations that may be caused by exceptional events (e.g. a catastrophic event). Therefore, outliers can be described as points, which do not follow the trend of the majority of data. The problem occurs when a trend (due to an outlier) that appeared in one of the first accident years of a chain-ladder model carried on for the next years, resulting in an overestimation or underestimation of the reserves. In order to remedy the effect of outliers, we can use robust statistics.
3.1 M estimators
A statistical procedure is called robust, if it is insensitive to the occurrence of gross errors in the data. M estimators are a generalisation of Maximum Likelihood (ML) estimators. Instead of minimising the sum of scores
 $\log f(x,\theta)$
as in the ML estimation, a more general function
 $\rho(x,\theta)$
is allowed (see Huber (Reference Huber1981)). M estimators as solutions of the following minimisation problem:
 \begin{equation*}\text{min}\sum_{i= 1}^{n}\rho\bigg(\frac{r_{i}}{S}\bigg),\end{equation*}
where
 $\rho(.)$
is a symmetric function with unique minimum at zero,
 $r_{i}$
is the ith residual and S is a scale parameter. Differentiating this expression with respect to the regression coefficients
 $\boldsymbol{\beta}$
yields,
 \begin{equation*}\sum_{i= 1}^{n}\psi\bigg(\frac{r_{i}}{S}\bigg)\textbf{\textit{x}}_{i}=\textbf{0}, \end{equation*}
where
 $\psi(.)$
is the derivative of
 $\rho(.)$
and
 $\textbf{\textit{x}}_{i}$
is the row vector of explanatory variables of the ith case. In practice, it is advisable to use
 $S = med{|r_{i}|}$
as an initial value. The advantage of M estimators is that they can be computed in much less time than other robust estimators. The disadvantage is that they are sensitive to high leverage points and they do not enjoy high breakdown point (see Rousseeuw & Leroy (Reference Rousseeuw and Leroy1987)).
3.2 MM estimators
The MM estimators proposed by Yohai (Reference Yohai1987) have high breakdown point and high efficiency when the errors are normally distributed. The MM estimators are defined in a three-stage procedure (see Maronna et al. (Reference Maronna, Martin and Yohai2006)) as follows:
-
(i) Compute an initial estimate
$\widehat{\boldsymbol{\beta}}_{0}$
of
$\boldsymbol{\beta}$
in (3). This estimate is consistent with high breakdown point and possibly low normal efficiency. -
(ii) Compute an M estimate of the form
where
\begin{equation*} L(\boldsymbol{\beta})= \frac{1}{n}\sum_{i= 1}^{n}\rho\bigg(\frac{r_{i}}{S}\bigg)=0.5, \end{equation*}
$\rho(.)$
is as defined before.
-
(iii) Find a solution
$\widehat{\boldsymbol{\beta}}$
of the relation using an iterative procedure starting with the initial estimate
\begin{equation*} \frac{1}{n}\sum_{i= 1}^{n}\psi\bigg(\frac{r_{i}}{S}\bigg)\textbf{\textit{x}}_{i}=\textbf{0}, \end{equation*}
$\widehat{\boldsymbol{\beta}}_{0}$
.


3.3 Robust functions
Robust functions can be constructed for location and scale parameters, and they can also be used in robust regression. In the following, we present some robust functions that are going to be used to robustify our models. These functions have the advantage of combining robustness with efficiency under the regression model with normal errors (see Huber (Reference Huber1981) and Hampel et al. (Reference Hampel, Ronchetti, Rousseeuw and Stahel1986)).
3.3.1 Huber function
The family of Huber functions is defined as
 \begin{eqnarray} & \rho_k(x) = \begin{cases} \frac{1}{2}x^2, & \text{if } |x| \leq k, \\ k\Big(|x| - \frac{k}{2}\Big) , & \text{if } |x| > k, \nonumber \\\end{cases} \\ & \psi_k(x) = \begin{cases} x, & \text{if } |x| \leq k, \\ k\; sign(x) , & \text{if } |x| > k.\end{cases} \end{eqnarray}
The value k is called a tuning constant. Note that smaller values of k produce more resistance to outliers, but at the expense of lower efficiency when the errors are normally distributed. The tuning constant is generally picked to give reasonably high efficiency in the normal case. In particular,
 $k= 1.345$
gives 95% efficiency at the normal model, and still offer protection against outliers.
3.3.2 Hampel function
The Hampel family of functions is defined as
 \begin{align} \rho_{a,b,r}(x) &= \begin{cases} \frac{1}{2}x^2/C, & \text{if } |x| \leq a, \\ \\[-7pt] \big[\frac{1}{2} a^2 + a(|x| - a)\big] \ / \ \big[\frac{a}{2} ( b - a + r)\big], & \text{if } a< |x| \leq b, \\ \\[-7pt] \frac{a}{2} \big[ 2b - a + \big(|x|-b\big)\big( 1 + \frac{r-|x|}{r-b} \big) \big] \ / \ \big[\frac{a}{2} ( b - a + r)\big] , & \text{if } b< |x| \leq r, \\ \\[-7pt] 1, & \text{if } r<|x|, \nonumber \\\end{cases} \\ \psi_{a,b,r}(x) &= \begin{cases} |x|\; sign(x) , & \text{if } |x| \leq a, \\ \\[-7pt] a\; sign(x) , & \text{if } a < |x| \leq b, \\ \\[-7pt] a\ \frac{r-|x|}{r-b} \ sign(x), & \text{if } b < |x| \leq r, \\ \\[-7pt] 0, & \text{if } r<|x|,\end{cases} \end{align}
where the slope of the redescending part
 $ (x \in (b, r]) $
is set to
 $ -1/2 $
, i.e.,
 $ r = 2a + b $
. Then values
 $ a=2 $
,
 $ b=4 $
,
 $ r=8 $
give the desired efficiency. Note that
 $ \psi_{a,b,r}(x) $
can also be tuned to have a downward slope of
 $ -1/3 $
(see Koller and Stahel (Reference Koller and Stahel2011)), where
 $ a=1.353 $
,
 $ b=3.157 $
,
 $ r=7.216 $
give 95% efficiency at the normal.
3.3.3 Bisquare function
Tukey’s bisquare family of functions is defined as
 \begin{equation} \rho_k(x) = \begin{cases} 1 - \Big[1 - \Big(\frac{x}{k}\Big)^2\Big]^3, & \text{if } |x| \leq k, \\ 1 , & \text{if } |x| > k,\end{cases} \end{equation}
 \begin{equation} \psi_k(x) = \begin{cases} x\Big[1-\Big(\frac{x}{k}\Big)^2\Big]^2 , & \text{if } |x| \leq k, \\ 0 , & \text{if } |x| > k.\end{cases} \end{equation}
For
 $k= 4.685$
, the regression estimator produce 95% efficiency at the normal.
The aforementioned robust functions are included in various R packages such as the “MASS” (2002), the “robust” (2020) and the “robustbase” (2020) packages. More specifically with the rlm function of “MASS” package, we can fit a robust linear regression model using M and MM estimators based on the chosen method argument (M by default). Also, by entering only the intercept into the model formula, this function returns the M estimator of location (Huber by default). Moreover, the robust (psi) functions (12), (13) and (15) can be specified by an argument psi with possible values psi.huber, psi.hampel and psi.bisquare, respectively. For more details on robust statistical methods with R, the reader may be referred to Jurečková et al. (Reference Jurečková, Picek and Schindler2019).
3.4 Algorithms for robust estimation of the random coefficients regression model
We present the steps that are required to obtain the robust M and MM estimation of the purely RCR model as it was presented in section 2.1. The algorithm is slightly different than the algorithm presented in Pitselis (Reference Pitselis2014). Also, an additional step is added (Step 5) in the case we want to obtain the robust estimation of the actual response RCR model in (10).
3.4.1 Algorithm for M estimation
-
Step 1: Following Huber & Dutter (Reference Huber, Dutter, Bruckman, Ferschl and Schmetterer1974), we can obtain M estimators of
$\boldsymbol{\beta}$
in (3), as solutions of the following minimisation form: (16)where
\begin{equation}Q(\boldsymbol{\beta},S)=\frac{1}{n}\sum_{i=1}^n \left[\rho \left(\frac{Y_i-f_{i} ({\boldsymbol{\beta}})}{S}\right)+A \right]S \rightarrow \text{min},\end{equation}
$f_{i}(\boldsymbol{\beta})=\sum_{j=0}^{p} x_{ij}\beta_{j}$
, with
$\rho (0)=0$
and
$A>0$
. Differentiating (16) with respect to
$\boldsymbol{\beta}$
and S we obtain where
\begin{equation*}\frac{1}{n}\sum_{i=1}^n\psi \left(\frac{r_{i}}{S}\right)\frac{\partial f_{i}(\hat{\boldsymbol{\beta}})}{\partial\beta_{j}}=0 \ \ \ \mbox{and} \ \ \frac{1}{n}\sum_{i=1}^n\chi \left(\frac{r_{i}}{S}\right)=A \ , \end{equation*}
$r_{i}=X_{i}-f_{i}(\boldsymbol{\beta}) \ ,$
with
$\psi (t)=\rho '(t) \ \ \mbox{and} \ \ \chi (t)=t\psi (t)-\rho (t).$
Note that
$\chi (t)$
has an absolute minimum at
$t=0$
, namely,
$\chi (0)=0$
. We also assume that
$\psi$
and
$\chi$
are continuous. In order to obtain consistency of the scale estimator in the normal model and to recapture the classical estimators for the classical choice
$\rho (t)=\frac{1}{2}t^2$
, we take (see Huber Reference Huber1981): where
\begin{equation*}A =\frac{(n-p-1)}{n}E_{\Phi}(\chi), \end{equation*}
$E_{\Phi}$
denotes the expectation taken with respect to a normal distribution.
-
Step 2: Based on robust estimate of
$\boldsymbol{\beta}$
and scale S obtained in step 1, winsorize the residuals: and obtain
\begin{equation*}r_{i}^{^{R}}= \begin{cases}\psi \left( \frac{r_i}{S} \right) S, & \text{for } \ r_{i}<-cS, \\ \\[-7pt] r_{i}, & \text{for } |r_{i}|\leq cS, \\ \\[-7pt] cS, & \text{for } r_{i}> cS,\end{cases} \end{equation*}
$\dot{\textbf{\textit{r}}}^{R}=\textbf{\textit{r}}^{R}*\textbf{\textit{r}}^{R}$
with
$\textbf{\textit{r}}^{R}=(r_{1}^{R},...,r_{n}^{R})^{'}$
as in (5).
-
Step 3: Estimate the coefficients
$\dot{\boldsymbol{\sigma}}$
in the regression setting (6), i.e., and obtain
\begin{equation*}\dot{\textbf{\textit{r}}}^{R} = \dot{\textbf{\textit{M}}}\dot{\textbf{\textit{X}}}\dot{\boldsymbol{\sigma}}+\textbf{\textit{w}}=\textbf{\textit{G}} \ \dot{\boldsymbol{\sigma}}+\textbf{\textit{w}}, \end{equation*}
where
\begin{equation*}\widehat{\dot{\boldsymbol{\sigma}}}= (\textbf{\textit{G}}^{T}(\dot{\boldsymbol{\Omega}}^{R})^{-1}\textbf{\textit{G}})^{-1}\textbf{\textit{G}}^{T}(\dot{\boldsymbol{\Omega}}^{R})^{-1}\dot{\textbf{\textit{r}}}^{R},\end{equation*}
and
\begin{equation*}\widehat{\dot{\boldsymbol{\Omega}}^{R}}= \widehat{{\boldsymbol{\Omega}}^{R}}*\widehat{{\boldsymbol{\Omega}}^{R}}, \ \ \ \mbox{with}\ \ \ \widehat{{\boldsymbol{\Omega}}^{R}}= \textbf{\textit{M}}\widehat{\boldsymbol{\Lambda}^{R}}\textbf{\textit{M}}, \end{equation*}
$\widehat{\boldsymbol{\Lambda}^{R}}= \mbox{diag}(\hat{\lambda}_{11},...,\hat{\lambda}_{nn}),$
with
$\hat{\lambda}^{R}_{ii}= \hat{\sigma}_{1}^{2}+\sum_{k}^{p}\hat{\sigma}_{k}^{2}X_{ki}^{2}$
.
-
Step 4: Then the robust estimator of
$\widehat{\boldsymbol{\beta}}$
in (4) and scale
$S_2$
can be obtained by the following minimisation problem: where
\begin{equation*}Q(\beta,S_{2})= (1/n)\sum_{i= 1}^{n}\left\{\rho\left[\widehat{\lambda}_{ii}^{1/2}[Y_{i}-f_{i}(\boldsymbol{\beta})]/S_{2}\right]+a_2 \right\} S_{2} , \end{equation*}
$a_{2}= [(n-p)/n]E_{\Phi}(\chi)$
, with
$E_{\Phi}$
and
$\rho(.)$
as defined before.
-
Step 5: To obtain a robust estimator
$\textbf{\textit{b}}^{R}$
of the actual response
$\textbf{\textit{b}} $
in (9), we substitute the non-robust estimators by the robust ones, i.e., where the elements of
\begin{equation*}\hat{\textbf{\textit{b}}^{R}} = \textbf{\textit{L}} \hat{\boldsymbol{\beta}}^{R} +\boldsymbol{\Lambda}^{R}\textbf{\textit{Z}}^{'}(\boldsymbol{\Lambda}^{R})^{-1}\hat{\textbf{\textit{u}}}^{R}, \end{equation*}
$\textbf{\textit{u}}^{R}=(\hat{u}_{i}^{R},\hat{u}_{2}^{R},...,\hat{u}_{n}^{R})^{'}$
are the winsorized residuals as in Step 2,
\begin{equation*}\hat{u}_{i}^{R} = S\psi\bigg(\frac{u_{i}}{S}\bigg), \ \ \ i=1,2,...,n. \end{equation*}


3.4.2 Algorithm for MM estimation
The algorithm for obtaining the MM estimation of the RCR model is similar to the algorithm for the M estimation, except for Steps 1 and 4, which are now replaced by the three-stage MM estimation, defined in section 3.3, as a modified version of the iterated weighted least squares algorithm used for the M estimation (see Huber (Reference Huber1981) and Yohai (Reference Yohai1987)). The MM estimation is based on bisquare
 $\rho$
function given in (14).
Besides the M estimators and the MM estimators, there are a lot of other robust estimators, which can be applied to the RCR model. Each time, the appropriateness of a robust estimator depends on how much of our data are contaminated, the efficiency of the regression estimators that we would like to obtain and how the appearance of outlier events depends on the design matrix of the regression model. For more details on these estimators, the reader may be referred among others to Hampel et al. (Reference Hampel, Ronchetti, Rousseeuw and Stahel1986), Rousseeuw & Leroy (Reference Rousseeuw and Leroy1987), Yohai & Zamar (Reference Yohai and Zamar1997), Gervini & Yohai (Reference Gervini and Yohai2002) and Maronna et al. (Reference Maronna, Martin and Yohai2006).
Remark 2. In general, when the design matrix consists of dummy variables, M estimation shows a consistency on the expected ultimate losses and reserves in the presence of artificial extreme events and performs slightly better than the MM estimation. This may be due to the fact that estimators, which are robust to outliers of the design matrix (e.g. the MM estimators), in addition to dependent variables, they can also robustify independent variables (in our case these are fixed dummy variables).
Remark 3. The excess of reserves (bias) that appeared due to the robustification of our RCR model can be distributed equivalently to all accident years ultimate reserves, or according to expert recommendations. Parameter estimators from robust approaches are asymptotically biased, when error distributions are not symmetric. Treatment of bias appearing into the robustified model is necessary. In this spirit, Wang et al. (Reference Wang, Lin and Zhu2005) proposed a distribution-free method for correcting this bias.
4 Numerical Illustrations
In this section, we apply the robust non-random and random linear regression models, first, to the widely used dataset of Taylor & Ashe (Reference Taylor and Ashe1983), and second, to a recent dataset from the motor business line of a non-life insurance company of the Greek insurance industry. The datasets are presented in Appendices A and B.
For the applications that follow with both datasets, we use the model of Christofides (Reference Christofides1997), expressed under the RCR formulation (11). The same model can also be embedded within the quantile regression framework, as presented in Badounas and Pitselis (Reference Badounas and Pitselis2020) for longitudinal data. After dealing with different design matrices, we selected a model, which incorporates 12 independent variables (without intercept), assuming a linear relationship for the parameters of development periods with the same slope, defined by
 \begin{equation*}Y_{ij} = a_{i} +d_{j} +\epsilon_{ij}, \ \ \ \mbox{for} \ \ i, \ j \ \ \mbox{from} \ 1 \ \mbox{to} \ 10,\end{equation*}
where
 $d_{0}=d$
,
 $d_{j}=s\times j$
, for
 $j>1$
and
 $\epsilon_{ij}$
is the error term.
Next, we provide estimations with fixed and RCR methods for the ultimate reserves of each accident year, as well as for the total ultimate reserves in the absence and presence of outliers. The robust M and MM estimation with fixed and random coefficients was implemented into the R statistical software (2020), as a combination of own RCR procedures with the rlm function of “MASS” package.
4.1 Claims data from Taylor and Ashe (Reference Taylor and Ashe1983)
First, we have to investigate if data are contaminated by outlying observations, which may have a large impact on the least squares estimates and consequently in the loss reserving estimation. This can be achieved by using diagnostic plots, such as the Q–Q plot and the plot of standardised residuals versus fitted values. Second, in order to study the impact of outlying values, we create one and two artificial outliers, just by multiplying one or two observations of Taylor and Ashe data by
 $\textbf{10}$
, a technique that has been used in similar studies (see Verdonck et al. (Reference Verdonck, Van Wouwe and Dhaene2009), Verdonck and Debruyne (Reference Verdonck and Debruyne2011), Pitselis et al., (Reference Pitselis, Grigoriadou and Badounas2015)).
4.1.1 Original data
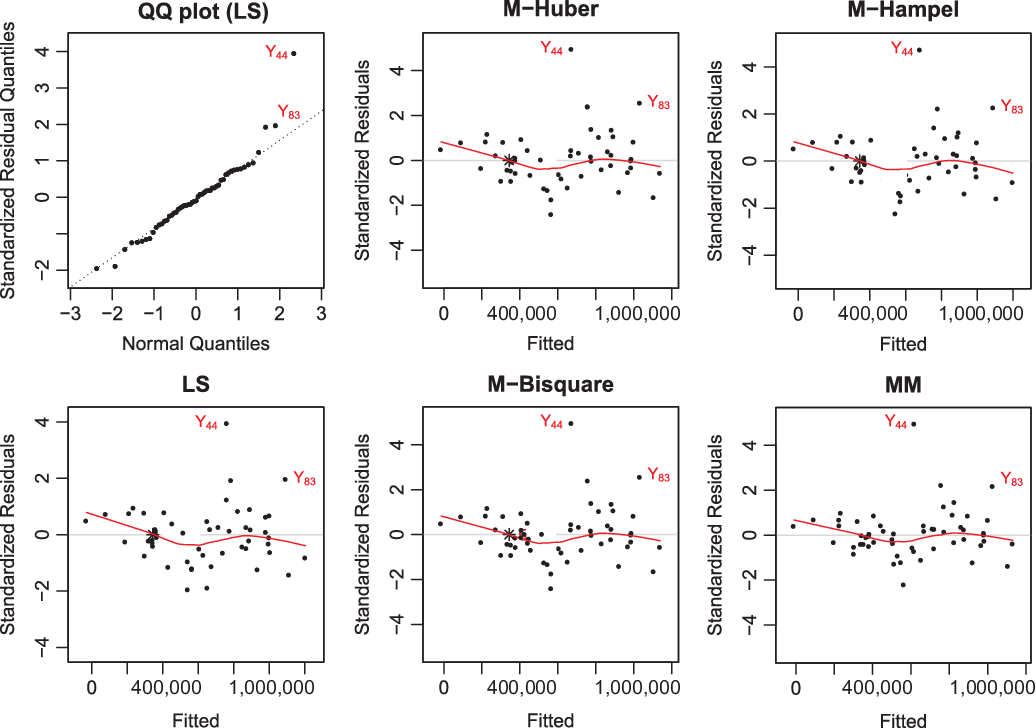
Applying the least squares estimation with the original data, the Q–Q plot of standardised residuals versus the normal quantiles and the standardised residuals versus fitted values in Figure 2 (left panels) show that the observation
 $Y_{44}$
(which corresponds to the accident year 4 and development year 4) is an outlier event. The same is evident from the standardised residuals versus fitted values for the robust M and MM estimation (middle and right panels), which also identify observation
 $Y_{44}$
as an outlier.
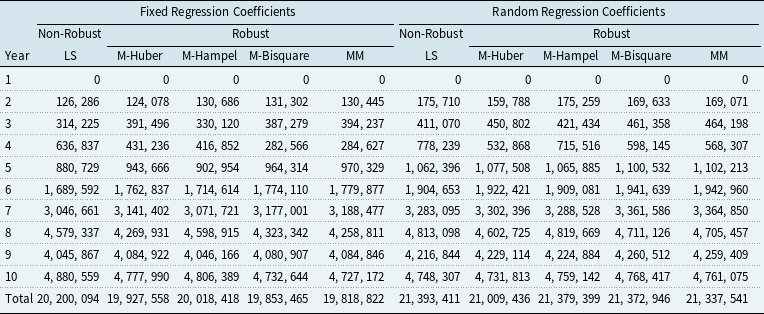
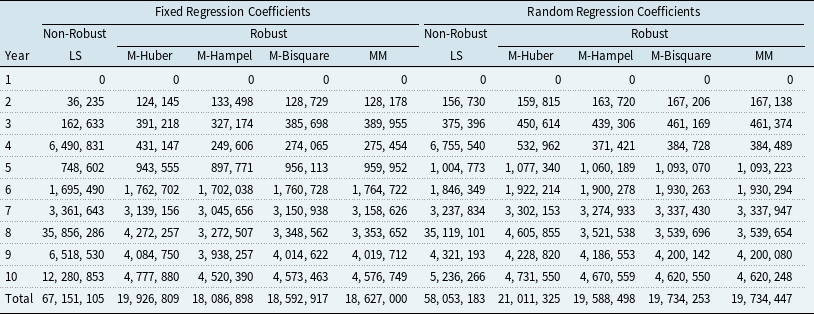
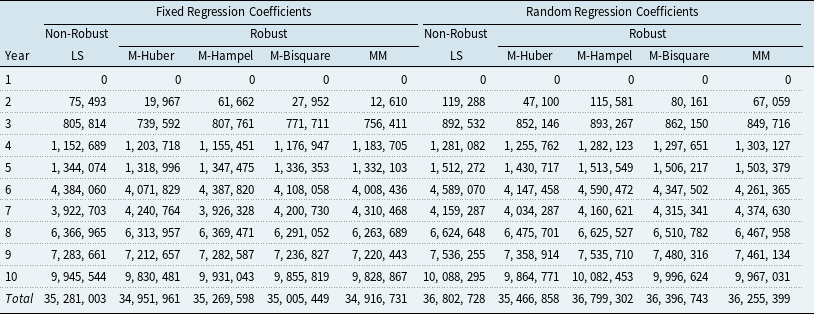
The left panel of Table 1 shows the values of overall reserves based on least squares (LS) estimation, M estimation (Huber, Hampel, Bisquare functions) and MM estimation using the original data. In the last row, we observe that the values of total reserves based on robust estimations are slightly different (smaller) than the value of total reserves based on least squares estimation with fixed coefficient and this is due to the robustification of the outlier event
 $Y_{44}$
.
In the sequel, applying regression and robust regression models with random coefficients (right panel, last row of Table 1), we observe an increase of the total reserves, in comparison with total reserves obtained with fixed coefficients, which is due to the involvement of the weights
 $\widehat{\lambda}_{ii}$
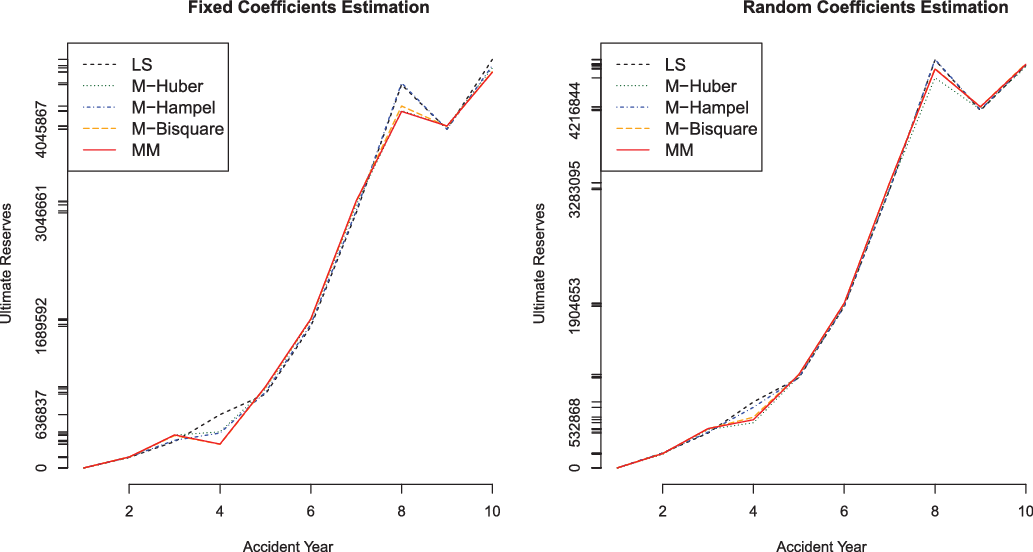
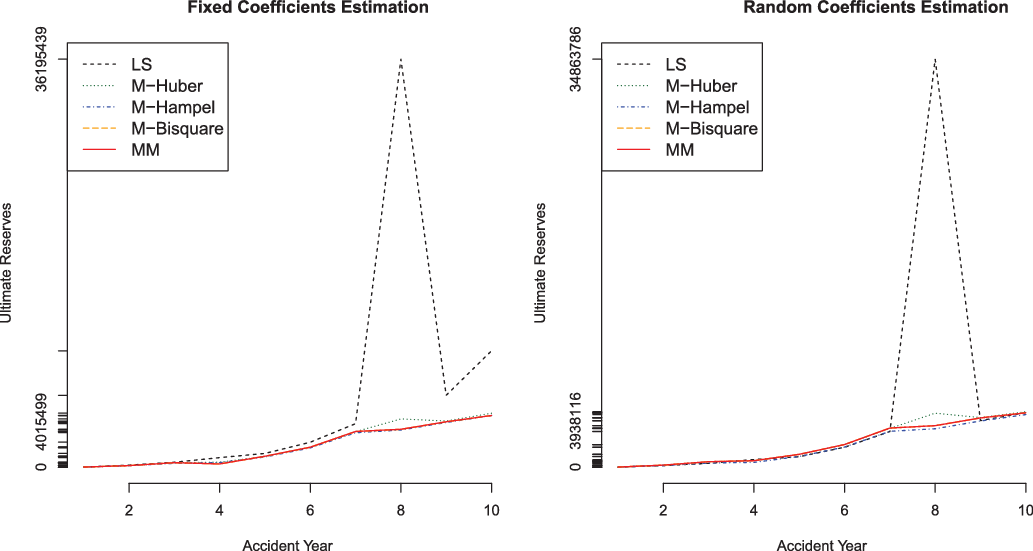
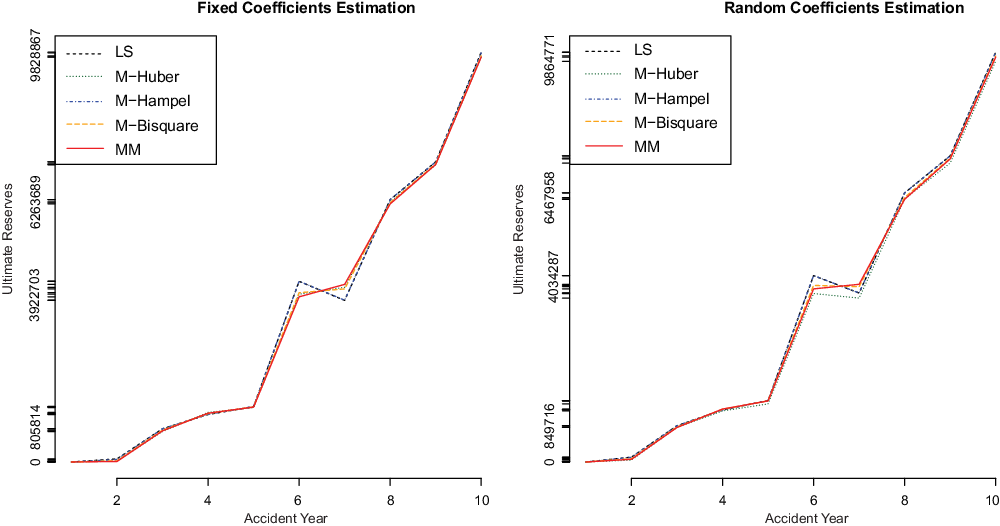
in (8). Also, Figure 3 indicates that the values of ultimate reserves show a similar behaviour across each accident year, except for some small fluctuations in fixed coefficients estimation for year 4 and between years 7 and 8.
Taylor and Ashe original data: Diagnostic plots for non-robust LS estimation (left panels) and robust M and MM estimation (middle and right panels).

Estimated ultimate reserves against year with fixed coefficients (left panel) and random coefficients (right panel) robust regression models – Taylor and Ashe original data.

Ultimate reserves per accident year – Taylor and Ashe original data.

4.1.2 One artificial outlier
In order to create an artificial outlier, we multiply the observation
 $Y_{83}$
by
 $\textbf{10}$
, i.e.,
 $Y_{83}=14{,}433{,}70\textbf{0}$
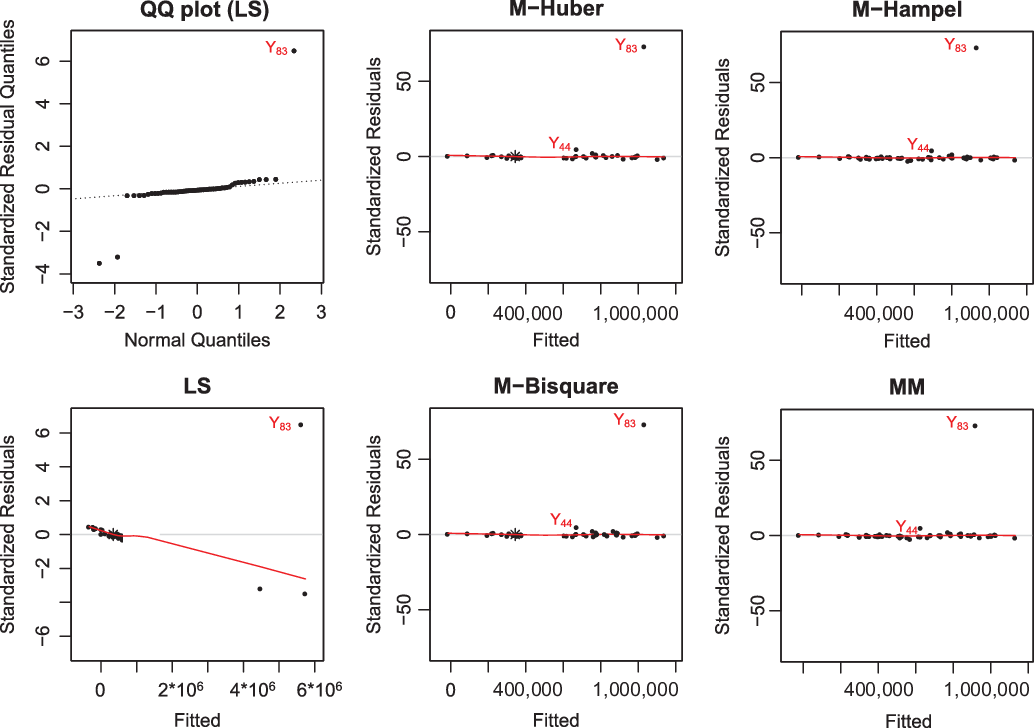
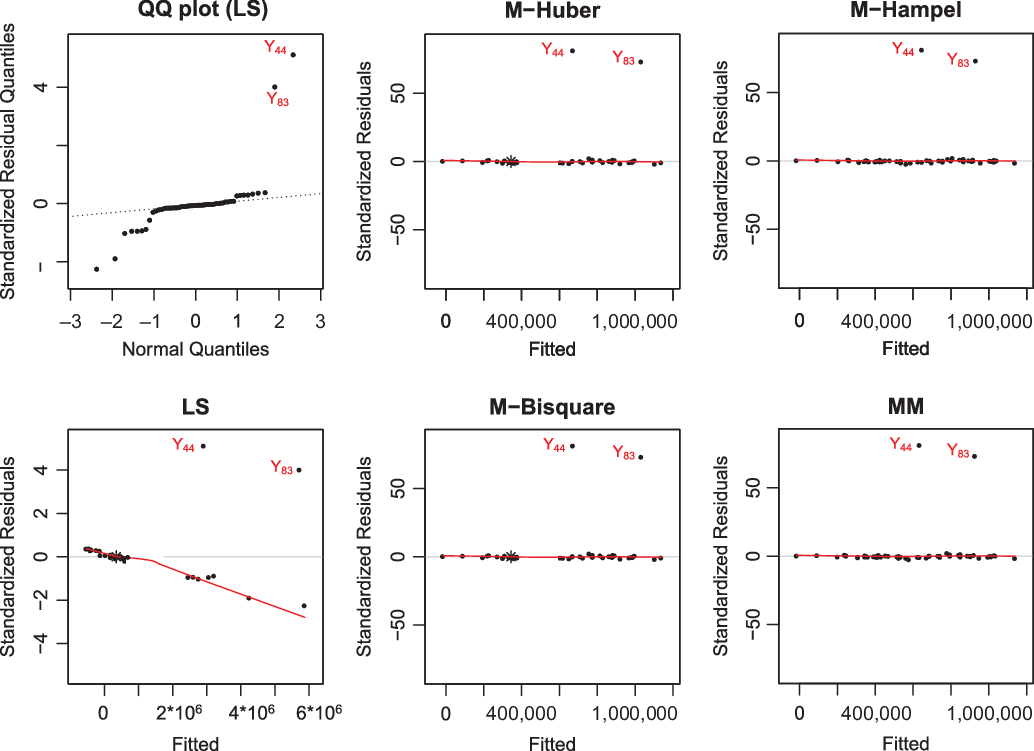
(which corresponds to accident year 8 and development year 3). Figure 4 displays residual diagnostics in the presence of one artificial outlier for the non-robust LS and robust M and MM estimation. We can easily observe that claims
 $Y_{83}$
is identified as an outlier.
In the presence of one artificial outlier (
 $Y_{83}$
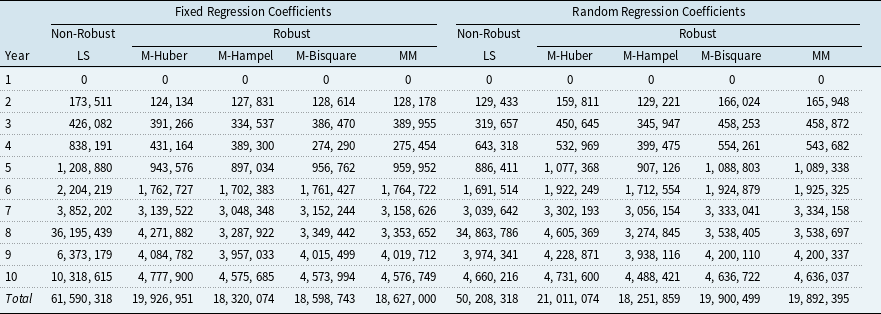
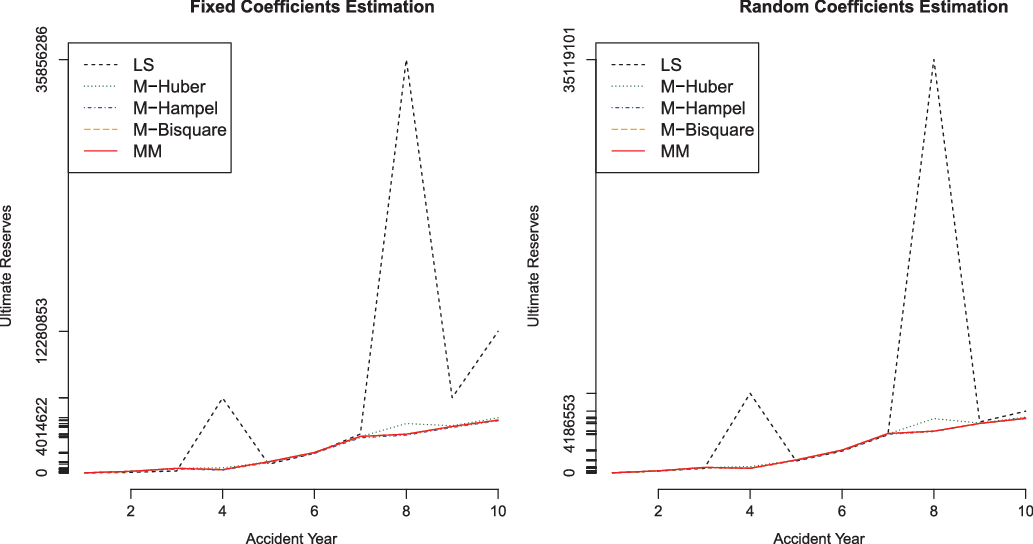
), the LS model leads to a significant overestimation of the total reserves, which is more evident in LS estimation with fixed coefficients (Table 1: 20,200,094, Table 2: 61,590,318). Moreover, Figure 5 displays an abrupt jump in LS estimates of year 8 due to the origin of the selected outlier. On the other hand, robust estimates of the total ultimate reserves in Table 2 lie on the same levels with the corresponding values of Table 1. Especially, M-Huber estimates of total reserves are less affected by the outlier, giving similar values for fixed (Table 1: 19,927,558, Table 2: 19,926,951) and random coefficient models (Table 1: 21,009,436, Table 2: 21,011,074).
Taylor and Ashe data with one artificial outlier: Diagnostic plots for non-robust LS estimation (left panels) and robust M and MM estimation (middle and right panels).

Ultimate reserves per accident year – Taylor and Ashe data with one outlier (
 $Y_{83}$
).

Values of estimated reserves and standard errors (s.e.) – Taylor and Ashe data with one outlier (
 $ Y_{83} $
).

Estimated ultimate reserves against year with fixed coefficients (left panel) and random coefficients (right panel) robust regression models – Taylor and Ashe data with one outlier.

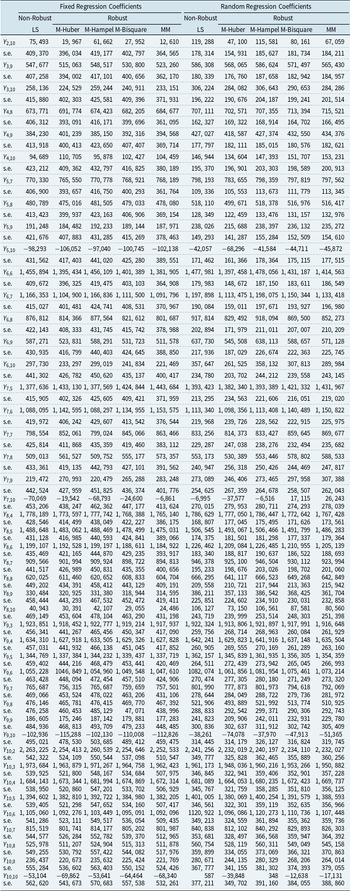
When presenting reserve estimates, it is equally important to obtain their standard errors. Table 3 presents the reserve estimates and their standard errors for different estimation methods applied to Taylor and Ashe data with one artificial outlier (
 $Y_{83}$
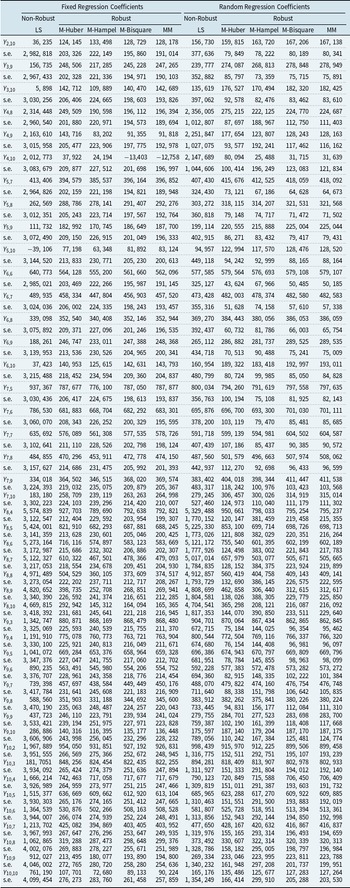
). Although the incremental claims of the initial data are not negative, there are cases where robust estimation under the fixed coefficient regression produces few negative predicted outstanding claims. We can see that for all reserve estimates, the RCR models give smaller standard error values than those produced by fixed coefficients regression, due to the involvement of the weights
 $ \hat{\lambda}_{ii} $
in (8) for the estimation of the generalised least squares estimator of
 $ \widehat{\dot{\sigma}} $
in (7). We also observe that either for fixed coefficient (left panel) or RCR models (right panel), the robust methods give smaller standard error values than the LS ones.
4.1.3 Two artificial outliers
As a second artificial outlier, we multiply the observation
 $Y_{44}$
by
 $\textbf{10}$
, i.e.,
 $Y_{44}=15{,}624{,}00\textbf{0}$
. Figure 6 displays the outlier diagnostics for LS, M and MM estimation in the presence of two artificial outliers. We can easily observe that claims
 $Y_{83}$
and
 $Y_{44}$
of the original data are identified as outliers. The existence of a second outlier (
 $Y_{44}$
) affects the values of total reserves, which is again more evident in LS estimation with fixed coefficients (Table 1: 20,200,094, Table 2: 61,590,318, Table 3: 67,151,105). A moderate jump is also obvious in LS estimates of Figure 7 by the addition of a second outlier in year 4.
From Table 4, we can observe that robust estimates do not significantly change, with M-Huber being again the most appropriate method, either for fixed (Table 1: 19,927,558, Table 2: 19,926,951, Table 3: 19,926,809) or random coefficients estimation (Table 1: 21,009,436, Table 2: 21,011,074, Table 3: 21,011,325). In addition, Table 5 presents the reserve estimates and their standard errors for different estimation methods applied to Taylor and Ashe data with two artificial outliers (
 $ Y_{83} $
and
 $ Y_{44} $
). Under both regression methods, we can see that the robust methods (fixed and random) provide smaller standard error values than the LS ones for all reserve estimates, while if we change the position of outlying observations, the order of standard error values follows the same pattern.
In general, LS models are very sensitive to outlier events (very large values) and in most times, they result in an overestimation of total reserves. However, there are cases where they underestimate the total reserves, depending on the position and the size of the outliers. For example, multiplying the observation
 $Y_{51}$
by
 $\textbf{10}$
, i.e.,
 $Y_{51}=4{,}431{,}60\textbf{0}$
(which corresponds to accident year 5 and development year 1), the least squares with fixed coefficients underestimates the total reserves (14,354,701), while the random coefficient model provides a moderate overestimation of total reserves (24,171,414). The robust total reserves remain close to their initial estimates obtained without artificial outliers (see Table 6).
Taylor and Ashe data with two artificial outliers: Diagnostic plots for non-robust LS estimation (left panels) and robust M and MM estimation (middle and right panels).

Ultimate reserves per accident year – Taylor and Ashe data with two outliers (
 $Y_{83}$
and
 $Y_{44}$
).

Values of estimated reserves and standard errors (s.e.) – Taylor and Ashe data with two outliers (
 $ Y_{83} $
and
 $ Y_{44} $
).

Ultimate reserves per accident year – Taylor and Ashe original data.

4.1.4 The behaviour of the run-off triangle in the presence of an outlier in each location
Since the influence of an outlier depends on its location on the triangle, it is appropriate to see the behaviour of the run-off triangle in the presence of an outlier in each location. Therefore, following the idea of Verdonck et al. (Reference Verdonck, Van Wouwe and Dhaene2009), we contaminate the data by multiplying each observation (cell) by 10 and observe the total ultimate reserve for each outlying observation, separately.
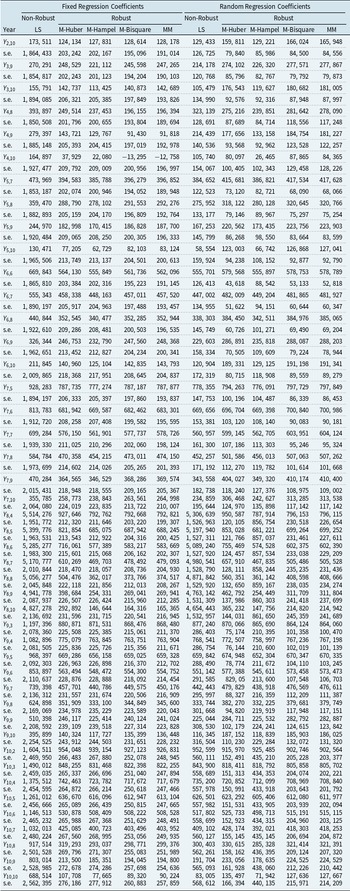
In the following, we compare the values of reserves under LS estimation with the values of reserves under robust estimation (M-Huber, M-Hampel, M-Bisquare, MM) for fixed and RCR models, respectively. The first line of Table 7 illustrates the values of the total reserves for the LS and robust estimation based on the original data (no artificial outliers). From the second line and on, the first column indicates which observation is contaminated (multiplied by 10) and can be considered as an outlier.
Estimated ultimate reserves against year with fixed coefficients (left panel) and random coefficients (right panel) robust regression models – Taylor and Ashe data with two outliers.

Total ultimate reserves – Taylor and Ashe data with each observation multiplied by 10.

From the results presented in Table 7, we observe that most of times, the LS estimation cannot handle a large claim (outlier) and produces an overestimation of outstanding reserves, but there are also cases where we have an underestimation of the reserves, depending on the location of that outlier. In particular, the presence of outlying observations in positions
 $ Y_{12} $
and
 $ Y_{22} $
cannot be captured by the fixed coefficients LS model and leads to an extreme underestimation of total reserves. On the contrary, robust estimation seems to robustify very well most of the outliers, except those that appear in the lower left corner (
 $ Y_{91}, Y_{92}, Y_{10,1} $
). In the same lower corner some convergence issues appeared with the M-Bisquare estimation algorithm (NA values). Also, M-Hampel estimation under the fixed coefficient regression and MM estimation under both regression models failed to robustify some outliers. The boldface values correspond to the total ultimate reserves obtained with the best performing robust methods for each regression cases. In both cases, it can be concluded the superiority of M-Huber estimates, which are less affected by outlying observations.
Claims data from motor business line: Diagnostic plots for non-robust LS estimation (left panels) and robust M and MM estimation (middle and right panels).

Estimated ultimate reserves against year with fixed coefficients (left panel) and random coefficients (right panel) robust regression models – Claims data from motor business line.

Remark 4. Although we use different estimation methods, Verdonck et al. (Reference Verdonck, Van Wouwe and Dhaene2009) faced similar situations and explained why robust methods can fail in some borderline and they suggested some adjustments for the outlying values of the triangle, before applying the robust chain-ladder method. Also, based on the influence function and robust estimators, Verdonck et al. (Reference Verdonck and Debruyne2011) presented a diagnostic tool that detects automatically the most influential claims in a given run-off triangle and they showed that a robust version of the generalised linear model can provide very satisfactory results on reserves estimation.
4.2 Claims data from motor business line
In this section, we will apply our methods on a run-off triangle from the motor business line of a non-life insurance company operating in Greece. The claims are from 2010 to 2019 in Euro currency, presented in Appendix B. The diagnostic plots of Figure 8 indicate that values (
 $ Y_{25} $
and
 $ Y_{64}$
) lie in higher levels than the others and can be considered as (real) outliers. However these outliers do not exceed much the borderline of the tuning constant
 $ k=2 $
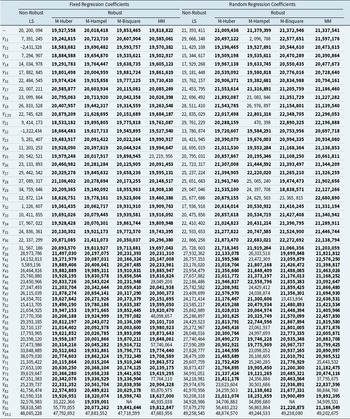
(Huber function), compared with the artificial outliers in Taylor and Ashe data (see Figures 4 and 6). This is also evident in Figure 9, which displays the values of ultimate reserves per accident year for non-robust and robust estimation. We observe that both regression models show a similar behaviour, with some small fluctuations in accident year 6.
Finally, Table 9 presents the reserve estimates and their standard errors for non-robust and robust estimation. Although the initial data do not contain negative incremental claims, there are cases where the regression model produces few negative predicted outstanding claims. However, the ultimate reserves per accident year (Table 8) are all positive. We also observe that there is not much difference between the standard errors resulting from the LS model in comparison with the standard errors resulting from robust methods due to the fact that the LS model is not affected much by the outlying observations
 $ Y_{25} $
and
 $ Y_{64} $
. In any case, we can see that the RCR models produce lower standard error values in comparison with the fixed ones. We also note that the regression nature of the proposed methods may lead to negative incremental reserve estimates.
5 Conclusions
In this paper, we investigated how random coefficients regression models can be incorporated in loss reserving techniques. These models provide a fair value for the estimation of outstanding reserves in cases where we have indications that the run-off patterns are changing. We relaxed the assumption that the development factors are constant by proposing a random coefficients regression model. As already mentioned, loss reserving under least square estimators with fixed or random coefficients is sensitive to outlier events and might lead to the overestimation or sometimes to the underestimation of the total reserves, depending on the position and the size of the outlying observations.
Ultimate reserves per accident year – Claims data from motor business line.

Values of estimated reserves and standard errors (s.e.) – Claims data from motor business line.

In order to remediate the effect of outliers to the estimation of total reserves, robust versions of fixed and random coefficients regression models were applied. The superiority of robust estimators in comparison with the non-robust estimators was evaluated by data implementations, where in most cases, the M-Huber robust estimator had the best performance. In the presence of artificial outliers, robust methods led to satisfactory estimation results as well as to lower standard errors of reserve estimates. Of course, we have to mention that in the final step of reserves estimation, the bias term due to robustification of outliers (if there are real large values and not artificial outliers) must be added to the value of the total reserve. The main advantages of applying M and MM estimators in claims reserving are their simplicity, the availability of robust procedures in R packages and the interactivity of these packages with other software (e.g. Excel) for an easier implementation of datasets in actuarial practice.
However, there are cases where our models are not appropriate and alternative robust estimators should be used, such as, when the distribution of the error term in a regression model is asymmetric or the claims are heavy-tailed distributed. For asymmetric errors, Bianco et al. (Reference Bianco, Ben and Yohai2005) proposed a generalised version of MM estimates in case where the distribution of errors is in a class of exponential families, including the log-gamma distribution. For cases where the claims are heavy-tailed distributed, Dornheim and Brazauskas (Reference Dornheim and Brazauskas2011) proposed the so-called corrected adaptively truncated likelihood procedure with symmetric or asymmetric log-location-scale errors that provides high robustness against outliers while achieving high efficiency for the assumed long-tailed model when none of the claims are truncated. Further investigation on how our models can be implemented in these cases could be the topic for future research.
Acknowledgements
The authors thank the anonymous referees for their valuable comments and acknowledge the partial support from the University of Piraeus Research Center. This work is partially based on the PhD thesis of the first author.

Appendix B Recent Claims Data from Non-Life LoB