





Introduction
Invasive species introductions, driven by global trade, climate change, and anthropogenic spread, are increasingly threatening urban trees and forested habitats (Sturrock et al. Reference Sturrock, Frankel, Brown, Hennon, Kliejunas, Lewis, Worrall and Woods2011; Liebhold et al. Reference Liebhold, Brockerhoff, Garrett, Parke and Britton2012; Lovett et al. Reference Lovett, Weiss, Liebhold, Holmes, Leung and Lambert2016; Sambaraju et al. Reference Sambaraju, Srivastava, Barker, Keena, Ormsby and Carroll2024). Oaks, Quercus spp. (Fagaceae), are important components of urban centres and deciduous forests in eastern Canada. They provide timber, food for urban wildlife, and environmental and aesthetic benefits to humans (Pedlar et al. Reference Pedlar, McKenney, Hope, Reed and Sweeney2020; Tischenko et al. Reference Tischenko, Williams, DeMerchant, Sambaraju, Zacharias and Soolanayakanahally2024). At least 10 species of oak occur in Canada (Little Reference Little1979; Farrar Reference Farrar1995). The most common species are northern red oak, Q. rubra Linnaeus, and bur oak, Q. macrocarpa Michaux, whereas white oak, Q. alba Linnaeus, is more frequently found in southern Ontario and southern Quebec (Farrar Reference Farrar1995). Garry oak, Q. garryana Douglas ex Hooker, is restricted to the highly diverse and ecologically significant ecosystems in southwestern British Colombia (Fuchs Reference Fuchs2001). Based on gross merchantable volume in eastern Canada, the value of oak trees has been estimated at CDN$126 million (Pedlar et al. Reference Pedlar, McKenney, Hope, Reed and Sweeney2020). Trade of oak-derived products annually contributes nearly CDN$25 million to the economy (Pedlar et al. Reference Pedlar, McKenney, Hope, Reed and Sweeney2020). However, the recent detection of oak wilt, caused by the fungal pathogen, Bretziella fagacearum (Bretz) de Beer et al. (Ceratocystidaceae), in southern Ontario, Canada (North American Plant Protection Organization 2023), represents an important threat to oak trees, particularly to those in high-density stands, in Canada. Should the disease spread throughout eastern Canada, substantial economic costs may be expected due to tree removal, decline in property values, and treatment measures in an extreme-case scenario (Pedlar et al. Reference Pedlar, McKenney, Hope, Reed and Sweeney2020).
Oak wilt is a damaging vascular disease of oaks in the eastern and southern United States of America (Juzwik et al. Reference Juzwik, Appel, MacDonald and Burks2011). First described in Wisconsin in the early 1940s (Henry et al. Reference Henry, Moses, Richards and Riker1944), the disease currently occurs in 24 states in the United States of America and causes varying levels of impact (Juzwik et al. Reference Juzwik, Appel, MacDonald and Burks2011). Red oaks are highly susceptible to oak wilt because they lack anatomical defences to prevent the movement of the pathogen through the xylem (Jacobi and MacDonald Reference Jacobi and MacDonald1980; Rioux and Blais Reference Rioux and Blais2023). In contrast, white oaks are less susceptible to the disease because they form anatomical barriers (tyloses) to pathogen movement (Jacobi and MacDonald Reference Jacobi and MacDonald1980; Rioux and Blais Reference Rioux and Blais2023).
Oak wilt propagates underground through root grafts, overland through insect vectors, which mainly are sap beetles (Coleoptera: Nitidulidae) and, to a lesser extent, oak bark beetles, Pseudopityophthorus spp. (Coleoptera: Curculionidae), and via anthropogenic transport of infested firewood (Cease and Juzwik Reference Cease and Juzwik2001; Blaedow and Juzwik Reference Blaedow and Juzwik2010; Juzwik et al. Reference Juzwik, Appel, MacDonald and Burks2011). Oak trees form root grafts that allow the disease to spread locally. Overland transmission by sap beetle species occurs when beetles are attracted to, and acquire spores from, fungal mats under the bark and subsequently infect healthy trees when visiting fresh wounds in the spring (Gibbs and French Reference Gibbs and French1980). Fungal mats form on red oaks 2–10 months after their death due to oak wilt. The growing fungal mats exert pressure on the bark, causing it to crack open and allowing the entry of sap beetles on to the spore-producing fungal mats, whereby pathogen spores become lodged on the insects’ exoskeletons (Curl Reference Curl1955; Juzwik and French Reference Juzwik and French1983). The spore-laden sap beetles subsequently disseminate the spores to wounded oak trees.
Multiple species of sap beetles are known carriers of B. fagacearum spores, depending on geographic region and season; however, the most frequent vectors of oak wilt vary latitudinally across the oak range in the United States of America (Appel et al. Reference Appel, Andersen and Lewis1986; Dowd and Nelsen Reference Dowd and Nelsen1994; Cease and Juzwik Reference Cease and Juzwik2001; Hayslett et al. Reference Hayslett, Juzwik and Moltzan2008; DiGirolomo et al. Reference DiGirolomo, Munck, Dodds and Cancelliere2020). For example, in Texas, Cryptarcha concinna Melsheimer, Colopterus maculatus (Erichson), and to a lesser extent Lobiopa undulata (Say) were found to be frequently associated with B. fagacearum (Appel et al. Reference Appel, Kurdyla and Lewis1990). In Missouri, Colopterus truncatus (Randall), Co. niger (Say), and Co. semitectus (Say) were the main vectors of oak wilt (Hayslett et al. Reference Hayslett, Juzwik and Moltzan2008). Colopterus truncatus and Caplothorax sayi Parsons have been reported as the predominant species visiting fresh wounds in Minnesota (Juzwik et al. Reference Juzwik, Skalbeck and Neuman2004). Furthermore, these two species composed 53% of sap beetle species found on oak wilt mats in Minnesota, and Glischrochilus spp. accounted for 21% (Cease and Juzwik Reference Cease and Juzwik2001). Epuraea spp., Carpophilus spp., and Co. semitectus may also act as vectors of oak wilt, but infrequently (Juzwik and French Reference Juzwik and French1983; Juzwik et al. Reference Juzwik, Skalbeck and Neuman2004). In contrast to the substantial research literature regarding sap beetles in the United States of America, relatively little is known about the diversity of sap beetles and the ecology of known vectors in eastern Canada (Majka et al. Reference Majka, Webster and Cline2008; Bousquet et al. Reference Bousquet, Bouchard, Davies and Sikes2013; Leclerc et al. Reference Leclerc, Bloin, Pelletier, Hébert and Sambaraju2023; Reed et al. Reference Reed, Dutkiewicz, Ross, Llewellyn and Fraser2023). Such information is essential to assess the risk of oak wilt spread in this region.
Sap beetles are distributed worldwide, occurring across tropical, subtropical, and temperate climate regimes (Parsons Reference Parsons1943; Kirejtshuk Reference Kirejtshuk1998, Reference Kirejtshuk2018; Audisio et al. Reference Audisio, Jelinek, Mariotti and De Biase2000). They are well adapted to surviving in a broad range of environments and exploiting different food sources such as macro- and micro-fungi, flowers, rotting fruits and vegetables, dead or decaying animal tissue, and stored products (Foott and Timmins Reference Foott and Timmins1970; Connell Reference Connell1991; Arbogast et al. Reference Arbogast, Torto, Willms and Teal2009; Lee et al. Reference Lee, Lee, Leschen and Lee2020; Mbenoun et al. Reference Mbenoun, Wingfield, Misse and Roux2020). Sap beetle species comprise both generalist feeders (Peng and Williams Reference Peng and Williams1991; Audisio et al. Reference Audisio, Jelinek, Mariotti and De Biase2000; Lee et al. Reference Lee, Lee, Leschen and Lee2020) and those that show narrow dietary preferences and limited ecological associations (Audisio et al. Reference Audisio, Jelinek, Mariotti and De Biase2000). Although feeding on fungi (mycophagy) is believed to be the base or evolutionarily conserved dietary habit of sap beetles, more diversified feeding strategies, often involving associations with fungi, such as consumption of fermenting sap and decaying plant material, evolved over time (Lee et al. Reference Lee, Lee, Leschen and Lee2020). In contrast, some species have developed specialised feeding behaviours (Lee et al. Reference Lee, Lee, Leschen and Lee2020). These specialisations, or lack thereof, combined with habitat preferences and insect life history traits, could influence the occurrences and abundances of sap beetles across different habitats (Loughner et al. Reference Loughner, Loeb, Demchak and Schloemann2014). Indeed, certain sap beetle species show clear habitat preferences dictated by potential evolutionary histories and availability of host resources on the landscape (Blackmer and Phelan Reference Blackmer and Phelan1995). Despite these broader insights, specific associations between sap beetles, particularly C. sayi and Co. truncatus, and different habitat ecosystems, including the effects of local weather and topographic factors, have been poorly characterised in Canada.
To address the above knowledge gaps, we assessed the diversity of sap beetles in the province of Quebec, Canada, with particular focus on the seasonal abundance of two known vectors of oak wilt, C. sayi and Co. truncatus, in three habitat types. Specifically, our objectives were as follows: (1) to describe the occurrences of free flying nitidulid species in the Greater Québec City Area, (2) to determine how nitidulid community composition and diversity vary by habitat and season, and (3) to characterise the seasonal dynamics of C. sayi and Co. truncatus in this region.
Materials and methods
Study sites and habitat classification
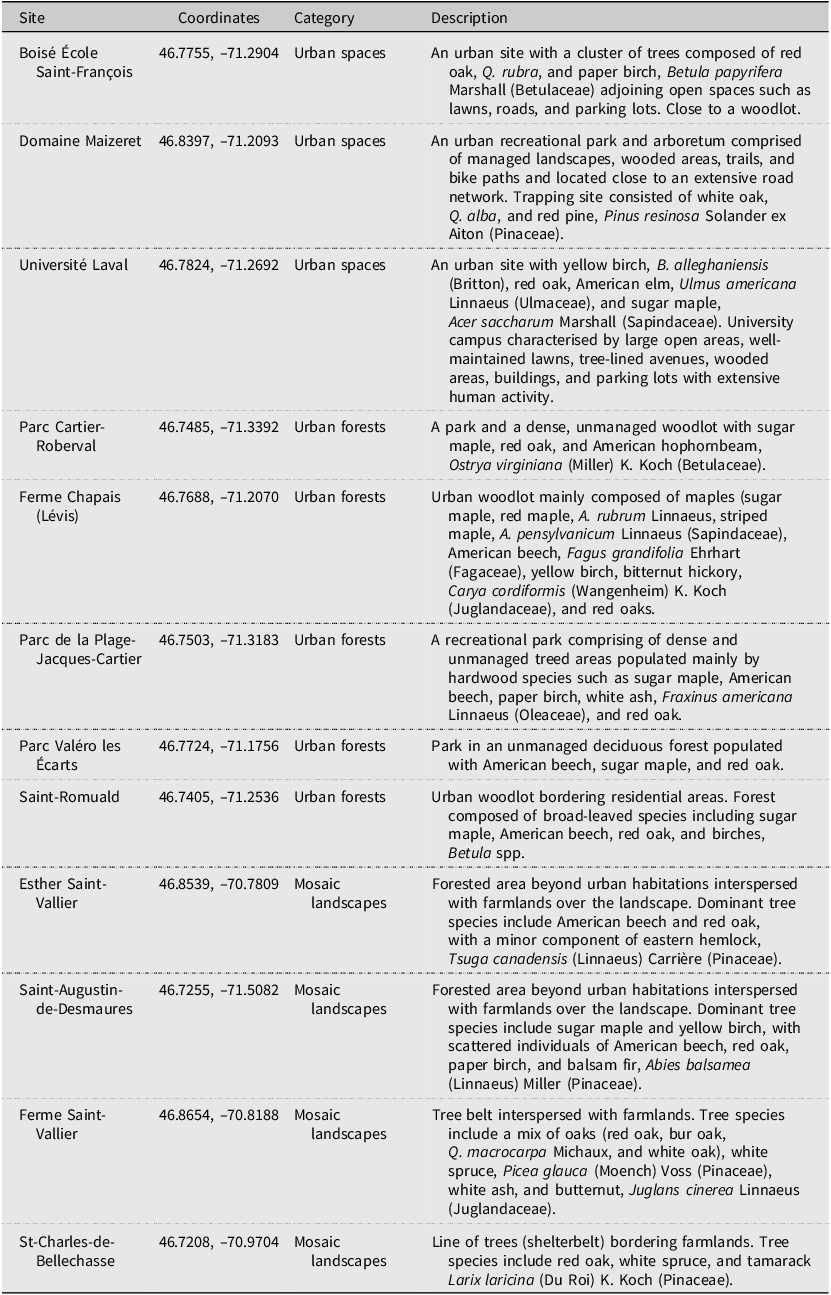
Twelve sites that contained oaks were selected for trap set-up in and around the Greater Québec City Area, Quebec (Table 1; Supplementary material, Table S1). Sites were broadly categorised into three habitat types: (1) urban spaces (n = 3), (2) urban forests (n = 5), and (3) mosaic landscapes (n = 4), based on features that distinguished each of the sites. For instance, we considered “urban spaces” to be sites characterised by the presence of single or groups of trees interspersed with roads, buildings, well-maintained lawns, and high human activity (Table 1). “Urban forests” were sites with dense tree cover located within city limits and adjacent to residential areas. These sites were largely dominated by maples, Acer spp. (Sapindaceae) (Table 1), and were characterised by less-frequent maintenance, presumably to preserve habitat biodiversity (e.g., presence of snags, fallen trees, and woody debris), multilayered vegetation structure with a semi-closed or closed canopy, natural regeneration, and humid microclimates. “Mosaic landscapes” were forested or shelterbelt sites interspersed with large agricultural zones, composed of a mixture of pastures, cereal crops such as maize, Zea mays Linnaeus (Poaceae), and soybean, Glycine max (Linnaeus) Merrill (Fabaceae), outside urban areas. This classification was designed to help identify potential habitat reservoirs (i.e., refuges) of nitidulid vectors of oak wilt in urban and rural landscapes to inform future management decisions for disease control. A detailed description of the study sites, including their tree compositions, can be found in Table 1.
Description of sap beetle (Coleoptera: Nitidulidae) collection sites in the Greater Québec City Area, Quebec, Canada

Table 1 Long description
A table describing sap beetle collection sites in the Greater Québec City Area, Quebec, Canada. Information includes whether the collection site is in a recreational site such as a park or in university grounds in urban areas, an urban woodlot, or a densely or sparsely treed area in an agricultural zone. The table shows that the tree composition mostly includes deciduous species and urban spaces are characterized by more human traffic, roads, buildings, and well-maintained lawns.
Three Lindgren funnel traps and three wind vane traps (Supplementary material, Figure S1), each separated by at least 30 m on average, were installed at each site, for a total of 72 traps (36 Lindgren and 36 wind vane traps) across the 12 sites. These traps are commonly used in sap beetle trapping (Dowd et al. Reference Dowd, Bartelt and Wicklow1992; Ambourn et al. Reference Ambourn, Juzwik and Moon2005; DiGirolomo et al. Reference DiGirolomo, Munck, Dodds and Cancelliere2020; Reed et al. Reference Reed, Dutkiewicz, Ross, Llewellyn and Fraser2023). Two types of traps were used because we wanted to examine differences in trap captures of two main vectors of oak wilt, C. sayi and Co. truncatus. These two species play major roles in the spread of B. fagacearum in Minnesota, Wisconsin, and Michigan (Cease and Juzwik Reference Cease and Juzwik2001; Jagemann et al. Reference Jagemann, Juzwik, Tobin and Raffa2018; Morris et al. Reference Morris, Chahal, Cregg, Sharma, Wieferich, Sakalidis and McCullough2024). In the present study, the traps were hung from tree branches using ropes at a mean (± standard deviation) height of 3.3 m (± 0.9 m) above the ground and 1.5–3 m from the nearest tree trunk. Trap placement was mostly near the edges of treed areas in urban spaces and inside stands in urban forests. For mosaic landscapes, trap placement at two sites was along the edges of shelterbelts (Ferme Saint-Vallier, St-Charles-de-Bellechasse) or, at another two sites, inside stands (Saint-Augustin-de-Desmaures, Esther Saint-Vallier). Each trap was baited with two rubber septa dispensing aggregation pheromones (Trécé Inc., Adair, Oklahoma, United States of America) of C. sayi and Co. truncatus. For the Lindgren trap, pheromone septa were pinned on the side of the sixth unit from the top. Approximately 15 g of fermenting wheat-based dough bait was similarly placed on the other side of the sixth unit in a 50-mL screw-capped centrifuge tube (10 cm × 3 cm), and both ends were covered with a mesh for diffusion of volatiles. For the wind vane trap, pheromone lures and dough bait were placed in a vertical attachment (Supplementary material, Figure S1). The dough bait was replaced at each visit to a trap to collect a sample, and the pheromone septa were changed every other collection date.
Nitidulid beetles were collected from 18–19 May to 1–4 November in 2021 and from 3–4 May to 8–9 November in 2022, with a median trapping interval of 14 days between collections. However, due to logistical issues and COVID-19 pandemic–related constraints on travel and personnel availability in 2021 and 2022, certain trap collections were advanced or delayed. Therefore, the actual range of days when traps were “active” varied from 5 to 21 days (interquartile range: 13–15 days), with 70% of trapping durations falling below 15 days over the two-year period. The trap collections were brought to the laboratory, and all nontarget insects and debris were removed from the samples. The nitidulid beetles separated out were sorted and identified to the genus level, or to the species level where possible, using several published and online sources (Parsons Reference Parsons1943; Parry and Howden Reference Parry and Howden1975; Ford Reference Ford1996; Cervenka et al. Reference Cervenka, Skalbeck, Kyhl, Blackford, Juzwik and Seybold2001; Price Reference Price2003; Klimaszewski et al. Reference Klimaszewski, Langor, Hammond, Pelletier, Bousquet and Bourdon2015; DiLorenzo et al. Reference DiLorenzo, Powell, Cline and McHugh2021; e.g., https://bugguide.net, accessed 6 October 2025). Voucher specimens were deposited at the René-Martineau Insectarium, Natural Resources Canada, Canadian Forest Service, Laurentian Forestry Centre (City of Québec, Quebec, Canada).
Statistical analyses
We excluded missing or incomplete data from trap collections due to loss of samples (e.g., trap or collection container falling on the ground; n = 22) before analyses. These missing observations represented approximately 1.1 % of total trap samples (n = 1944) and were dispersed spatio-temporally. Insect collection data were then pooled by habitat and season to report descriptive statistics regarding the diversity and seasonality of sap beetles in the study area. Seasons were classified closely based on meteorological descriptions and the Julian or calendar trap collection date (in parentheses) as “Spring/Early Summer” (≤ 167 days, approximately mid-June), “Summer” (168–237 days, the latter indicating late August), and “Late Summer/Fall” (> 237 days). Habitat and season-wise raw counts of trapped nitidulid species were calculated in R, version 4.5 (R Core Team 2023). We assessed species compositions and abundances of nitidulid species in our study region through nonparametric and parametric analyses. We ran permutational multivariate analyses of variance using species count–based distance matrices (adonis2 function, Bray–Curtis dissimilarity method) and nonmetric multidimensional scaling (metaMDS function) on log-transformed [log10(x + 1)] abundance data (2021 and 2022 combined) through the vegan package, version 2.6.10, in R, version 4.5 (Oksanen et al. Reference Oksanen, Simpson, Blanchet, Kindt, Legendre and Minchin2025), to investigate whether nitidulid community compositions and species abundances varied by habitat and season. Nitidulid diversity was assessed using the Shannon index (Legendre and Legendre Reference Legendre and Legendre2012). We examined whether mean Shannon indices varied by habitat and season using a two-way analysis of variance on Box–Cox-transformed indices to meet the assumptions of normality and homoscedasticity. Tukey’s honestly significant difference test was used to perform post hoc mean separations.
Because our main focus in this paper was on two of the known vectors of oak wilt, C. sayi and Co. truncatus, we modelled trap catches for each species as a function of habitat, season, trap type, weather, and topographic variables through a generalised linear mixed model (GLMM; negative binomial, nbinom2) approach using the glmmTMB, version 1.1.11, package in R (Brooks et al. Reference Brooks, Bolker, Kristensen, Maechler, Magnusson and McGillycuddy2025). We pooled the adult captures by individual trap unit within a given location separately by season before the analysis. Then, counts of C. sayi (or Co. truncatus) per season per trap were included in the model as a response variable. Habitat type, season, trap type, and their three-way interactions were included as fixed effects. Weather variables included mean seasonal temperature (°C), mean seasonal precipitation (mm), and mean relative humidity (%). Daily mean temperature, total precipitation, and average relative humidity were generated in BioSIM, version 11 (https://apps-scf-cfs.nrcan.gc.ca/biosim, accessed 20 August 2025), and seasonal averages of weather variables corresponding to start and end dates of trapping in each season were calculated in R. A degree-day term was not used in the count models because exploratory analysis did not support the inclusion of this term and due to the potential for its high correlation with mean seasonal temperatures. Location-specific topographic variables were extracted from the approximately 90-m-resolution Shuttle Radar Topography Mission (SRTM) Digital Elevation Model (DEM), version 4.1 (https://pubs.usgs.gov/of/2011/1127/srtm.html, accessed 17 July 2025). These included slope (%), cos-transformed aspect originally in degrees (–1 to 1, south to north), and elevation (m). Two-way, three-way, and higher-order interactions involving weather or topographic variables with other fixed effects were not considered because an overly complex model would hinder a meaningful interpretation. Year, site, and trap type nested within site were considered random effects. Additionally, the total number of days that a given trap was active or deployed in the field per season was included as an offset term on a log scale in the conditional negative binomial model. This allowed us to transform the response variable from expected raw counts to modelling the expected daily catch rates based on the sampling duration per season (Hilbe Reference Hilbe2011). A global assessment of the significant associations between predictors and expected mean insect catch rates was conducted through Type III analysis of variance using the car package, version 3.1.3, in R (Fox et al. Reference Fox, Weisberg, Price, Adler, Bates and Baud-Bovy2024). We chose the most parsimonious C. sayi (or Co. truncatus) model among a set by comparing the respective “full” model versus competing simpler models (e.g., without interactions) using the AICtab function in the bbmle package, version 1.0.25.1, in R (Bolker et al. Reference Bolker and Giné-Vázquez2025). Only the best-fit model among different models tested for C. sayi or Co. truncatus is presented in this paper. Pairwise contrasts were performed using the contrast function in emmeans package, version 1.11.1, in R, and P-values were adjusted based on the Sidak correction to account for multiple testing (Lenth et al. Reference Lenth, Banfai, Bolker, Buerkner, Giné-Vázquez and Herve2025).
Finally, we quantified the relationship between accumulated degree-days (> 5 °C) and C. sayi (or Co. truncatus) trap capture data. Degree-days (> 5 °C; DD5) were generated in BioSIM using the modified sine wave method (Allen Reference Allen1976). Data for these two species were pooled separately across all traps at the site level for each collection date. We computed the total counts per species–site combination separately for 2021 and 2022. Then, we calculated cumulative proportions of total trap catches by collection date per site and joined the accumulated degree-days (> 5 °C) to the proportional capture data. Only observations in which total counts of either species were at least five over the study year were used in the analysis. We plotted the cumulative proportion data for C. sayi and Co. truncatus versus the accumulated degree-days and developed regression equations to determine the degree-days (> 5 °C) required for 10%, 50%, and 90% flight activity of C. sayi and Co. truncatus.
Results
Nitidulid abundances and distributions
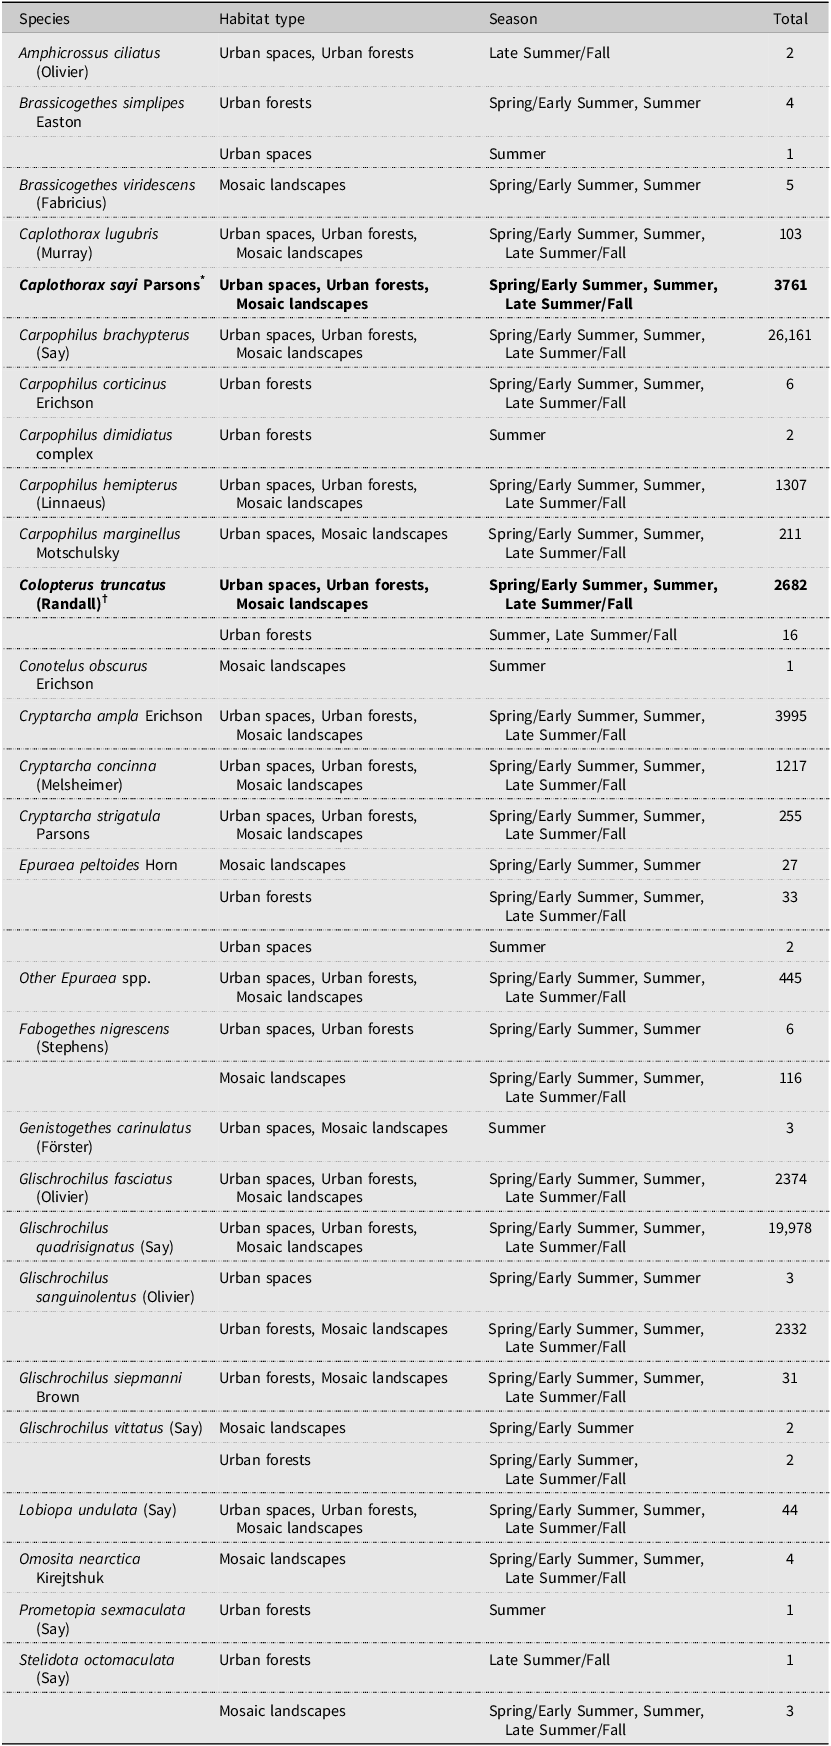
A total of 65 136 nitidulid beetles were collected and identified to the genus or species level in 2021 and 2022. Collections included 26 unique species, as well as members of a genus (unidentified Epuraea spp.) and a complex (Carpophilus dimidiatus complex; Table 2). Carpophilus brachypterus (Say) and G. quadrisignatus (Say) were the two most abundant species, accounting for approximately 71% of all Nitidulidae captured during the study period (Table 2). Other common species included Cryptarcha ampla Erichson (6.1%), C. sayi (5.8%), Co. truncatus (4.1%), G. fasciatus (Olivier) (3.6%), G. sanguinolentus (Olivier) (3.6%), Carpophilus hemipterus (Linnaeus) (2%), and Cryptarcha concinna Melsheimer (1.9%). All other nitidulid species together accounted for about 2% of the total nitidulid captures (Table 2). Seasonal abundances of the most frequently captured species were comparatively greater in the spring and summer (late June, July, and most of August) than in late summer and fall, when populations declined (Fig. 1).
Total trap captures of top sap beetle species (Coleoptera: Nitidulidae) in 2021 and 2022 across study sites in the Greater Québec City Area, Quebec, Canada, based on habitat type and season

A summary of sap beetle (Coleoptera: Nitidulidae) trap captures in the Greater Québec City Area, Quebec, Canada, by habitat type and season, in 2021–2022

Table 2 Long description
A summary table showing total counts of 26 unique sap beetle species, members of a genus (unidentified Epuraea spp.) and a complex (Carpophilus dimidiatus complex) in urban spaces, urban forests, and mosaic landscapes in spring-early summer, summer, and late summer-fall in the Greater Québec City Area, Quebec, Canada, in 2021 and 2022. Highest counts are for Carpophilus brachypterus and Glischrochilus quadrisignatus.
*†Focal species of this study
Nonparametric permutational multivariate analyses conducted on pooled data from 2021 and 2022 showed that nitidulid community compositions and their relative abundances changed over seasons depending on the habitat type (pseudo-F = 5.51, df = 8, 27, R 2 = 0.62, P = 0.001). Greater dissimilarities in community compositions were observed within mosaic landscape sites across seasons than in sites grouped within urban forests and urban spaces, although certain species preferences were apparent (Fig. 2). For example, C. sayi and Co. truncatus were more closely associated with urban forests, and G. quadrisignatus and Ca. brachypterus were more frequent in some mosaic landscapes (Fig. 2). High correspondence was found between observed dissimilarities in community compositions among site–season combinations versus plotted ordination distances (nonmetric R 2 = 0.97; Fig. 2), with some localised distortion (stress value = 0.171). Shannon diversity analysis showed that species diversity and evenness differed significantly by habitat (F = 13.88, df = 2, 27, P < 0.001) but not by season (F = 3.02, df = 2, 27, P = 0.066). Habitat × season interactions were not significant (F = 2.29, df = 4, 27, P = 0.085). Post hoc pairwise comparisons of Shannon indices showed that urban forests and urban spaces harboured significantly greater diversity of sap beetle species than mosaic landscapes did.
Nonmetric multidimensional scaling (NMDS; k = 2, stress = 0.171) ordination plot of sap beetle community composition by habitat type and season. Each coloured circle embedded with a shape represents an NMDS score for a combination of site (grouped within a habitat) and season. Small dark circles represent scores of the most abundant species. A larger ellipse represents greater variability. Dark circles close together indicate species co-occurrences, and those within an ellipse indicate habitat associations.

Flight phenology of C. sayi and Co. truncatus
Caplothorax sayi and Co. truncatus displayed some differences in starting flight patterns, percent-wise peak populations, and capture dates later in the fall (Figs. 3A–F and 4A–F). In 2022, when sampling extended over a longer period, Co. truncatus was first found on 4 May 2022 (Fig. 4E). Mean temperature over the corresponding trapping period (T ave) and mean maximum temperature (T max) in sites where Co. truncatus was first found were 8.4 °C and 13.1 °C, respectively. Caplothorax sayi was first found on 9 May 2022 (T ave = 8 °C, T max = 14.6 °C). Caplothorax sayi was last captured on 4 October 2021 (T ave = 12.8 °C, T max = 17.8 °C) and on 25 October 2022 (T ave = 10.4 °C, T max = 15.6 °C), whereas Co. truncatus was last found on 2 November 2021 (T ave = 7.7 °C, T max = 10.9 °C) and on 9 November 2022 (T ave = 8.2 °C, T max = 13.5 °C).
Trap capture trends (total counts per site; filled circles) of Caplothorax sayi and mean temperatures (°C; lines) by collection date, site, and habitat type over the trapping season in 2021 (A–C) and 2022 (D–F) in the Greater Québec City Area, Quebec, Canada. A and D: BESF = Boisé École Saint-François, DM = Domaine Maizeret, UL = Université Laval; B and E: PCR, Parc Cartier Roberval; FCL, Ferme Chapais (Lévis); PJC, Parc de la Plage-Jacques-Cartier; PVLE, Parc Valéro les Écarts; SR, Saint-Romuald; C and F: ESV, Esther Saint-Vallier; SADD, Saint-Augustin-de-Desmaures; FSV, Ferme Saint-Vallier; SCDB, St-Charles-de-bellechasse

Figure 3 Long description
Trap capture trends (total counts per site; filled circles) of Caplothorax sayi and mean temperatures (°C; lines) by collection date, site, and habitat type over the trapping season in 2021 (A–C) and 2022 (D–F). The sub-figures A and D show data for three sites in urban spaces, sub-figures B and E for five urban forest sites, and sub-figures C and F for four mosaic landscape sites.
Trap capture trends (total counts per site; filled circles) of Colopterus truncatus and mean temperatures (°C; lines) by collection date, site, and habitat type over the trapping season in 2021 (A–C) and 2022 (D–F) in the Greater Québec City Area, Quebec, Canada. A and D: BESF, Boisé École Saint-François; DM, Domaine Maizeret; UL, Université Laval; B and E: PCR, Parc Cartier Roberval; FCL, Ferme Chapais (Lévis); PJC, Parc de la Plage-Jacques-Cartier; PVLE, Parc Valéro les Écarts; SR, Saint-Romuald; C and F: ESV, Esther Saint-Vallier; SADD, Saint-Augustin-de-Desmaures; FSV, Ferme Saint-Vallier; SCDB, St-Charles-de-Bellechasse

Figure 4 Long description
Trap capture trends (total counts per site; filled circles) of Colopterus truncatus and mean temperatures (°C; lines) by collection date, site, and habitat type over the trapping season in 2021 (A–C) and 2022 (D–F). The sub-figures A and D show data for three sites in urban spaces, sub-figures B and E for five urban forest sites, and sub-figures C and F for four mosaic landscape sites.
Caplothorax sayi populations peaked at 18 °C (14.4–19.9 °C), and Co. truncatus populations peaked at 16.4 °C (13.7–20.3 °C). In the case of C. sayi, 94% of beetles were caught between May and July in 2021, and 76% were caught in the same period in 2022. For Co. truncatus, 92% and 77% of the beetles were captured before August in 2021 and 2022, respectively.
Peak captures of C. sayi and Co. truncatus occurred on 1 June 2021 at Parc Valéro Les Écarts and Esther Saint-Vallier, respectively (Figs. 3B and 4C). In 2022, peak C. sayi captures per site were observed in Parc Valéro Les Écarts on 19 July 2022 (Fig. 3E), and peak Co. truncatus captures were found in Parc Cartier-Roberval on 10 June 2022 (Fig. 4E). For C. sayi, a small second peak was observed on 24 August 2021 in Saint-Romuald (Fig. 3B), although this peak was less prominent than corresponding larger peaks on 14 September 2022 in two other urban forest sites (Fig. 3E). Similarly, for Co. truncatus, noticeable second peaks were seen only in 2022 in some urban forest sites (Fig. 4E) and in one mosaic landscape site (Fig. 4F). In 2021, Co. truncatus activity was very low from late August onwards (Fig. 4A–C).
Modelling trap capture data of C. sayi and Co. truncatus
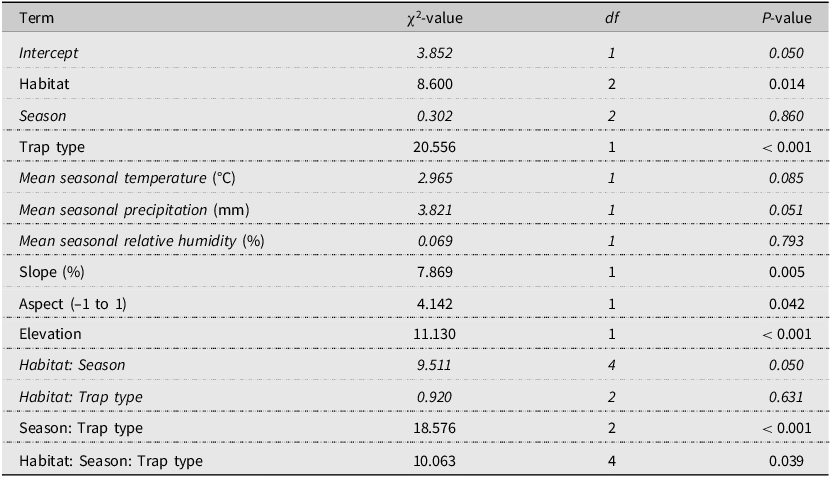
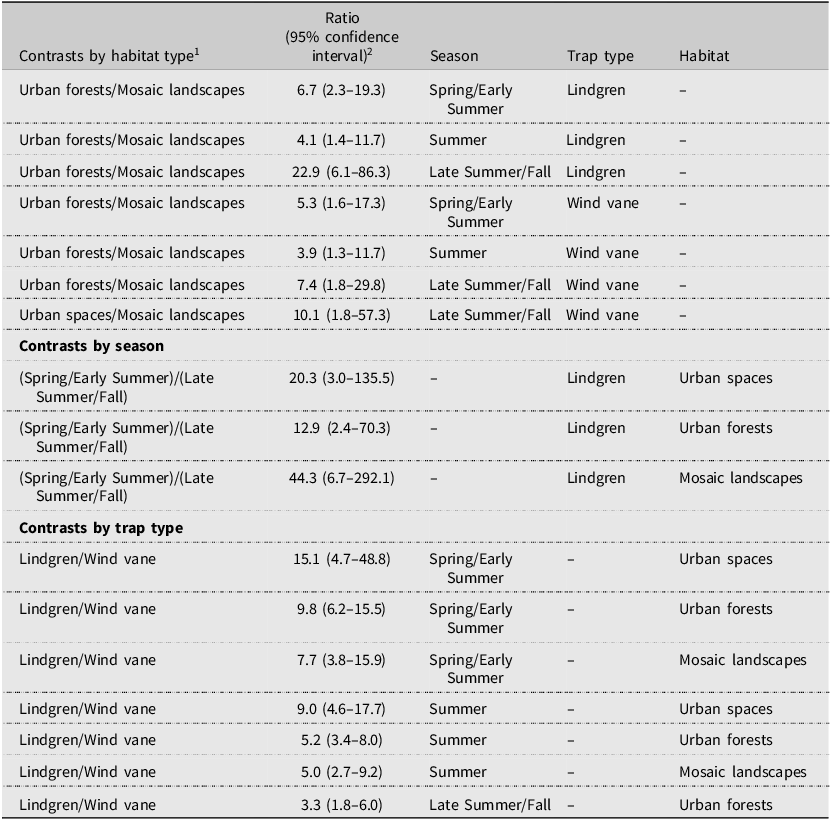
A global test of significant influences of different predictors on C. sayi trap captures in a negative binomial model indicated a marginal significance of a three-way interaction of habitat type, season, and trap type on the expected daily catch rates of C. sayi (Table 3). This weak relationship indicates that a large variability exists in the effects among the different three-way combinations. Pairwise contrasts showed that 17 of 45 different combinations of habitat type, season, and trap type were significant (Table 4). Among significant pairwise contrasts, C. sayi were caught in higher numbers in urban forests than in mosaic landscapes (Table 4). No significant differences in capture rates were observed between urban forests and urban spaces (Supplementary material, Table S2). Lindgren funnel traps generally caught more C. sayi than wind vane traps did (Table 4). Mean seasonal temperature, mean seasonal precipitation, and mean relative humidity were not associated with expected daily captures of C. sayi (Table 3). However, slope and elevation were positively associated with C. sayi daily captures – that is, the higher the slope or elevation, the greater the C. sayi trap captures (Table 3; Supplementary material, Table S2). Greater mean expected daily captures occurred in habitats on south-facing slopes than in those on north-facing slopes (Supplementary material, Table S2).
An analysis of variance test showing the global association of habitat, season, trap type, weather, and topographic variables with Caplothorax sayi trap counts in a mixed-effects negative binomial model. Nonsignificant terms are in italics.

Table 3 Long description
An analysis of variance table showing that capture rates of Caplothorax sayi are influenced by interactions among habitat, season, and trap type used. Slope, topographic aspect, and elevation affect C. sayi trap captures. The role of weather variables such as seasonal temperature and precipitation is marginal, while seasonal relative humidity does not influence C. sayi trap captures.
Significant pairwise contrasts by habitat type, season, and trap type based on a negative binomial model for Caplothorax sayi

Table 4 Long description
A table showing that Caplothorax sayi is consistently found in urban areas, more particularly urban forests, than mosaic landscapes, irrespective of the season or the trap type used. Caplothorax sayi is more frequently found in spring/early summer than in late summer/fall. Lindgren funnel trap is more efficient in trapping C. sayi than wind vane trap.
1 Pairwise contrasts between levels of a factor (column 1) at fixed levels of two other factors (columns 3–5)
2 A value greater than 1 indicates a significantly higher expected catch rate of C. sayi at a given factor level (numerator; e.g., urban forests) compared to the reference level (denominator; e.g., mosaic landscapes) in the first column.
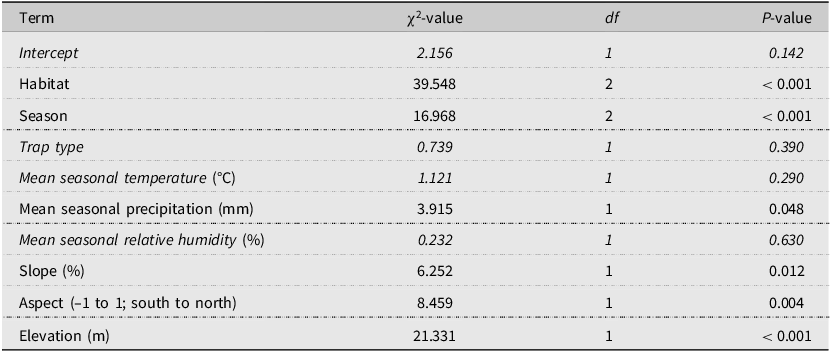
For Co. truncatus, interactions among habitat, season, and trap type were not significant and therefore were not retained in the final model (Table 5; Supplementary material, Table S3). Main effects of habitat and season were significant; however, trap type did not influence the daily expected capture rates of Co. truncatus. Urban forests had a significantly higher expected daily catch rate of Co. truncatus than did urban spaces and mosaic landscapes after accounting for other predictor variables (Fig. 5A). Significantly more Co. truncatus were caught in spring/early summer than in late summer/fall (Fig. 5B; Supplementary material, Table S3), whereas no significant differences in trap catch rates were observed between summer versus spring/early summer or between summer versus late summer/fall periods (Fig. 5B; Supplementary material, Table S3). Like C. sayi, mean seasonal temperature and mean relative humidity were not associated with expected daily counts of Co. truncatus. However, mean seasonal precipitation was marginally significant (P = 0.048). Higher precipitation was associated with lower catch rates of Co. truncatus (Table 5; Supplementary material, Table S3). Sites with higher slopes, south-facing terrain, and at comparatively higher elevations were linked to greater daily expected trap catches of Co. truncatus (Table 5; Supplementary material, Table S3).
Ratio of expected capture rates of Colopterus truncatus based on pairwise contrasts of habitat (A) and season (B). Contrast bars crossing the dotted line are not significant (P > 0.05).

An analysis of variance test showing the global association of habitat, season, trap type, weather, and topographic variables with Colopterus truncatus trap counts in a mixed-effects negative binomial model. Nonsignificant terms are in italics.

Table 5 Long description
An analysis of variance table showing that the capture rates of Colopterus truncatus are influenced by habitat or season, but not by trap type used. Slope, topographic aspect, and elevation are associated with Co. truncatus trap captures. Capture rates are affected by seasonal precipitation, but not by seasonal temperature or relative humidity.
The relationship between the cumulative proportion of total catch of C. sayi and accumulated degree-days above 5 °C (Fig. 6A) was modelled as a quasibinomial regression in R and was given by the equation, logit(y) = –3.89 + 0.007x – 1.19 × 10–6x 2, where y represents the cumulative proportion of total catch and x is the accumulated degree-days above 5 °C. The predicted accumulated degree-days for 10%, 50%, and 90% flight activity were 260, 635, and 1085 degree-days above 5 °C. For Co. truncatus (Fig. 6B), the relationship was denoted by the equation, logit(y) = −2.4 + 0.005x – 8.06 × 10–7x 2. The predicted accumulated degree-days for 10%, 50%, and 90% flight activity were 45, 550, and 1200 degree-days above 5 °C. The linear and quadratic terms in both C. sayi and Co. truncatus degree-day models were significant at P < 0.0001.
Cumulative proportion of Caplothorax sayi (A) and Colopterus truncatus (B) trap captures from different sites in the Greater Québec City Area in 2021 and 2022 plotted as a function of accumulated degree-days (> 5 °C). Each fitted line (in black) is based on a species-specific quasibinomial regression model.

Discussion
This study aimed to describe sap beetle community compositions and abundances in different habitats and seasons. We conducted a detailed assessment of the seasonal abundances of two known sap beetle vectors, C. sayi and Co. truncatus, in the Greater Québec City Area, Quebec, Canada. We found that sap beetle community compositions and abundances differed among habitats and seasons, although the overall diversity of species varied significantly across habitats alone. For example, urban forests and urban spaces were more diverse than mosaic landscapes were, based on the number of sap beetle species found and their evenness. Populations of C. sayi and Co. truncatus peaked when the average temperatures during the trapping period ranged between 14 °C and 20 °C. Caplothorax sayi was captured more frequently in urban forests than in mosaic landscapes, after accounting for other factors, and Co. truncatus captures in urban forests exceeded those in urban spaces or mosaic landscapes. This is an important and novel finding regarding C. sayi and Co. truncatus, given the potential for oak wilt expansion in eastern Canada. Our results suggest that monitoring efforts for B. fagacearum–carrying insects should focus particularly on urban forests in comparison to urban spaces and mosaic landscapes while also covering other locations at risk, such as large, contiguous forests with oaks, to detect and limit the spread of oak wilt.
Habitat preferences of various sap beetle species differed by the type of habitat, by season, and among sites grouped within a given habitat. For instance, C. sayi and Co. truncatus were more closely associated with urban forests than with urban spaces or mosaic landscapes (for C. sayi only), although this disparity with mosaic landscapes for C. sayi was due to two shelterbelt sites (Ferme Saint-Vallier, St-Charles-de-Bellechasse) where few C. sayi were caught. Carpophilus brachypterus and G. quadrisignatus were the most abundant species in mosaic landscapes, irrespective of season. Blackmer and Phelan (Reference Blackmer and Phelan1995) made similar observations in Ohio, United States of America, regarding G. quadrisignatus and Ca. brachypterus, which were more closely associated with agricultural sites. Glischrochilus quadrisignatus was found in high numbers in managed forests adjacent to corn fields in Ontario, Canada (Zeran et al. Reference Zeran, Anderson and Wheeler2006), suggesting that landscape features are important determinants of sap beetle composition and abundances (Levesque and Levesque Reference Levesque and Levesque1992), with wooded areas likely acting as overwintering habitats for some species (Kyhl Reference Kyhl2006; Loughner et al. Reference Loughner, Loeb, Demchak and Schloemann2014). Zeran et al. (Reference Zeran, Anderson and Wheeler2006) found that sap beetle diversity and richness were higher in old-growth forests than in managed forests, whereas sap beetle abundances were high in managed forests. In the present study, sap beetle diversity was comparatively higher in urban forests than in mosaic landscapes. This is not surprising: mosaic landscapes consisting of agricultural zones may harbour more specialist herbivores, such as G. quadrisignatus, that feed on fruits, vegetables, and corn (Wilde Reference Wilde1970; Levesque and Levesque Reference Levesque and Levesque1992) than do urban forests, which may consist of more generalist sap beetle species that presumably have a long evolutionary or ecological association with trees in their natural habitats (Blackmer and Phelan Reference Blackmer and Phelan1995). Such evolutionary associations often involve symbiotic relationships between ophiostomatoid fungi and sap beetles (Mbenoun et al. Reference Mbenoun, Wingfield, Misse and Roux2020). The associated fungi (e.g., B. fagacearum) provide nutritional and reproductive benefits to the sap beetles, which in turn benefit the fungi by dispersing their spores to new host trees (Juzwik and French Reference Juzwik and French1983).
In the present study, C. sayi occurred from May to October, whereas Co. truncatus was observed from May to November. Both species were generally most active from May to July, attaining peaks between the beginning of June and mid-July. These observations are largely consistent with the published literature (Appel et al. Reference Appel, Andersen and Lewis1986; Levesque and Levesque Reference Levesque and Levesque1992 for Co. truncatus in southern Quebec; Cease and Juzwik Reference Cease and Juzwik2001; Ambourn et al. Reference Ambourn, Juzwik and Moon2005; Jagemann et al. Reference Jagemann, Juzwik, Tobin and Raffa2018; DiGirolomo et al. Reference DiGirolomo, Munck, Dodds and Cancelliere2020; Morris et al. Reference Morris, Chahal, Cregg, Sharma, Wieferich, Sakalidis and McCullough2024) and coincide with the period of highest risk of oak wilt transmission in the United States of America, which is spring and early summer (Juzwik et al. Reference Juzwik, Skalbeck and Neuman2004). Therefore, activities that increase the risk of oak wilt transmission in the spring and early summer (e.g., pruning) in Quebec must be avoided to prevent disease spread. First adult emergences and peak activity dates in studies from the United States of America, as may be expected, were earlier than our findings because the experimental sites in those studies were in more southerly latitudes. A prominent second peak occurred in September 2022 for both species in the present study. Our results largely agree with Ambourn et al. (Reference Ambourn, Juzwik and Moon2005), who reported that C. sayi populations in Minnesota were mostly active from April to July and peaked again in October, although the number of peaks in that study varied by the occurrence of oak wilt. Populations of Co. truncatus were high from April to June, and smaller peaks occurred in August and October in Minnesota (Ambourn et al. Reference Ambourn, Juzwik and Moon2005). However, late-season peaks may not necessarily imply higher risk of oak wilt transmission in the fall (Juzwik and French Reference Juzwik and French1986).
Seasonal crests and troughs in C. sayi and Co. truncatus populations are likely related to their life cycles and have less to do with immigrating populations arriving from elsewhere (Kyhl Reference Kyhl2006). Both species are believed to be univoltine with similar life cycles (Kyhl Reference Kyhl2006). Adults emerge from their overwintering sites (e.g., leaf litter and bark crevices) in the spring and feed, mate, and oviposit on oak wilt mats or on fresh wounds (Kyhl Reference Kyhl2006). Larval feeding presumably occurs in the spring and early summer, and upon pupation, adults emerge in the summer or fall for feeding and subsequent overwintering. Cumulative proportional abundances over time of both species are related to degree-day accumulations (Jagemann et al. Reference Jagemann, Juzwik, Tobin and Raffa2018). Additionally, multiple factors such as site type, site status (oak wilt present or absent), and season influence the presence and abundance of each of these two species and of sap beetles in general (Levesque and Levesque Reference Levesque and Levesque1992; Blackmer and Phelan Reference Blackmer and Phelan1995; Ambourn et al. Reference Ambourn, Juzwik and Moon2005; Kyhl Reference Kyhl2006; Hayslett et al. Reference Hayslett, Juzwik and Moltzan2008). In our study, habitat type, season, and trap type interactions influenced C. sayi daily catch rates, whereas main effects of habitat type and season were significantly associated with Co. truncatus captures. Consistent with our findings on the effects of trap type, DiGirolomo et al. (Reference DiGirolomo, Munck, Dodds and Cancelliere2020) caught significantly more C. sayi in Lindgren funnel traps than in wind-oriented pipe traps, whereas no differences were found between the two traps for Co. truncatus. Disparity in the sizes of Lindgren funnel trap and wind vane trap and a mesh screen potentially preventing C. sayi entry into the wind vane trap could explain the differences in C. sayi captures by trap type in the present study.
Urban forests were the most significant habitat reservoirs of C. sayi and Co. truncatus in our study. This novel finding could have management implications as the disease expands its range into eastern Canada. A small number of nitidulid beetles carrying viable B. fagacearum spores are sufficient to infect a tree and start a new infection centre (Norris Reference Norris1953; McMullen et al. Reference McMullen, Shenefelt and Kuntz1960; Shelstad et al. Reference Shelstad, Queen, French and Fitzpatrick1991). Occurrence of oak wilt–affected trees could amplify activity of certain sap beetle species, resulting in more beetles visiting diseased trees, acquiring B. fagacearum spores, and potentially facilitating a wider dissemination of the pathogen (Shelstad et al. Reference Shelstad, Queen, French and Fitzpatrick1991; Ambourn et al. Reference Ambourn, Juzwik and Moon2005; Jagemann et al. Reference Jagemann, Juzwik, Tobin and Raffa2018). However, the risk of disease spread varies spatio-temporally within the range of oak wilt in the United States of America (Gibbs and French Reference Gibbs and French1980) and, in the case of vector-mediated spread, may be modulated by multiple interacting factors, including the period of peak activity and abundance of vector insects, the number of vectors carrying viable fungal propagules, proximity to infected trees or sites, concurrent occurrences of susceptible (i.e., those with fresh wounds) tree hosts, and site characteristics such as host tree distribution and topography (Craighead et al. Reference Craighead, Morris and Nelson1953; McMullen et al. Reference McMullen, Shenefelt and Kuntz1960; Bowen and Merrill Reference Bowen and Merrill1982; Ambourn et al. Reference Ambourn, Juzwik and Moon2005; Jagemann et al. Reference Jagemann, Juzwik, Tobin and Raffa2018; Stevens et al. Reference Stevens, Zhu, Bushman and Huang2024). Taking these observations and recommended guidelines (O’Brien et al. Reference O’Brien, Mielke, Starkey and Juzwik2011) into consideration, city foresters can strengthen disease surveillance, for example, by focusing on urban forests to contain potential oak wilt propagation. Measures could include monitoring for signs of fresh injury on oak trees in the spring and early summer, accurately diagnosing and eliminating localised infection foci, and managing certain vegetation characteristics (e.g., coarse woody debris) that may support sap beetle populations. Preliminary vegetation assessments (unpublished data) of our study sites suggested a moderate correlation between coarse woody debris (> 3 cm) and abundances of C. sayi and Co. truncatus. Coarse woody debris has been shown to be positively related to sap beetle abundance in general (Rieske and Buss Reference Rieske and Buss2001). Further studies are needed to conclusively establish the relationship of this and other site vegetation characteristics with C. sayi and Co. truncatus abundances.
Another key finding in the present study was that topographic variables were more strongly associated with captures of C. sayi and Co. truncatus than were weather variables. Sites at higher elevations, on steeper slopes, or having south-facing terrains supported greater numbers of C. sayi and Co. truncatus than did those at lower elevations, on flatter terrain, or having north-facing aspects. These results indicate that micro-climatic conditions may be important determinants of C. sayi and Co. truncatus flight activity. It is well recognised that local terrain and vegetation factors such as tree density, composition, and percent canopy closure directly influence subcanopy air and soil temperatures, wind flow, relative humidity, and sunlight exposure (Chen et al. Reference Chen, Saunders, Crow, Naiman, Brosofske and Mroz1999) that, in turn, can influence beetle communities in forests (Lettenmaier et al. Reference Lettenmaier, Seibold, Bässler, Brandl, Gruppe, Müller and Hagge2022). Several previous studies have highlighted the role of multiple factors, including solar exposure (open or closed canopies), topographic features, site type, dead wood volume, or combinations thereof, on abundances of fungus-feeding beetles (Müller et al. Reference Müller, Noss, Bussler and Brandl2010; Johansson et al. Reference Johansson, Gibb, Hjältén and Dynesius2017; Parisi et al. Reference Parisi, Mazziotta, Vangi, Tognetti, Travaglini and Marchetti2023; Sbaraglia et al. Reference Sbaraglia, Thorn, Ambrožová, Bässler, Čížek and Kozel2025). Similarly, differences in habitat conditions, site physical attributes, and heterogeneities in fungal communities and competitors across sites may have influenced the abundances of C. sayi and Co. truncatus in the present study, although more empirical data are necessary to quantify these relationships. To our knowledge, no previous research has investigated the relationship between topography and captures of oak wilt vectors. However, associations of oak wilt disease and topographic variables have been studied (Bowen and Merrill Reference Bowen and Merrill1982; Stevens et al. Reference Stevens, Zhu, Bushman and Huang2024), providing avenues for further research into sap beetle vectors. Topographic factors such as ridge orientation, elevation, and valley depth, and other influences – for example, soil properties and forest type probability comprising oaks – were found to influence the distribution of oak wilt (Gillespie and True Reference Gillespie and True1959; Bowen and Merrill Reference Bowen and Merrill1982; Stevens et al. Reference Stevens, Zhu, Bushman and Huang2024). In the case of sap beetles, litter depth, vegetation characteristics such as coarse woody debris and herb cover, and topographic aspect may be important in determining abundances (Rieske and Buss Reference Rieske and Buss2001).
Weather variables did not influence the trap captures of C. sayi, whereas a marginal negative association of mean seasonal precipitation with Co. truncatus trap captures was observed. Nonsignificant effects of mean seasonal temperature on average daily trap captures of each of the two species were expected: the most distant trapping sites were only approximately 56 km (Euclidean) apart and, with the sites located on nonmountainous terrain, seasonal weather variations among sites would likely be too minor to elicit a strong association with trap captures. However, in using a predictive software application (BioSIM) to generate interpolated daily temperature and precipitation data at the study sites, we might have missed site-level microclimatic influences on trap captures. These predictions might differ slightly from real-time observations recorded from data loggers installed onsite, and those differences might have concealed any microclimatic signals influencing daily vector dynamics.
When considering the cumulative proportion of trap captures over the entire study duration, degree-day accumulations (> 5 °C) described the trends well. Our results differed from those of Jagemann et al. (Reference Jagemann, Juzwik, Tobin and Raffa2018) in that 10%, 50%, and 90% of C. sayi were caught at 413, 1170, and 1790 degree-days above 5 °C in their study, whereas the corresponding numbers in the present study were 260, 635, and 1085 degree-days above 5 °C, respectively. For Co. truncatus, Jagemann et al. (Reference Jagemann, Juzwik, Tobin and Raffa2018) estimated 157 (versus 45, this study), 354 (versus 550), and 995 (versus 1200) accumulated degree-days (> 5 °C) for 10%, 50%, and 90% captures, respectively. These variations may be attributed to (1) latitudinal differences among locations; (2) potential phenotypic plasticity of C. sayi and Co. truncatus; and (3) differences in start and end dates between the two studies that would constrain the overall trap captures. In addition, the present study’s delayed start in 2021 would have affected our degree-day calculations. Differences in flight activities of C. sayi and Co. truncatus in relation to degree-day accumulations suggest that C. sayi is better adapted to warmer climates. In contrast, Co. truncatus appears to tolerate a larger range of degree-day accumulations than C. sayi does (Fig. 6B). This apparent plasticity suggests that Co. truncatus may have a potentially greater distribution range than C. sayi does.
Extensive research has been conducted on oak wilt vectors in the United States of America (references herein); however, similar work remains sparse in Canada. Fundamental questions persist regarding life cycles, dispersal capacities, population dynamics, and insect–host tree interactions involving sap beetle vectors of the oak wilt pathogen. For example, the long-distance flight capacities of C. sayi and Co. truncatus are poorly understood. Only one study (Morris et al. Reference Morris, Thompson, Hadley and Davis1955) provided proof of the strong dispersal capacity of C. sayi, which travelled at least 1.6 km in 24 hours in response to fresh B. fagacearum mycelial mats. Variations in sap beetle population abundances and diversities over a coarse spatial scale in Canada are unknown. Impacts of disturbances such as forest fires, other insect pests (e.g., spongy moth, Lymantria dispar (Linnaeus) (Lepidoptera: Erebidae); Stump et al. Reference Stump, Bershing, Bal and Kuelheim2024), occurrence of tree diseases, and forest management on sap beetle vectors of the oak wilt fungus need further elaboration. Although potential climate-driven range shifts of C. sayi and Co. truncatus have been modelled and mapped (Pedlar et al. Reference Pedlar, McKenney, Hope, Reed and Sweeney2020), distribution models that incorporate an understanding of vector–habitat associations and other drivers such as topography are needed to provide more accurate projections of species distributions and their abundances. Although it appears reasonable to expect that increased abundances of nitidulid vectors could increase the risk of disease transmission, field-based quantitative evidence to prove this association is lacking. These knowledge gaps highlight the need for further studies to investigate vector distribution and population dynamics, as well as the relationship between vector abundance and disease incidence. Ultimately, a comprehensive approach that includes proactive detection of B. fagacearum on vector insects (Bourgault et al. Reference Bourgault, Gauthier, Potvin, Stewart, Chahal, Sakalidis and Tanguay2022; Gauthier et al. Reference Gauthier, Bourgault, Potvin, Bilodeau, Gustavsson and Reed2024a, Reference Gauthier, Djoumad, Bal, Bilodeau, DiGirolomo and Ony2024b), monitoring the flight phenology of vector populations as climates change (Jagemann et al. Reference Jagemann, Juzwik, Tobin and Raffa2018), exploring pest management options such as biocontrol in high-value stands (Dowd and Vega Reference Dowd and Vega2003), and increasing public awareness regarding oak wilt will contribute to limiting the spread of the disease in eastern Canada.
Conclusions
We provide evidence that nitidulid community compositions and abundances vary by habitat and season, whereas species diversities vary mainly by habitat type. Our study demonstrates that urban forests are important habitat reservoirs of C. sayi and Co. truncatus. Although an empirical relationship between sap beetle vector abundances and increased oak wilt incidence has not been quantitatively established, as a precautionary measure, oak trees in urban forests should be closely monitored because the potential for oak wilt transmission in those sites may be higher. Caplothorax sayi and Co. truncatus are most active between May and July in the Greater Québec City Area, Quebec, with a minor peak or two later in the season, consistent with similar studies in the United States of America.
Our findings support the current recommendation of avoiding pruning during peak vector activity to limit the disease’s spread. Overall, Lindgren funnel traps caught greater numbers of C. sayi than wind vane traps did, but Co. truncatus showed no preference for either trap type. Topographic variables, including elevation, slope, and aspect, are influential predictors of trap captures of the two target species. Ninety per cent of C. sayi and Co. truncatus were caught by 1085 and 1200 degree-days above 5 °C, respectively. Our analyses did not reveal any links between expected daily counts of C. sayi and weather parameters; however, higher mean seasonal precipitations were negatively associated with Co. truncatus captures.
Supplementary material
The supplementary material for this article can be found at https://doi.org/10.4039/tce.2026.10064.
Acknowledgements
We are indebted to Philippe Labrie, Éric Dussault, Jean-François Légaré, Vincent Seigneur, Félix Gagnon, Xavier Archambault, Mathieu Gauvin, Aurélie Richard, and Camille Deslauriers for field and laboratory assistance. We thank Jean-Michel Béland, Pierrick Bloin, and Maud Regnier for assistance with insect identifications and data entry, and the City of Québec (Jérôme Picard, Christian Belanger), City of Lévis (Pierre Prémont), and Université Laval for allowing insect trapping in their respective properties. Discussions with Sharon Reed and Sylvia Greifenhagen, Ontario Ministry of Natural Resources, and Jon Sweeney and Cory Hugues, Canadian Forest Service, Atlantic Forestry Centre, provided initial insights into sap beetle trapping. Natural Resources Canada, under the Pest Risk Management programme, funded this research. We thank the two anonymous reviewers and the subject editor for their insightful comments and suggestions that helped improve the paper.
Competing interests
The authors declare that they have no competing interests.






 Open access

