INTRODUCTION
The Tibetan plateau is regarded as the largest high-altitude area in the world today, as it includes almost all of the world's territory >4000 m a.s.l. (Liu & Chen Reference Liu and Chen2000). This high altitude creates a climate and natural environment that is inherently extreme and unstable (Duan & Wu Reference Duan and Wu2005; Liu et al. Reference Liu, Bao, Duan, Qian and Wu2007), and the cold and arid continental climate and short growing season are important factors that lead to scarcity of feedstuffs and limitations on animal production (e.g., yaks) in this region (Long et al. Reference Long, Dong, Wei and Pu2005). One important crop that has been introduced for local animals and people of the Tibetan plateau is forage oat (Avena sativa L.), which offsets the shortage of feedstuffs to some extent in the winter and spring. Generally, the straw and the grain (as a concentrate) are fed to animals separately.
Previous studies have noted that forage oat yield (e.g., straw and grain) is very responsive to nitrogen (N) fertilization. Total above-ground biomass increases linearly within a certain scope of increasing N fertilization, but excessive N fertilization has been found to result in a reduction in biomass yield (Ohm Reference Ohm1976; Marshall et al. Reference Marshall, Kolb and Roth1987; Rezende et al. Reference Rezende, Freitas, Costa, Fonseca, Lage, Leal, Saastamoinen, Fradinho, Santos and Miraglia2012; Zhao et al. Reference Zhao, Ren, Liu and Zhao2013; Redaelli et al. Reference Redaelli, Scalfati, Ciccoritti, Cacciatori, De Stefanis and Sgrulletta2014). The optimum time of fertilization and harvest has also been well established by plant scientists to maximize the biomass yield and produce well-balanced nutrient accumulation (Morris & Gardner Reference Morris and Gardner1958; Collins et al. Reference Collins, Brinkman and Salman1990; Contreras-Govea & Albrecht Reference Contreras-Govea and Albrecht2006). However, the impact of N fertilization strategy on the microbial digestibility and fermentability of forage oat straw (FOS) has not been reported previously for ruminant animals.
Rumen microbes play an important role in fibre degradation in ruminants, and in vitro techniques have been used extensively in feed evaluations and in studies of ruminal fermentation because they are less expensive, less-time consuming and allow a more precise and consistent maintenance of experimental conditions than in in vivo trials. Since the late 1970s, measurement of in vitro fermentation gas production has been widely accepted for determining feed digestion characteristics and fermentation kinetics, and a positive correlation between gas production and ruminal digestibility has been established (Menke & Steingass Reference Menke and Steingass1988). The first objective of the present study was to evaluate whether urea N fertilization rate would affect biomass yield, nutrient accumulation and the ruminal fermentation profiles of FOS grown under well-controlled planting conditions. The second objective was to determine an optimum N fertilization strategy for forage oats that would control fertilizer costs and yet still maximize the nutrient accumulation, digestibility and rumen fermentability of oat straw as an important forage resource on the Tibetan plateau.
MATERIALS AND METHODS
Experimental site
The current fertilization experiment was conducted from April to August of 2013 at a site in the Lhasa Agricultural Experiment Station at the Chinese Academy of Sciences in Tibet. The site (29°40′N, 91°20′E, 3688 m a.s.l.) is located in the semi-arid temperate plateau monsoon climate zone (Leber et al. Reference Leber, Holawe and Häusler1995) and has an annual mean precipitation of 439 mm. The annual solar radiation is 7026·6 MJ/m2 and the atmospheric pressure is 61 k Pa. The soil has 20 g organic matter/kg, 0·84–1·03 g total N/kg and 0·15–0·26 g total phosphorus/kg.
Experimental design and forage oat straw harvest
This completely randomized experiment was conducted on forage oats (A. sativa L. ‘Qinghai 444’) planted in 36 field plots (3 × 5 m2). The effect of different N fertilization levels on the nutrient quality of FOS was examined by applying six urea N levels: 0 (control), 156, 258, 363, 465 and 570 kg N/ha. Each N amount was applied in three splits (0·4, 0·3 and 0·3 of the total amount), and spread evenly on the soil surface prior to irrigation at the following growth stages (GS): seeding (GS 0), stem elongation (GS 32) and heading (GS 49) (Zadoks et al. Reference Zadoks, Chang and Konzak1974). Six field plots were arranged for each N level.
The forage oat seeds were drill-sown with 25 cm spacing between rows on 20 April 2013. Time of maturity was determined using kernel hardness (i.e., how difficult it is to split the grain using a thumbnail) and recorded. Plant height was measured and then the plants within each plot were harvested at the node 3–4 cm above ground. The forage oat grains were removed and 36 FOS samples (500 g) were collected from each plot. During harvest, the weights of the entire plant and the removed grains were measured for each plot. The dry matter (DM) yield of FOS and grain was determined after oven-drying the samples at 65 °C to a constant weight. The dried FOS samples were ground in a ball mill, passed through a 1-mm screen and stored at −4 °C for later chemical analysis and in vitro batch cultures.
Animals, diet and rumen fluid collection
Four rumen-cannulated lactating Holstein dairy cows (weighing 530 ± 31·2 kg and producing 51 ± 8·5 days in milk with a daily yield of 17·2 ± 0·77 kg) were used as donor animals for rumen fluid collection. The animals were housed in individual tie stalls (9 m2), each of which had troughs for water and feed. The nutrient requirements of a Holstein cow yielding 20 kg of milk/day with 3·5% milk fat, according to the Chinese Feeding Standard of Dairy Cow (China Standard NY/T 34 2004), were met by feeding the cows daily with a total mixed ration of 4·0 kg alfalfa hay, 3·5 kg whole maize silage and 5·5 kg commercial concentrate consisting of 530 g maize meal/kg, 140 g soyabean meal/kg, 70 g cotton seed meal/kg, 40 g rape seed meal/kg, 120 g distillers dried grains/kg, 10 g limestone/kg, 10 g calcium hydrogen phosphate (CaHPO4)/kg, 10 g sodium chloride (NaCl)/kg, 10 g sodium bicarbonate/kg and 10 g trace mineral and vitamin premix/kg. The ration was divided into two equal portions and fed to the cows at 07 : 00 and 19 : 00 h.
The rumen fluid was obtained from four animals 1 h before feeding, filtered through four layers of gauze and mixed in equal proportions to achieve a representative rumen fluid. A container filled with rumen fluid was then purged with anaerobic carbon dioxide (CO2) for 10 s to remove headspace air and sealed with a butyl rubber stopper and a screw cap. The rumen fluid was held in a water-bath at 39 °C and continuously purged with anaerobic CO2 for later in vitro batch inoculation. All animal care, surgical procedures and rumen fluid collections were approved by the Institutional Animal Care and Use Committee at China Agricultural University.
In vitro batch culture and sampling procedure
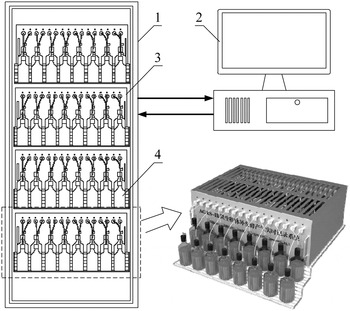
The FOS samples (500 mg) were weighed into a total of 72 glass bottles (six N levels × six field plots × two bottles per plot) with butyl rubber stoppers. A buffer solution (pH 6·85) was freshly prepared following the method of Menke & Steingass (Reference Menke and Steingass1988) and 50 ml was added to each bottle. Under a stream of nitrogen gas (N2), each bottle was inoculated with 25 ml of filtered rumen fluids, purged with anaerobic N2 for 5 s to remove headspace air and sealed with a butyl rubber stopper and a screw cap. Thirty-six bottles were individually connected with medical plastic infusion pipes to the gas inlets of a fully automated trace gas recording system, shown in Fig. 1 (AGRS-III, China Agricultural University, Beijing, China) for continuous recording of gas production (Zhang & Yang Reference Zhang and Yang2011). Three fermentations without the substrate were included as blanks. The other 36 bottles were purged with anaerobic N2 for 5 s, sealed with butyl rubber stoppers and individually connected to emptied air bags to collect the fermentation gases for later analysis of CO2, methane (CH4) and hydrogen gas (H2); three fermentations without a substrate were also included as blanks. All bottles were incubated at 39 °C for 72 h. This batch culture experiment was performed three times.
The 64-channel automated trace gas recording system used in the present study. The system consists of (1) a temperature-controlled incubator, (2) an industrial computer equipped with data acquisition cards, (3) four sets of 16-channel gas recording units equipped with differential pressure transducers and electronic solenoid valves as shown in lower right 3D picture and (4) sixty-four glass bottles with butyl rubber stoppers and Hugate's screw caps.

After each 72-h incubation, the cumulative gas production volumes against incubation time were exported into a Microsoft Excel datasheet from the fully automated trace gas recording instrument, and three 1·0 ml gas samples were taken by syringe from the air bags for later analysis. The entire biomass cultures (75 ml) in all bottles were transferred to 100-ml Falcon tubes and centrifuged at 3500 g at room temperature for 15 min. The final pH of the supernatants was measured immediately using a pH meter. Aliquots (5 ml) of the supernatants were transferred to polypropylene tubes for microbial N analysis. A second 5-ml aliquot of each supernatant was transferred to polypropylene tube that contained 0·5 ml of 50 g/l phosphoric acid (H3PO4) for ammonia N analysis. A third aliquot (1 ml) of each supernatant was transferred to a polypropylene microtube that contained 0·3 ml of 250 g/l orthophosphoric acid solution. The mixture was cooled at 4 °C for 2 h and centrifuged at 15 000 g for 10 min at 4 °C. The resulting supernatant was frozen at −20 °C for volatile fatty acid (VFA) analysis. These sampling procedures followed the methods described by Yang et al. (Reference Yang, Zhuang, Meng, Zhang and Cao2014).
Chemical analysis
The supernatants were analysed for their concentrations of microbial N, ammonia N, acetate, propionate, butyrate, valerate, iso-butyrate and iso-valerate. The microbial N concentrations were determined based on purines using the method of Zinn & Owens (Reference Zinn and Owens1986), as modified by Makkar & Becker (Reference Makkar and Becker1999). The concentration of ammonia N in the supernatants was analysed by spectrophotometry (Verdouw et al. Reference Verdouw, Van Echteld and Dekkers1978) at 540 nm in a microplate reader (RT-6500, Shenzhen Rayto Life Science Co. Ltd, Shenzhen, China). The concentrations of acetate, propionate, butyrate, valerate, iso-butyrate and iso-valerate in the supernatants and CH4, CO2 and H2 in the air bags were measured according to the method of Zhang & Yang (Reference Zhang and Yang2011). The concentrations of acetate, propionate, butyrate, valerate, iso-butyrate and iso-valerate were measured by a flame ionisation detector in a gas chromatograph (GC522, Wufeng Instruments, Shanghai, China). The concentrations of CH4, CO2 and H2 were measured by the same gas chromatography using a 2 m stainless steel column (2·0 mm inner diameter) packed with TDX-1. The temperature of the injector oven, column oven and detector were 120, 80 and 200 °C, respectively. Pure N2 was used as carrier gas, and peaks were identified by comparison with a standard of known composition.
The chemical composition of the FOS samples was analysed following the AOAC (1999) methods for DM (ID 930·5), crude protein (CP, ID 984·13) and ash (ID 942·05). Both neutral detergent fibre (NDF) and acid detergent fibre (ADF), corrected for residual ash content, were measured following the methods of Van Soest et al. (Reference Van Soest, Robertson and Lewis1991).
Biometric analysis
The cumulative gas production (GP t , ml/g DM) at time (t) for 36 fermentation bottles was fitted to an exponential model (Eqn (1)) by iterative regression analysis (France et al. Reference France, Dijkstra, Dhanoa, Lopez and Bannink2000) using the nonlinear procedure of the software package SAS for Windows (version 9.02; SAS inst., Cary, NC, USA):
 $$G{P_{\rm t}} = A{\rm ^{\prime}}[1{\rm} - {e^{{\rm -} {\rm c}}}^{{\rm ^{\prime}}\left( {{\rm t - Lag}} \right)} ]$$
where ‘A’ represents the asymptotic GP t generated at a constant fractional rate (c) per unit time (h); ‘e’ is the base of a logarithm; ‘t’ is the gas recording time (h), and Lag stands for a lag time (h) phase before the GP commenced.
Following the method of Garcia-Martinez et al. (Reference Garcıa-Martınez, Ranilla, Tejido and Carro2005), the average gas production rate (AGPR, ml/h) between the start of the incubation and the time at which the cumulative gas production was half of its asymptotic value, calculated as:
 $$AGPR = \displaystyle{{A \times c} \over {2 \times (Ln2 + c \times Lag)}}$$
The sum of the analysed CH4, CO2 and H2 was calculated as the total gas produced in molar proportion (m/100 m), which excluded N2, residual O2 and water vapour in the headspace gas of each bottle. Finally, molar proportions of CH4, CO2 and H2 in total fermentation gases were calculated prior to statistical analysis. Branch-chained VFA (BCVFA) was calculated as a sum of isobutyrate and isovalerate. The ratio of non-glucogenic-to-glucogenic acids (NGR) was calculated (Ørskov Reference Ørskov1975) as:
 $$NGR = \displaystyle{{Acetate + 2 \times Butyrate + Valerate} \over {Propionate + Valerate}}$$
Based on chemical analysis and gas production, metabolizable energy (ME) estimates were calculated using the equations described in previous studies (Close & Menke Reference Close and Menke1986; Menke & Steingass Reference Menke and Steingass1988).
The experimental data consisted of six N levels, six field plots per N level, two substrate replicates per field plot and three runs, making a total of 216 observations. After averaging substrate replicates within an experimental run, the data of 108 observations were subjected to one-way analysis of variance using the general linear model procedure of the software package SAS for Windows (version 9.02; SAS inst., Cary, NC, USA). The model applied was:
 $${Y_{ijk}} = {\rm} \mu {\rm} + {R_i} + {\rm} {F_j} + {\rm} {P_k} + {e_{ijk}}$$
where Y ijk is the dependent variable under examination; μ is the overall mean; R i is fixed effect of experimental run (i = 3); F j is fixed effect of urea N fertilization level (j = 1); P k is random effect of field plot (k = 6) and ε ijk is the error term. Least square means and standard error (s.e.m.), adjusted by the Tukey's method, were calculated using the least square means procedure of the SAS software package (version 9.02; SAS inst., Cary, NC, USA), and orthogonal polynomial contrasts were performed to determine linear and quadratic effects of the urea N fertilization level. Correlation coefficients between chemical composition and fermentation characteristics were calculated using the SAS software package. Significance was identified at P < 0·05.
RESULTS
Effect of nitrogen fertilizer level on forage oat development and biomass yield
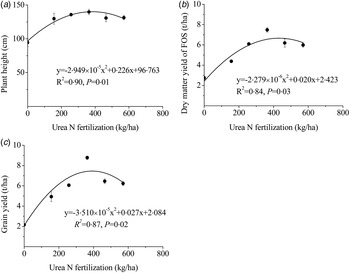
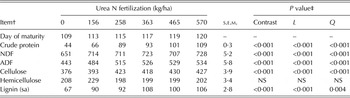
As shown in Table 1, the day that maturity was reached was prolonged from 113 to 120 days in response to N fertilization. As shown in Fig. 2, plant height was 3·7–10·1% higher in the N fertilization treatment than in the control plot (P = 0·01), and the tallest plants occurred at the N level of 363 kg/ha. Nitrogen fertilization promoted quadratic increases in forage oat height (3·7–10·1% increase), and in yields of FOS (60–172% increase) and oat grains (129–307% increase).
Influence of urea N fertilization level on plant height (a), dry mater yield of FOS (b) and grain yield (c) of forage oats harvested at mature stage. Data are average values with one s.e. (vertical bars, n = 6).

Influence of urea N fertilizing level on chemical composition (g/kg dry matter) of forage oat straw*.

N, nitrogen; NDF, neutral detergent fibre; ADF, acid detergent fibre; NS, not significant.
* Forage oat was planted in 36 randomized land blocks (3 × 5 m) per urea fertilizing level, and the number of observations used in the statistical analysis for each urea N fertilizing level was n = 6.
† Crude protein, nitrogen concentration × 6·25; NDF, neutral detergent fibre corrected for residual ash; ADF, acid detergent fibre corrected for residual ash; Lignin (sa), acid detergent lignin determined by solubilization of cellulose with sulphuric acid.
‡ Contrast means contrast effect between the zero control and urea N fertilization; L and Q represent linear and quadratic effect of urea N fertilization, respectively.
Effect of nitrogen fertilizer level on nutrient accumulation and metabolizable energy
As shown in Table 1, increasing N fertilization resulted in quadratic increases in the contents of CP (50–147·7%), NDF (8·6–11·8%), ADF (9·3–20·5%), cellulose (4·5–14·4%) and lignin (34·3–61·2%) (P < 0·001). The peak accumulation of CP, NDF and ADF occurred at the urea N level of 570 kg/ha, while that of lignin (sa) was noted at the urea N fertilization level of 465 kg/ha and of cellulose at 363 kg/ha. The hemicellulose content was not affected by urea N fertilization.
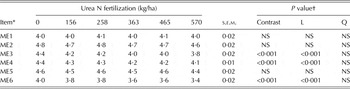
As shown in Table 2, the ME3, ME4 and ME6 estimates declined linearly with increasing urea N fertilization (P < 0·001). No significant differences were observed for ME1, ME2 and ME5 estimates when N fertilization was applied, and no significant differences were noted for ME3, ME4 and ME6 estimates for the urea N fertilization levels of ⩽258 kg/ha when compared with the controls.
Influence of urea N fertilizing level on metabolizable energy (ME, MJ/kg dry matter) of forage oat straw.

N, nitrogen; NS, not significant.
* Metabolizable energy (ME) was calculated by applying the following equations (Close & Menke Reference Close and Menke1986; Menke & Steingass Reference Menke and Steingass1988): ME1 = 1·06 + 0·1570 × GP24 + 0·0084 × CP + 0·022 × EE – 0·0081 × ash; ME2 = 2·2 + 0·1357 × GP24 + 0·0057 × CP + 0·0002859 × (EE)2; ME3 = 1·54 + 0·145 × GP24 + 0·00412 × CP + 0·00650 × (CP)2/1000 + 0·0206 × EE; ME4 = 3·16 + 0·0695 × GP24 + 0·000073 × (GP24)2 + 0·00732 × CP/1000 + 0·02052 × EE/1000; ME5 = 1·56 + 0·1390 × GP24 + 0·007400 × CP + 0·01780 × EE; ME6 = 1·20 + 0·1456 × GP24 + 0·00076575 × CP + 0·01642 × EE in which GP24 is 24-h gas production per 200 mg forage oat straw, CP and EE are crude protein and ether extract expressed in g/kg DM.
† Contrast means contrast effect between the zero control and urea N fertilization; L and Q represent linear and quadratic effect of urea N fertilization, respectively.
Effect of nitrogen fertilizer level on gas production kinetics and gas composition
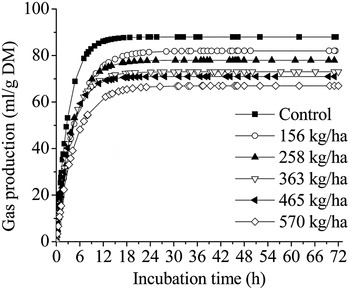
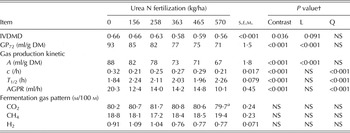
Increasing N fertilization resulted in quadratic decreases in the in vitro dry matter disappearance (IVDMD) (P < 0·001). A significant decrease (⩾12%) was also observed at N fertilization levels ⩾363 kg/ha (P < 0·05). As shown in Fig. 3, cumulative gas production profiles for FOS were influenced by N fertilization. Compared with the control in Table 3, no significant reductions in GP72 and A were observed at N fertilization levels ⩽363 kg/ha. Nitrogen fertilization resulted in quadratic increases in parameter c (P < 0·001) as well as in AGPR, but caused quadratic decreases in T 1/2 (P < 0·001). Nitrogen fertilization did not affect the molar proportions of fermentation end-product gases CO2, CH4 or H2.
Influence of urea N fertilization level on kinetic gas production profiles of forage oat straw incubated with rumen fluid from lactating cows. Urea N fertilization decreased cumulative gas production (P < 0·001).

Influence of urea N fertilizing level on in vitro dry matter disappearance (IVDMD), kinetic gas production and gas end-products of forage oat straw incubated with rumen fluid from lactating cows*.
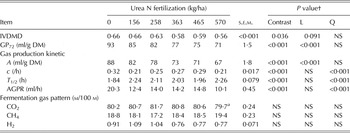
N, nitrogen; IVDMD, in vitro dry matter disappearance; GP72, cumulative gas production at 72 h; A, asymptotic gas production; AGPR, average gas production rate when half of asymptotic gas production occurred; c, constant fractional rate; T 1/2, the time when half of asymptotic gas production occurred; CO2, carbon dioxide; CH4, methane; H2, hydrogen gas; NS, not significant.
* Diluted buffered rumen fluids (75 ml) were incubated for 72 h with 500-mg ground substrate, and the number of observations used in the statistical analysis for each urea N fertilizing level was n = 18.
† Contrast means contrast effect between the zero control and urea N fertilization; L and Q represent linear and quadratic effect of urea N fertilization, respectively.
Effect of nitrogen fertilizer level on in vitro fermentation characteristics
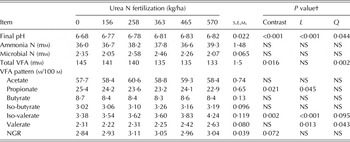
As shown in Table 4, the final pH in the culture fluid increased quadratically as the N fertilization increased (P = 0·029). The CP content of FOS rose with increasing N fertilization, but the ammonia N and microbial N concentrations in the culture fluids were not affected. Comparison with the control revealed that N fertilization (⩾258 kg/ha) decreased the total VFA concentration (a decrease of >7·6%). Increasing N fertilization did not alter molar proportions of acetate, butyrate, iso-butyrate and valerate, but it resulted in quadratic decreases in the molar proportion of propionate (P = 0·021) and increases in the molar proportion of iso-valerate (P = 0·002).
Influence of urea N fertilizing level on fermentation characteristics in cultural fluids of forage oat straw incubated with rumen fluid from lactating cows*.

N, nitrogen; VFA, volatile fatty acids; NGR, ratio of non-glucogenic-to-glucogenic acids; NS, not significant.
* Diluted buffered rumen fluids (75 ml) were incubated for 72 h with 500-mg ground substrate, and the number of observations used in the statistical analysis for each urea N fertilizing level was n = 18.
† Contrast means contrast effect between the zero control and urea fertilization; L and Q represent linear and quadratic effect of urea N fertilization, respectively.
DISCUSSION
Influence of nitrogen fertilization on forage oat yield
The N fertilization delayed maturation of forage oats by 4–11 days, suggesting it promoted vegetative growth and delayed reproductive maturation of the plant. Previous studies have also reported forage oat growth improvements in terms of plant height, lodging score, CP content and biomass yield in response to N fertilization, with the prominent features being an increase in biomass yield and plant height with increasing N supply (Nass et al. Reference Nass, Kunelius and Suzuki1975; Ohm Reference Ohm1976; Coblentz et al. Reference Coblentz, Jokela and Bertram2014). A study using four N fertilization rates and two oat cultivars conducted in the Eastern Canadian prairies showed that grain yields of two cultivars were most responsive to urea N fertilization rates ranging from 15 and 80 kg/ha (May et al. Reference May, Mohr, Lafond, Johnston and Stevenson2004). The total DM yield of forage oats reached 3–5 t/ha under poor soil fertility conditions (Monteiro Reference Monteiro1996; Restelatto et al. Reference Restelatto, Pavinato, Sartor and Paixão2014) and increased to 6–8 t/ha under high soil fertility conditions (Coblentz et al. Reference Coblentz, Jokela and Bertram2014; Restelatto et al. Reference Restelatto, Pavinato, Sartor and Paixão2014). High urea N levels of 112 kg/ha depressed the yield of three oat cultivars, but a urea N fertilization rate of 56–84 kg/ha resulted in the highest yield for different oat cultivars; a quadratic increase, as observed in the present study, was also reported by Brinkman & Rho (Reference Brinkman and Rho1984).
In the present study, N fertilization resulted in quadratic increases both in FOS and grain yield. The quadratic equations in Figs 1(b) and (c) show that the FOS and grain maxima of 7·5 and 8·8 t/ha could be theoretically estimated at urea N fertilization levels of 438 and 385 kg/ha, respectively. The optimum N fertilization rates in Tibet were therefore higher than the levels reported in previous studies, suggesting that a high N fertilization strategy might be necessary for planting forage oats on the Tibetan plateau to obtain a high biomass yield.
Influence of nitrogen fertilization on nutrient accumulation of forage oat straw
Nutrient accumulation responses to urea N fertilization have been reported for forage oat in previous studies. For instance, increases of about 7% in CP content were reported in response to increasing urea N levels for forage oats, as observed in the present study, and the highest CP content of 137 g/kg DM was obtained at a urea N fertilization level of 140 kg/ha (Wang et al. Reference Wang, Wang, Schnug, Haneklaus and Fleckenstein2002). In the present study, an increase in the CP content (50–148% increase) of FOS was observed when the N fertilization level increased from 156 to 570 kg N/ha. Restelatto et al. (Reference Restelatto, Pavinato, Sartor and Paixão2014) noted that the CP content in forage oats was increased by 13–108% (from 204 to 249 g CP/kg) at urea N rates of 37–225 kg N/ha. Although a similar CP increase response to the urea fertilization rate was found in the present study, the CP of forage oats in Tibet was lower than that reported in the previous studies. The 50–148% increase in the CP content suggested that protein accumulation in forage oat plantings in Tibet was indeed sensitive to high N fertilization.
Carbohydrates can be divided into two main fractions: fibre carbohydrates and non-fibre carbohydrates. Fibre carbohydrates consist of cellulose, hemicellulose and a portion of pectin, while non-fibre carbohydrates consist of sugars, starches, pectins and short chains of cellulose-like substrates (e.g., β-glucans) (Van Soest et al. Reference Van Soest, Robertson and Lewis1991). Neutral detergent fibre is a measurement of cellulose, hemicellulose and lignin. The high NDF accumulation in response to N fertilization seen in the present study was also reported at three sites where four oat cultivars were planted in the UK (Givens et al. Reference Givens, Davies and Laverick2004). A study of nine adapted oat cultivars ranging in spike heading date from early to late and grown in four distinct soil environments of the US showed that an increasing urea N (0–112 kg/ha) application rate increased the NDF content (46 g/kg increase) only in one environment and decreased it slightly in the other three soil environments (Collins et al. Reference Collins, Brinkman and Salman1990), suggesting that the effect of N fertilization on oat chemical composition depends on the individual growing conditions and also on the oat variety being cultivated.
Acid detergent fibre consists mainly of cellulose and lignin. Malhi et al. (Reference Malhi, Foster and Gill2003) noted that the ADF concentration for a one-time cutting of quack grass (Elytrigia repens L.) was not affected by ammonium nitrate N fertilization ranging from 0–168 kg/ha. A slight decrease in ADF was seen for ammonium nitrate fertilization and two cuttings. A study on the effects of ammonium sulphate fertilization on forage quality in range sites with different topographic structures revealed that the ADF content decreased with ammonium sulphate fertilization, and significant differences were noted between fertilization and topographical aspects (slope direction) (Daşci & Comakli Reference Daşci and Comakli2011). In contrast, N fertilization in the present study presented a linear increase in ADF content of FOS, suggesting that the effect of N fertilization on the forage ADF content mainly depends on N fertilization level, fertilizer N source and plant variety.
Lemus et al. (Reference Lemus, Brummer, Burras, Moore, Barker and Molstad2008) noted linear increases in cellulose and lignin contents of switch grass (Panicum virgatum L.) planted in Southern Iowa, USA, while hemicellulose content declined linearly with increasing N fertilization rates of urea and ammonium nitrate. Four warm-season grasses grown near Ames, Iowa, USA, including big bluestem (Andropogon gerardii Vitman), eastern gama grass (Tripsacum dactyloides L.), Indian grass (Sorghastrum nutrans L. Nash) and switch grass (P. virgatum L.), also showed enhanced cellulose and lignin contents in response to N fertilization rate during 2006 and 2007 (Waramit et al. Reference Waramit, Moore and Heggenstaller2011), in agreement with the present study.
Lignin and cellulose, the most abundant components of forage, decompose slowly and are known to protect forage components from microbial attack because lignin resists degradation and surrounds cellulose, hemicellulose and protein in plant cell walls (Talbot & Treseder Reference Talbot and Treseder2012). Increasing urea N fertilization substantially increased the contents of crude protein, cellulose and lignin (sa) (by 50–148, 5–14 and 34–61%, respectively), and revealed a significantly negative correlation between IVDMD and ADF, NDF, cellulose and lignin, implying that the lignin and cellulose contents were equally suitable predictors of cell wall crosslinks. Lemus et al. (Reference Lemus, Brummer, Burras, Moore, Barker and Molstad2008) noted that the hemicellulose content of switch grass was decreased (<5%) in response to a urea and/or ammonium nitrate fertilization rate increase from 56 to 224 kg N/ha, but no effect of N fertilization was seen on the hemicellulose content of FOS in the present study. Allen et al. (Reference Allen, Harbers, Schalles, Owensby and Smith1976) also reported no effect on bluestem grass hemicellulose content by urea N fertilization.
Influence of urea nitrogen fertilization on the digestibility and metabolizable energy of forage oat straw
The decline in FOS digestibility, as noted by IVDMD, was probably caused by the increased accumulation of NDF, ADF and lignin contents. Although CP accumulation was increased by urea N fertilization, the concomitant rise in fibre and lignin content could play an important role in increasing the physical rigidity within the secondary cell walls of the plant structural tissues. The rise in protein accumulation seen in the present study could presumably be associated with the proteins that are linked with fibres in the plant cell walls; these would not be effectively degraded by rumen microbes. This association is supported by the negative correlation of IVDMD with the crude protein content (Table 5; R = −0·98, P < 0·01). Hogan & Weston (Reference Hogan and Weston1969) noted that organic matter digestibility and cell wall constituents showed little response to fertilization treatment. An increase in CP and NDF contents and a decrease in IVDMD was reported following the application of N fertilization in other forages in previous studies (Bélanger et al. Reference Bélanger, Gastal and Lemaire1992; Bartl et al. Reference Bartl, Gamarra, Gómez, Wettstein, Kreuzer and Hess2009).
Pearson correlation coefficients among fermentation measurements, nutritional composition and gas production kinetics.

*GP72, cumulative gas production at 72 h; A, the asymptotic gas production; AGPR, the average gas production rate when half of ‘A’ occurred; VFA, volatile fatty acids; IVDMD, in vitro dry matter disappearance; NDFom, neutral detergent fibre corrected for residual ash; ADFom, acid detergent fibre corrected for residual ash; Lignin (sa), acid detergent lignin determined by solubilization of cellulose with sulphuric acid; N, nitrogen.
The decline in DM digestibility with forage maturity is usually attributed to the increasing concentration of lignin (Fukushima & Dehority Reference Fukushima and Dehority2000). The IVDMD of two cultivars each of wheat, oats, triticale and barley ranged from 80 to 58% as maturation progressed from the flag leaf to the dough stage, while cell wall constituents, ADF and lignin contents increased with increasing maturation (Cherney & Marten Reference Cherney and Marten1982). Lignin content was highly negatively correlated with IVDMD of the cultivars at each of the six maturity stages (Cherney & Marten Reference Cherney and Marten1982), similar to results observed in the present study (Table 5; R = −0·91, P = 0·011).
In vivo ME determination is very expensive, labour intensive and time consuming for each target forage, and the results are poorly comparable among different laboratories because of the differences in analytical procedures and nutrient concentration (Anderson et al. Reference Anderson, Kerr, Weber, Ziemer and Shurson2012). The development and use of prediction equations to estimate energy content in feeds are very important for providing the determined ME of each target forage. The desired ME value can be obtained readily by incorporating nutrient levels and microbial ability to metabolize forage nutrients; furthermore, the equations can be modified to produce more accurate ME predictions. Among these methods, the ME content predicted by metabolic gas production and nutrient levels has been well established for ruminant animals (Menke et al. Reference Menke, Raab, Salewski, Steingass, Fritz and Schneider1979; Menke & Steingass Reference Menke and Steingass1988). The ME values of FOS in the present study were inferior to those reported for oat straw by the Nutrient Requirements of Beef Cattle (NRC 1996), which were as high as 7·6 MJ/kg DM. The ME values were also inferior to the mean ME value of oat straw estimated using in vivo digestibility trial and in vitro gas test methods, which were as high as 9·7–11·1 MJ/kg DM. The present study determined that the six formulas could not reproduce relatively accurate ME values for FOS, even though gas production and CP content presented strong correlative relationships with ME.
A previous study showed that DM yield, crude protein and acid detergent lignin (ADL) contents of tall fescue increased significantly, and the concentration of ME decreased, with increases in applied calcium ammonium nitrate levels from 0 to 150 kg N/ha (Wolf & Opitz von Boberfeld Reference Wolf and Opitz von Boberfeld2003); this trend in response to increasing N was also observed in the present study. In addition to the decrease of IVDMD in response to N fertilization, the drop in ME values can also be attributed to the increase in NDF, cellulose and lignin (sa) contents of FOS in response to increasing N fertilization. The results of the present study indicated that a urea N fertilizer level within the range of 156–363 kg/ha could be recommended for planting forage oats on the Tibetan plateau without excessive reductions in the ME of FOS.
Influence of urea nitrogen fertilization on fermentation characteristics of forage oat straw
In contrast to the results obtained in the present study, negative impacts of increasing urea and calcium ammonium nitrate applications on fermentation gas production have been reported previously by González Ronquillo et al. (Reference González Ronquillo, Fondevila, Barrios Urdaneta and Newman1998) and Lovett et al. (Reference Lovett, Bortolozzo, Conaghan, O'Kiely and O'Mara2004), respectively, using tropical and temperate grasses as substrates. The decrease in cumulative gas production and the fractional gas production rate indicated that the extent and rate of microbial degradation of FOS were decreased when the N fertilization level was >363 kg/ha. A study of 12 hay and silage feedstuffs, including wheat, maize and alfalfa collected in the central valley of California, USA, showed that the CP content of feeds had a negative correlation with in vitro gas production at 24 and 48 h incubation (Getachew et al. Reference Getachew, Robinson, DePeters and Taylor2004). Similar characteristics were also observed in other forages, as noted in a previous study by Islam et al. (Reference Islam, Garcia and Horadagoda2012), which was consistent with the results obtained in the present study. The observation of no differences in the proportions of molar H2, CO2 and CH4 suggested that the N fertilization probably did not alter the rumen microbe composition (i.e., bacteria, protozoa, fungi and methanogens).
Normal rumen pH values are in the 6·4–6·8 range (Jouany Reference Jouany2006); the final pH values of all treatments in the present study were all in this normal range. Obara et al. (Reference Obara, Dellow, Nolan, Tsuda, Sasaki and Kawashima1991) observed a decrease in rumen pH on a sugar-supplemented diet compared with an un-supplemented diet (Obara et al. Reference Obara, Dellow, Nolan, Tsuda, Sasaki and Kawashima1991), and researchers have reported that the inclusion of supplemental non-fibre carbohydrates in forage-based diets caused high acidic by-product concentrations during ruminal fermentation, thereby inducing rumen acidification (Mould & Ørskov Reference Mould and Ørskov1983; Mould et al. Reference Mould, Ørskov and Mann1983; Fondevila et al. Reference Fondevila, BarriosUrdaneta, Balcells and Castrillo2002). In contrast, the fermentation of a high-fibre diet could avoid this pH decrease in the rumen, and a positive correlation between the final pH and fibre content was observed in the present study.
Some studies have shown that a higher level of CP (e.g., 124–181 g/kg) improved microbial CP synthesis in swamp buffalo (Chanthakhoun et al. Reference Chanthakhoun, Wanapat and Berg2012). Conversely, the present study reported that the high CP content of FOS was caused by a high level of N fertilization, but no enhancement was noted in ammonia N and microbial N concentrations in the present study. Given that the majority of CP was tightly cross-linked into the wall with polysaccharides, its release could be difficult due to the high content of lignin and cellulose in the cell wall (Cassab Reference Cassab1998). The lack of any significant differences in either ammonia N and the microbial N concentrations in the present study could be due to the unavailability of CP in the FOS to the rumen microbes.
Micro-organisms in the rumen have been verified to ferment a wide range of substrates (e.g., cellulose, hemicellulose, pectin, starch and soluble sugars) to produce VFAs; these substrates are degraded to their constituent hexoses and pentoses before being fermented to VFAs via pyruvate. After a complex biochemical reaction, pentoses and hexoses are converted to various types of VFAs. The production of VFAs could also indirectly reflect the microbial growth performance and the potential of microorganisms to degrade the substrates (Yang et al. Reference Yang, Zhuang, Meng, Zhang and Cao2014). In the present study, the decrease of total VFAs in response to increasing N fertilization indicated that microbial VFA metabolism was decreased, and this could be caused by increased NDF, ADF and lignin contents due to urea N fertilization. Acetate, butyrate, iso-butyrate and valerate proportions were not affected by urea N fertilization in the present study, which indicated that the fermentation pattern (including lactic acid and acetone–butanol fermentation pathways) were not altered; the rumen microorganism composition therefore may be not affected as these particular microbial groups generated specific VFA end-products.
Propionate formation occurs mainly via succinate, although an alternative pathway (succinate and acrylate pathway) involving acrylate is also operative. Starch-rich concentrate diets are well known to favour the development of propionate-producing bacterial species, and they are associated with an increase in the proportion of propionate (France & Dijkstra Reference France, Dijkstra, Dijkstra, Forbes and France2005), indicating that the decrease in the propionate proportion in response to increasing urea fertilization might be due to increases in non-starch components (ADF, NDF and lignin). Iso-valerate is derived from leucine via transamination, but only a small proportion of transamination occurred (Satter & Slyter Reference Satter and Slyter1974), indicating that a potential association among CP degradation, leucine hydrolysis and iso-valerate synthesis may also exist.
In summary, the current urea N fertilization protocol extended the growth and maturation periods and increased the grain and straw yields of forage oats grown under the extreme conditions on the Tibetan plateau. Urea N fertilization substantially increased the protein and cellulose accumulation in FOS, but the accompanying 34–58% increase in lignin content severely limited the digestibility and fermentability of FOS. To avoid this negative effect of increased lignin content, the recommended urea N fertilization rate should not exceed 363 kg/ha for forage oats grown on the Tibetan plateau to ensure fermentability and digestibility of the forage oat straw.
The present study was funded by the Research and Demonstration on Key Techniques of Safety Growing and Efficient Use of Forage Grass in One River, Two Streams area in Tibet of China (Project no. Z2013C02N02), National Science and Technology Support Plan Projects (Project no. 2014BAD14B00) and the Importation and Development of High-Caliber Talents Project of Beijing Municipal Institutions (Project no. CIT&TCD20130324). The authors also appreciate T. T. Guo, Y. H. Zhang, Y. X. Fang and R. H. Guo for their assistance in sample collection and chemical analysis, etc.