
Introduction
Natural plasticizers have been studied in biodegradable films, and several researchers have developed works with a focus on fatty acid from vegetable oils.[Reference Schlemmer and Sales1, Reference Yu, Dean and Li2] M. J. Sales research group[Reference Schlemmer and Sales1] studied the plasticizer-like features of starch films using fatty acids found in some fruits of the Brazilian savannah—“the Cerrado”, the second largest biome in Brazil.[Reference Schlemmer and Sales1] The vegetable oils of “Pequi” (Caryocar brasiliense) and of “Buriti” (Mauritia flexuosa L.), when mixed with starch, could produce flexible films with good thermal stability.[Reference Schlemmer and Sales1, Reference Schlemmer, Angélica and Sales3]
Even though biodegradable polymers from renewable sources are good alternatives for the industry, synthetic polymers are preferred because of their superior physical properties, such as high softening point and modulus.[Reference Ray4] In this case, the inclusion of other particles, known as fillers, is an important strategy to improve the properties of biodegradable polymers.[Reference Schlemmer and Sales1–Reference Ray4]
A class of promising materials is polymer–clay nanocomposites (PCNs),[Reference Schlemmer, Angélica and Sales3–Reference Scocchi, Posocco, Danani, Pricl and Fermeglia6] produced when a polymer matrix is mixed with clay granules—filler agents—in nanometric proportion. Since polymers from natural sources are part of a class of organic materials with desirable properties of degradation and biocompatibility, several authors have studied the combination of biodegradable polymers and nanofillers to achieve biodegradable PCNs.[Reference Yu, Dean and Li2–Reference Ray4, Reference Lin7, Reference Kampeerapappun, Aht-ong, Pentrakoon and Srikulkit8]
Among the possible reinforcements used in PCNs, montmorillonite (MMT) has received attention due to its size,[Reference Scocchi, Posocco, Danani, Pricl and Fermeglia6] to its intercalation properties,[Reference Gournis, Lappas, Karakassides, Többens and Moukarika9, Reference Downs and Hall-Wallace10] and its large surface area (as large as 750 m2/g),[Reference Ghavami, Zhao, Javadi, Jangam, Jasinski and Saraei11] and MMT is a mineral from the phyllosilicate group formed by lamellar layers of silicate (SiO4) in tetrahedral and octahedral structuring containing Al3+ and Mg2+ substituent ions. These layers are 1 nm thick and have sides between 200 and 300 nm. MMT may have water molecules scattered between its layers because of its highly hydrophilic nature.[Reference Kampeerapappun, Aht-ong, Pentrakoon and Srikulkit8] Na+, Li+, and Ca2+ ions may also exist amid the layers to balance the total structural charge.[Reference Gournis, Lappas, Karakassides, Többens and Moukarika9, Reference Downs and Hall-Wallace10] MMT and amylose are highly hydrophilic and not chemically compatible with the hydrophobic plasticizer oils.[Reference Schlemmer, Angélica and Sales3] To work around this incompatibility, a quaternary ammonium salt cation is added at the MMT surface in replacement of some Na+ cations as an organophilizing agent.[Reference Schlemmer, Angélica and Sales3] Cations, such as cetrimonium ([(C16H33)N(CH3)3]+), act as cationic surfactants, strongly interacting with the MMT through their polar portions and with the oil through their alkyl groups.
Simulations are useful tools in Materials Science: preparation, processing, and characterization of materials can be better understood after the visualization and rationalization of the interactions between the components of the new system. Molecular Dynamics (MD) is a simulation method that, if adequately parametrized, is a valuable tool in creating new materials; it allows the prediction of a system's behavior and properties, potentially reducing the time spent in experimental design.[Reference Wang, Wohlert, Berglund, Tu and Ågren12]
Wang et al.[Reference Wang, Wohlert, Berglund, Tu and Ågren12] performed MD simulations to study the adsorption of the native and the chemically modified polysaccharide xyloglucan (XG) to MMT clay surfaces in explicit water. Their work shows that a change in enthalpy drives the adsorption process. The molecular structure also plays an important part since XG has a stronger adsorption than modified XG.
Ghavami et al.[Reference Ghavami, Zhao, Javadi, Jangam, Jasinski and Saraei11] used MD and experimental analysis to study the impact of secondary sorption of hydrocarbons on the interlayer morphology of organic-modified MMTs and quantified the interactions between the components of their systems. Their results showed MMT's interlayer expansion due to the addition of organic molecules.
MD and experimental studies by Strašák et al.[Reference Strašák, Malý, Müllerová, Čermák, Kormunda, Čapková, Matoušek, Červenková Šťastná, Rejnek, Holubová, Jandová and Čépe13] showed the non-linear dependence of the d-spacing on the amount of dendrimers in the interlayer space of MMT within the mass ratio interval. This study confirmed areas within the structure where the d-spacing dependence on the concentration of dendrimers approaches a constant correlation, in corroboration with experimental observations.
Our main objective is to simulate amylose chains, and fatty acids in proportions similar to those found in Pequi and Buriti oils, ions, and water, acting as a solvent to observe the system behavior in the presence of organophilized MMT (MMT-O). We intend to study the plasticization effect of the fatty acids, which are already known to act as plasticizers for starch,[Reference Yu, Dean and Li2, Reference Schlemmer14] over amylose, acting as a polysaccharide simplified model, by observing the movement of the fatty acids face to the oligomer chain. Sales research group[Reference Schlemmer and Sales1, Reference Schlemmer, Angélica and Sales3, Reference Schlemmer14] has extensively characterized the material and demonstrated experimentally that the addition of MMT-O in starch with Cerrado vegetable oils film changes its physical properties. We intend to investigate those effects through the atomistic scale, by observing the movement of the organic molecules, its bonded and non-bonded intermolecular forces and structural correlations in the presence of the phyllosilicate.
Methods and computing strategies
From the perspective of computer simulations, a polymer–clay nanocomposite is a complex system due to the mixture of chemical classes of its constituents. Polysaccharides and small organic molecules without repeating units are representative of flexible molecular classes. The mixed organic/inorganic system presents a challenge for accurate force-field parameterization. Several model systems were created for the practical and computational basis of the study.
The structure of MMT was replicated from its crystal unit cell.[Reference Gournis, Lappas, Karakassides, Többens and Moukarika9, Reference Downs and Hall-Wallace10] Heinz et al.[Reference Heinz, Lin, Kishore Mishra and Emami15] developed the polymer-consistent force-field-interface (PCFF-interface)—our choice for the computer simulations—that merges the parameters of clay-FF[Reference Cygan, Liang and Kalinichev16] with those of the original PCFF,[Reference Heinz, Lin, Kishore Mishra and Emami15, Reference Dauber-Osguthorpe, Roberts, Osguthorpe, Wolff, Genest and Hagler17–Reference Sun20] integrating them into a hybrid force field. PCFF-interface[Reference Heinz, Lin, Kishore Mishra and Emami15] includes parameters of organic and inorganic structures and incorporates the capabilities of ion exchange for clays and minerals, thus making it possible to optimize the geometry of the MMT and allowing simulations between the clay mineral and organic compounds to be run.
We also did the study with the progressive analysis of molecular behavior due to changes in the size and the initial form of amylose oligomers; their initial spatial rearrangements related to the molecular assemblies; and the parameterization of dynamic observation times that would be required to those structural rearrangements, ending with the addition of a double layer of MMT. We used the Materials Studio™ software package[Reference Biovia21] for all molecular modeling studies. All dynamic trajectories were carefully analyzed using data correlation graphs from the output files.
For all systems, geometries and energies were optimized by MM through the conjugate gradient algorithm to accuracy set to 2.0 × 10⁻³ kcal/mol, allowing primary corrections and eliminating steric hindrance. Cells with periodic boundary conditions (PBC) were created with dimensions varying according to the number and length of amylose chains. The fatty acids were manually inserted into the cells, near the amylose oligomers, in the proportions as close as possible to those found in the oils. We present the tables with the system atom numbers information and energetic values in the Supplementary Material.
Simulation protocol of MMT-O–amylose–fatty acid–water systems
(i.1) A single layer of Na–MMT was reproduced by adapting the structures from the American Mineralogist Crystal Structure Database.[Reference Gournis, Lappas, Karakassides, Többens and Moukarika9, Reference Downs and Hall-Wallace10] Few sodium ions were replaced by cetrimonium cations, turning the system into MMT-O.[Reference Schlemmer14] Ions formal charges were attributed to Na+, Mg2+, Al3+, for MMT structure, and N+, for cetrimonium. The partial atomic charges distribution for the MMT component under study was obtained from the literature.[Reference Gournis, Lappas, Karakassides, Többens and Moukarika9]
(i.2) Some α-1,4-D-glucose oligomers of different lengths hereby named as “amylose oligomer” were built. The original cells were enlarged to a cubic cell of a = b = c = 100 Å; α = β = γ = 90° and fatty acids were randomly distributed around the amylose chain. The unit cells were filled with water molecules to simulate the experimental conditions.[Reference Schlemmer and Sales1, Reference Schlemmer, Angélica and Sales3] A loop procedure allowed fast spatial rearrangements of the solvent as more molecules were added.
Amounts of around 200 water molecules were progressively added dispersed into the unit cell, and after each addition, the system was reorganized by 20 ps MD trajectories at 500 K, by the Nosé–Hoover thermostat.[Reference Hoover22] The last fluctuation is firstly optimized by 100 iterations of the steepest descent algorithm to avoid steric hindrance, followed by conjugate gradient minimization procedure, until 1.0 × 10⁻³ kcal/mol/Å. Water molecules dispersed into the cell were repositioned or erased to avoid gradient convergence failures, and another set was added to the system. During the loop procedure, the atomic coordinates of all organic molecules were placed under constraints. Then, the constraints were deleted and dynamic trajectory by 200 ps, at 363 K, was carried out. The last frame was optimized until gradient convergence.
(i.3) Then, the molecular system was removed from the cell and transposed to one containing the MMT-O. Two planes parallel to the surface of the MMT—positioned between 12 and 16 Å from two amylose chain atoms closest to two oxygen atoms of the mineral surface—helped us to evaluate the movement of the chemical species. In this step, we would observe the molecular behavior of the solvated organic system face the MMT-O, as well the water flow.
Simulation protocol for the inclusion of two layers of “MMT-O” to previous molecular models
(ii.1) A second layer of MMT was added. Polysaccharides, fatty acids, water, and cetrimonium ions remain confined between two layers of the clay mineral, forming a so-called “gallery.” The size of the c-axis in the cells was arbitrarily chosen to yield an effective two-dimensional periodic system (x, y).[Reference Posocco, Pricl, Fermeglia and Mittal5, Reference Scocchi, Posocco, Danani, Pricl and Fermeglia6, Reference Scocchi, Posocco, Fermeglia and Pricl23]
The second addition of an MMT layer allows the comparison of the distance values measured between the layers and those experimental values acquired by x-rays diffraction, broadening the knowledge about the action of the amylose, fatty acids, and water over the clay mineral.
(ii.2) After mixing the chemical species within the MMT-O gallery, the molecular assembly was reorganized under NVT [the canonical ensemble (constant-temperature and constant-volume ensemble)] ensemble and optimized. An NPT [the isothermal-isobaric ensemble (constant temperature and constant pressure ensemble)]-MD simulation was, then, carried out by 100 ps, the Berendsen barostat[Reference Berendsen, Postma, van Gunsteren, DiNola and Haak24] maintaining the pressure under 1.0 × 10⁻⁴ GPa. The last frame had its energy minimized until 1.0 × 10⁻³ kcal/mol/Å. It is important to notice that at this pressure, every system equilibration should be done with cell optimization.
(ii.3) At the end of the NPT dynamic trajectories, density profiles were calculated for the systems components within the gallery. The profiles were calculated according to Zhou et al.[Reference Zhou, Lu, Liu, Zhang, He, Zhu and Yuan25]
Results and discussions
Pequi–MMT-O system: addition of the amylose–fatty acid–water system to a layer of MMT-O
A surface was built by packing unit cells of MMT (a = 10.36 Å, b = 17.96 Å, c = 15.00 Å, α = 90.00, β = 95.70, and γ = 90.00) along the a-, b-, and c-axes (10 × a, 3 × b, 3 × c, the angle β is set to 90°). The cell dimensions were a = 103.836 Å, b = 54.092 Å, c = 50.046 Å, α = β = γ = 90°. Eleven cetrimonium ions were included and 11 Na+ ions were removed to keep a neutral charge in the system.[Reference Schlemmer14] We used these ions to verify the interaction changes between the system and the MMT layer, if whether the ion showed any special behavior. The resulting MMT-O cell was composed of 6268 atoms.
Then, an assemblage, hereby named as “Pequi”, was made of an organic mixture containing one amylose oligomeric chain of 40 monomeric glucose units, around which the fatty acid molecules were randomly distributed, in a proportion of 13 oleic acids, eight palmitic acids, and one stearic acid molecule. We coarsely optimized the geometry of the system to avoid high-energy moves that could possibly crash the simulation. The loop procedure described in sub-item i.2 was followed, resulting in the participation of 884 water molecules. The full system has reached 4652 atoms. We then removed the position constraints and ran a 200 ps MD simulation at 363 K. The last frame was optimized until gradient convergence of 9 × 10⁻³ kcal/mol/Å.
“Pequi” system was removed from its cell and transposed into the MMT-O unit cell, resulting in 10,920 atoms. Fatty acids, amylose, and water were positioned between 12 and 16 Å of the MMT layer. We coarsely optimized the full system until 1.0 × 10⁻¹ kcal/mol and ran a 200 ps MD simulation at 363 K. Some fatty acids were dispersed around the polysaccharide and were stabilized by hydrogen bonds formed between their polar heads and oxygen atoms of amylose. A significant amount of water molecules covered the amylose chain where there were no fatty acids. The cetrimonium ions were dispersed into the MMT-O cell.
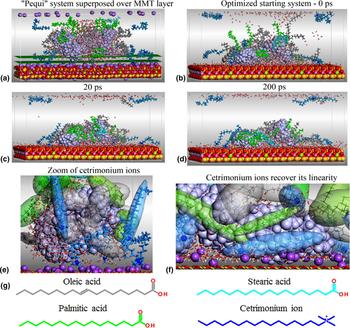
The electrostatic attraction between MMT-O, amylose oligomer, and water molecules is extremely strong. Nevertheless, to obtain the conformational rearrangements and the relative orientations among the organic compounds and the solvent, MD trajectories at 363 K are necessary. The solution was to restrain the convergence criteria in the initial energetic optimization. The evolution of the system is shown in the three first snapshots of Fig. 1.
(a) Frontal view of the starting system, not yet fully optimized. Planes are colored in dark green. Snapshots of system fluctuations over the MMT-O surface at different times of dynamic trajectories, at 363 K: (b) 0 ps, (c) 20 ps, and (d) 200 ps. The MMT and oligomer amylose (lilac) are shown in the space-filling model of Corey, Pauling, Koltun (CPK model), as well as the ions Na+ (violet) and N+ cetrimonium ions (cobalt blue), whose spheres have been reduced for clarity. The atoms of palmitic fatty acids are colored green, light blue for stearic, and the ones of oleic acids, gray. (e) Amylose, fatty acids, and water are still a bit far from the MMT surface. Cetrimonium ions are dispersed: some have extended conformation, while others do not. Those ions are colored in light blue and some are represented by transparent ellipsoids in the same color; quaternary nitrogen atoms are highlighted as CPK in cobalt. (f) Cetrimonium ions retrieve their linearity during the calculation and raise the MMT surface. Part of the amylose also comes up on the MMT. In this case, there are no water molecules between ions and amylose segment. The same happened among fatty acid non-polar chains and amylose. The fatty acids are highlighted by transparent ellipsoids colored in light green and light gray. (g) Graphical overview of the smaller organic molecules to clarify visualization.

At the beginning of the dynamic process, the hydrophobic tails of the fatty acids were already free of water contacts as these were concentrated around the amylose chain. The fatty acids move because they are strongly attracted by MMT through their polar heads. The water molecules that were mostly around amylose migrate to the surface of MMT, but some remain particularly near polar termini of the fatty acids. For over a few picoseconds, the water molecules that were immersed in the cavities formed by the folding of amylose or interacting with the polar core of the fatty acids continue their flow to the MMT surface. A dense network of hydrogen bonds is formed. However, if glucose monomers of the oligomeric chains are disposed of close to the MMT surface in a water-free media, the electrostatic attraction will act until stabilization because the amylose–MMT interactions are not dependent on the water molecules. The amylose chain, which at the beginning of calculation kept a helical shape, changes its form. After the first 20 ps, the overall shape of the system is already consolidated. The dynamic process may continue for a long time, without significant changes. Snapshots of this dynamic process as well as its control graphics are represented in online Supplementary Fig. S1.
Figures 1(e) and 1(f) show the behavior of cetrimonium ions in the simulation. Early in the process, those ions were built in an extended chain conformation. Their chains initially became distorted as the simulation progressed. However, as these ions moved and approached the surface area of MMT—where there are no Na+ ions—they stretched again, regaining its linearity. This behavior had already been detected by Posocco et al.[Reference Posocco, Pricl, Fermeglia and Mittal5] and Scocchi et al.[Reference Scocchi, Posocco, Danani, Pricl and Fermeglia6, Reference Scocchi, Posocco, Fermeglia and Pricl23] and explained the collapse of organophilizing agent against the MMT surface.
To study if there are any behavioral changes due to the amylose oligomer chain length, we built another system containing an amylose chain of 110 glucose monomers surrounded by fatty acids in an amorphous model construction, in which a periodic cell is created with bulk disordered chain systems in equilibrium conformations.[Reference Biovia21] The system was denominated “Amorphous Pequi” to be differentiated from the previous model.
“Amorphous Pequi”–water–MMT-O system
The Amorphous “Pequi” model consisted of a 110-monomer polysaccharide, 14 oleic acids, ten palmitic acids, two stearic acids (≈54%:40%:1%, oleic:palmitic:stearic), and 868 water molecules. Cetrimonium ions were added in the same amounts as the latter system to verify if there is any behavior difference due to the amylose chain increase. The mixture was removed from the amorphous cell and placed over the MMT surface, resulting in 12,555 atoms.
We followed the same protocol described in the previous subsection. All water molecules were randomly distributed in the first frame of the simulation. Progressively, the water flowed along the MMT surface, forming an intermediary layer between the clay and amylose, stabilizing the system through a dense network of hydrogen bonds.
Water-free segments on the chain's surface have a higher concentration of fatty acids, which stretch on the amylose surface in a surprising protective effect. The effect that the non-polar chains of fatty acids do not move in the free spaces around the amylose oligomer was systematically confirmed through the course of the work. On the other hand, this phenomenon could be interpreted as the plasticization physical property observed experimentally. As the sodium ions increase the distance between themselves, cetrimonium's quaternary nitrogen atoms move down toward the clay surface, which stabilizes the ions, and seem to stretch their hexadecyl chain on MMT, reassuming its linear structure.
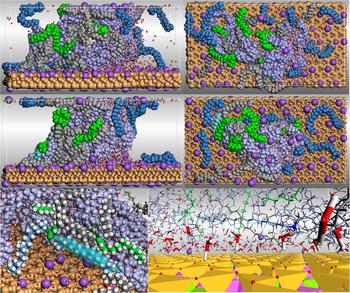
Water molecules initially stabilized around the surface of amylose tend to attach themselves to the MMT surface (Fig. 2). The flow directed to the surface of MMT indicates that very few water molecules tend to stay around the polysaccharide chain,[Reference Wungu, Agusta, Saputro, Dipojono and Kasai26] which suggests that water molecules are energetically more stable when binding the surface of MMT. This may explain the percentage of residual water (~5%) found in the experimental work of Schlemmer.[Reference Schlemmer14] Snapshots of this dynamic process as well as its control graphics are represented in online Supplementary Fig. S2.
(Top) Dynamic trajectory snapshots for Pequi-amorphous composition interacting with MMT-O surface. First line at the top, there are two different perspectives of the original cell submitted to calculation at 363 K. (Middle) Two different perspectives at 60 ps, frontal and top, for visual comparison with the projections at 0 ps; segment of the simulated network, showing two planes of MMT, for better visualization of water molecules distribution. (Bottom) Snapshot of the spatial arrangement of fatty acids around the amylose; a cetrimonium ion is evidenced by ellipsoid (outlined in light blue). The projection on the right shows water molecules intermediating the MMT-O and the organic molecules, resulting in a dense network of hydrogen bonds.
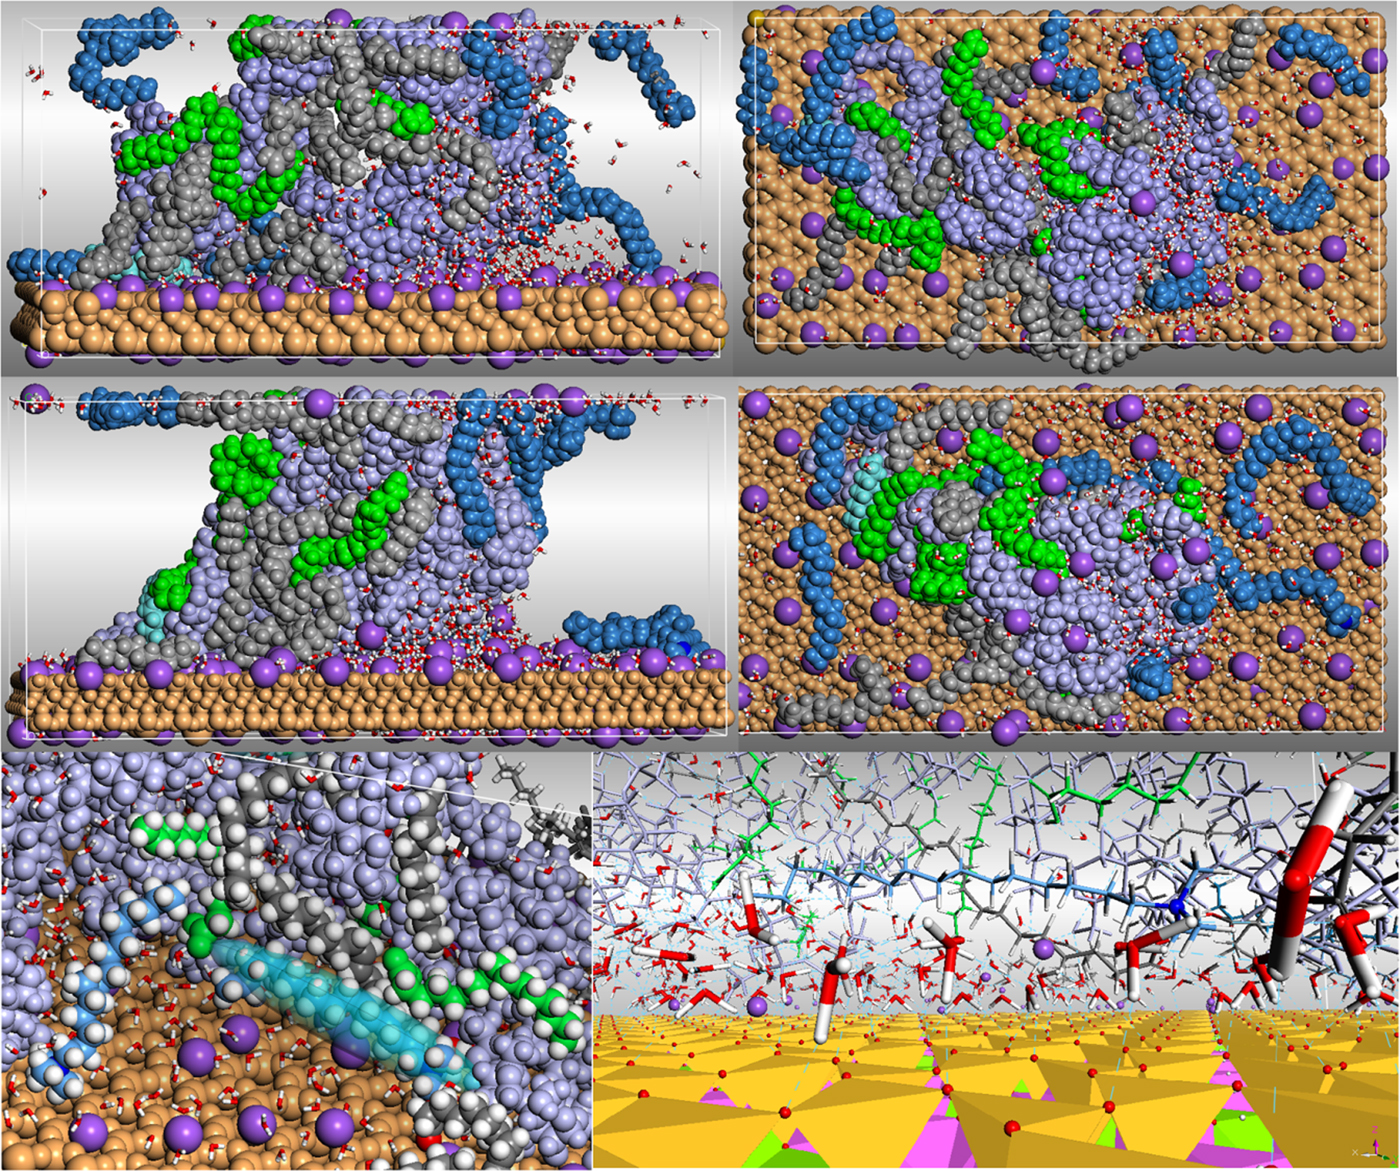
MMT is dense, tightly packed, and highly hydrophilic, and induces the layering of water molecules on its surface due to a dense hydrogen bonding network and strong electrostatic interactions. Our results show that MMT pores do not adsorb water, which agrees with the literature.[Reference Wungu, Agusta, Saputro, Dipojono and Kasai26, Reference Ruiz-Hitzky, Aranda, Darder, Brunet, Colón and Clearfield27] There was no noticeable difference in behavior among oleic, palmitic, and stearic acids. All of them moved while there still was a significant amount of water dispersed throughout the system. When the water flow toward MMT finishes, most of these fatty acids were extended over the surface of amylose. A small portion of fatty acids—initially misplaced—moved toward MMT until it was stabilized.
The cetrimonium ions also moved toward MMT during the conformational adjustment step and during the solvent's reorganization. They became distorted, lost their linearity, and repelled Na+ ions to interact with the clay; as it met the surface, cetrimonium's long hexadecyl chain stretched again and regained its linearity. No important interactions with amylose, fatty acids or water were especially observed.
All simulations showed a high velocity of molecular rearrangement, regardless of the initial system forms. If MMT is not present, the amylose oligomer folds; if MMT is present, its extraordinary electrostatic force attracts the water, amylose, and cetrimonium ions to its surface. Nevertheless, it does not attract significantly the polar core of the fatty acids, which remain interacting with the structural amylose chain.
The effect induced by the length of the amylose oligomers is observed in the two models above described (Figs. 1 and 2). Both amylose segments were inserted into unit cells with the same dimensions (online Supplementary Tables SI and SII). The shorter segment is attracted by phyllosilicate until stabilization over the MMT layer. However, when the chain length is longer enough, it is also attracted by the MMT layer present in the upper simulated cell, reproduced by PBC conditions. All other effects such as water flow, potential plasticization between fatty acids and oligomers, and stabilization of the cetrimonium ions over MMT layers are the same in both cases.
Inclusion of two layers of the MMT–amylose–fatty acid–water system
MMT-O gallery
Two significant changes in our approach are described hereafter. Organic compounds into water were positioned between two surfaces of MMT, and after optimization, the system was submitted to an MD simulation under NPT conditions at 1.0 × 10⁻⁴ GPa and 363 K. The unit-cell dimensions were progressively adjusted. The cell dimensions were adjusted over the calculation using the “adjust unit-cell” feature.
Our model was made of two amylose chains of 25 monomers each disposed between two layers of MMT. Fatty acids were placed perpendicularly to a halfway plane between the two oligomers, in the proportion of 10:5:1 oleic:palmitic:stearic acids. Water molecules were introduced randomly around the amylose chains; the cetrimonium ions were added substituting the corresponding Na+ ions. The total number of atoms in the asymmetric unit was 14,771, and its initial dimensions were a = 103.836 Å, b = 54.092 Å, c = 60.091 Å, α = β = γ = 90°. The c dimension allows the amylose chains to be positioned away from each other. The protocols for molecular reorganization under NVT ensemble and for studies under NPT ensemble were respected.
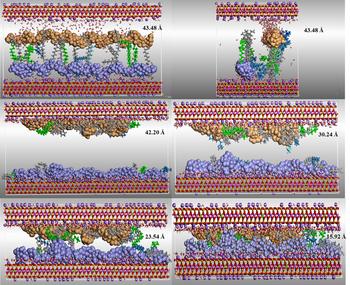
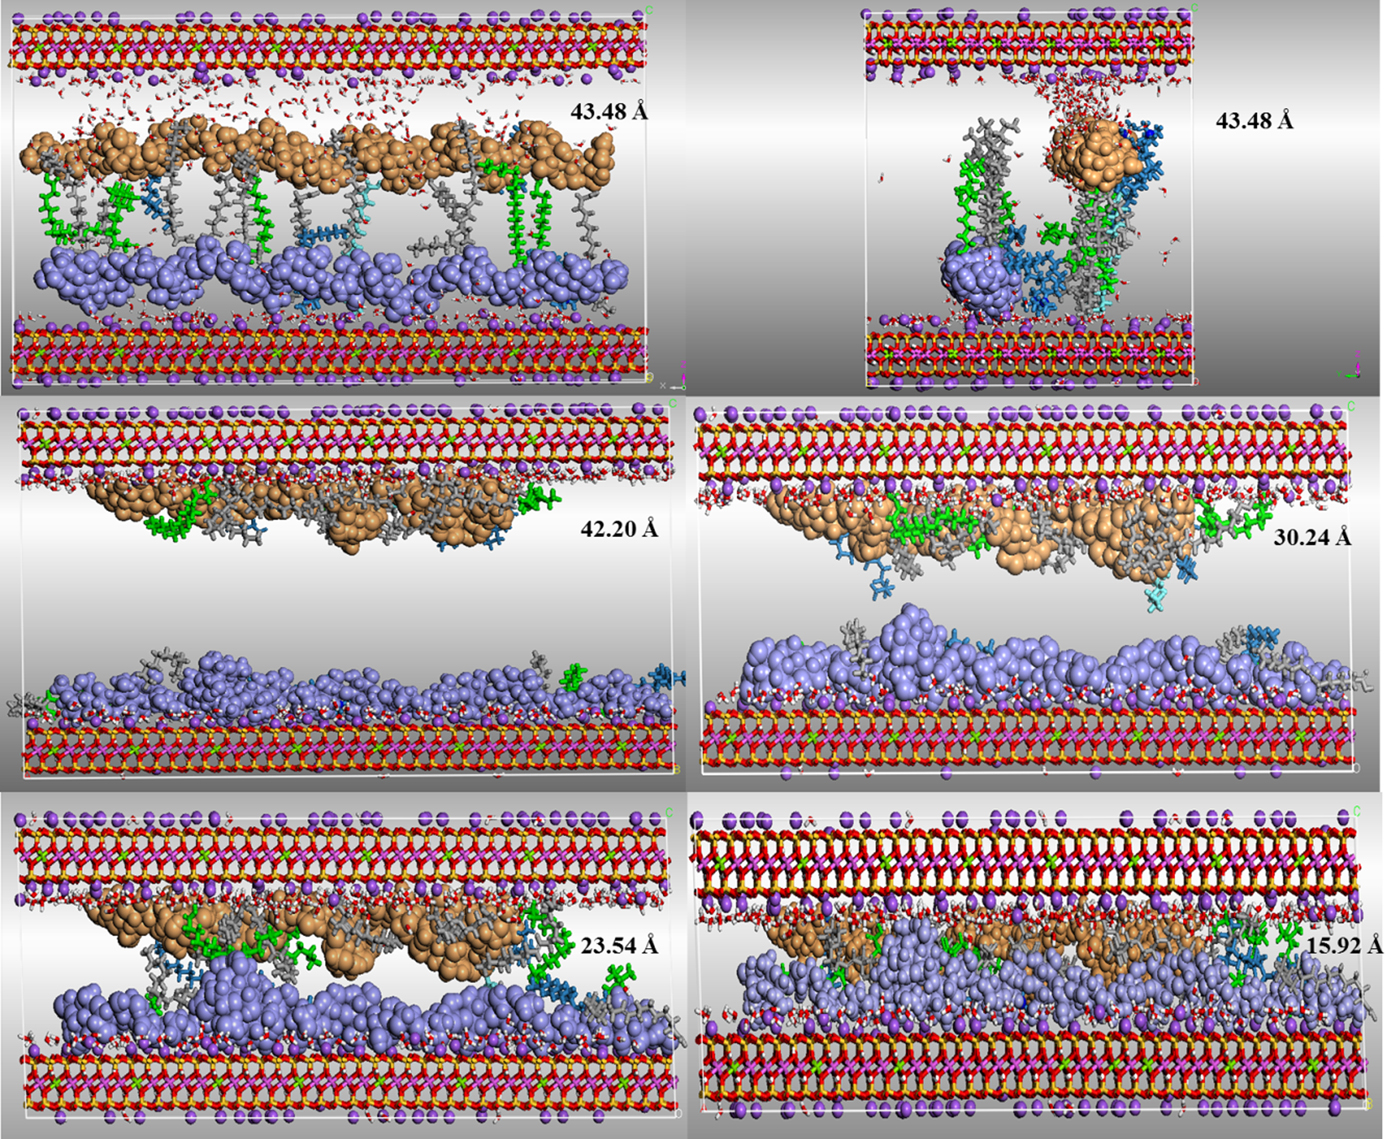
We carried out several MD simulations in sequence. At least one dynamic fluctuation (frame) was extracted after each calculation and had its energy optimized to return the system to equilibrium. Coordinates were then used as input for a subsequent MD simulation. A reference distance between two oxygen atoms was set to control the reduction of the cell. These atoms were located on the internal boundaries between two layers of MMT and the initial distance was 43.89 Å after the first optimization and before first dynamic simulation (Fig. 3).
Sequence of system compression under 1.0 × 10⁻⁴ GPa. The O….O distances of the approximation of the MMT layers are written on the right of the images. The displacements represented vary from the starting position, 43.48 Å, crossing 42.20, 30.24, 23.54, and 15.92 Å. Calculations were performed in PBC. Color code: amylose chains are colored in orange and lilac, the MMT atoms are O = red; Si = yellow; Al3+ = pink; Mg2+ = green; Na+ = violet.
The dynamic phase is essential because it allows the adjustment of the structures and a spatial rearrangement of all chemical species involved. However, it is important to note that it is not the time defined to the dynamic trajectory calculation that leads significant reductions in the cell dimensions when the pressure is set to 1.0 × 10⁻⁴ GPa. These reductions happen essentially during each energy optimization step. Here, the cell is reduced to about 0.37 Å (from d O…O = 43.89 to 43.52 Å). Then, after each sequence of dynamic simulation, followed by energy optimization, the average size reduction is around 4 Å. In seven steps, the cell reduced from 43.52–15.42 Å. The c-axis is strongly reduced (≈33%), bringing the MMT surfaces closer and compressing the other chemical species that fill the gallery (a = 103.163 Å, b = 53.655 Å, c = 40.282 Å, α = 85.731°, β = 91.958°, γ = 89.910°).
Due to the slow nature of the calculation under 1.0 × 10⁻⁴ GPa, the same starting system was submitted to a dynamic trajectory under 1.0 GPa. The final results are similar to those under 1.0 × 10⁻⁴ GPa. Cell dimensions are also similar: d O..O = 14.68 Å; a = 102.93 Å, b = 53.52 Å, c = 30.59 Å, α = 82.10°, β = 93.28°, γ = 89.89°, which shows that our previous results are valid. However, due to the extremely fast nature of the dynamic trajectory under this pressure, the results were not taken into consideration, since we wish to follow the steps of the compression procedure under more details.
Figure 3 shows a sequence of the transformation described by the five stages among seven (Fig. 3). The oxygen atoms used to define the O…O distance are located on inner surfaces of each MMT layer. The referential distance d O…O shrank from 43.48 to 15.92 Å. After system evolution, convergence parameters reached 5.7 × 10⁻⁴ kcal/mol/Å, to the “rms” force, and 2.8 × 10⁻⁵ GPa, for “rms” stress.
The water molecules were quickly repositioned between the MMT layers and the amylose chains, inducing the formation of a dense network of hydrogen bonds. There was no water adsorption into the pores of MMT.[Reference Wungu, Agusta, Saputro, Dipojono and Kasai26, Reference Ruiz-Hitzky, Aranda, Darder, Brunet, Colón and Clearfield27] Through the dynamic process, due to their arbitrary initial positions near the amylose oligomers, some fatty acid molecules transitioned between the chains interacting with the upper and lower MMT layers due to electrostatic interactions with the phyllosilicate. We considered the system with the distance between the two layers of 23.54 Å to proceed with the study because it is similar to the x-rays diffraction value of 23.30 Å.[Reference Schlemmer, Angélica and Sales3, Reference Schlemmer14]
The experimental systems[Reference Schlemmer, Angélica and Sales3, Reference Schlemmer14] were composed of starch, “Cerrado” oils, and MMT-O in the solid state. Due to the substitution of starch to amylose chains, and the increased flexibility of the internal components in the simulated liquid state, it is reasonable that the MMT layers compressed the gallery more than in the solid state, reaching the value of 15.42 Å, after gradient convergence.
Density profile for the MMT-O “gallery” system
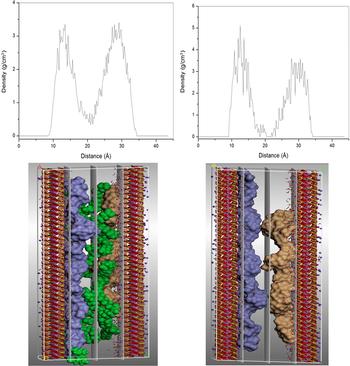
We calculated the density profile of the immersed system to evaluate the arrangement of the organic material within the MMT gallery (Fig. 4). The obtained profiles capture the overall arrangement of the organic components and the arrangement of amylose's oligomers. Both profiles were calculated, and in Fig. 4, three planes normal to them serve as a reference for clarity sake (one plane, Z-axis). On the left, there is a high concentration of amylose and fatty acids near the MMT layers (higher peaks from 11 to 16 and 25 to 33 Å); on the right, only the amylose oligomers are shown in the interlayer space, due to the exclusion of the fatty acid atoms from the profile calculation, resulting in a central region with less atom concentration. The average density for amylose chains is 3.25 g/cm3; the profile becomes very low between 16 and 23 Å (shorter peaks).
(Top) Density profile of organic species in the “gallery” system (left); only amylose oligomers (right). (Bottom) The Miller planes to 10, 20, and 30 Å calculated from the index (0 0 10). Planes are colored in light gray. Color code: amylose chains are colored in orange and lilac; organic species in green; the MMT atoms are O = red; Si = yellow; Al3+ = pink; Mg2+ = green; Na+ = violet.

The higher peaks (higher density) indicate proximity to MMT layers. Their heights are indicative of strong attractive interactions between the oligomeric chains and the surface of the clay.[Reference Scocchi, Posocco, Fermeglia and Pricl23, Reference Zhou, Lu, Liu, Zhang, He, Zhu and Yuan25, Reference Ruiz-Hitzky, Aranda, Darder, Brunet, Colón and Clearfield27–Reference Smiatek and Schmid30] The subsequent peaks are shorter, as the MMT surface is shielded by interactions with the oligomer.[Reference Scocchi, Posocco, Fermeglia and Pricl23, Reference Ruiz-Hitzky, Aranda, Darder, Brunet, Colón and Clearfield27–Reference Smiatek and Schmid30] Those concentration profiles are similar to that obtained by Toth et al.[Reference Toth, Coslanich, Ferrone, Fermeglia, Pricl, Miertus and Chiellini31] who attributed the irregular-shaped profiles to the restrictions on the movement to which the polymer chains are subjected.
Conclusions
We analyzed different models of MMT with oligosaccharides, fatty acids, and cetrimonium and observed that their behavior is fundamentally the same. All fatty acids were attracted to the amylose chains through their polar heads, according to their electrostatic interactions and spatial orientation. The non-polar tails of fatty acids did not move in the free space but adhere on the amylose surface and this could be interpreted as a plasticization effect happening. Cetrimonium ions were shown to rearrange their positions between sodium ions because their quaternary N atoms were attracted by the surface of MMT. The phyllosilicate and the cetrimonium ions contribute to the flexibility of the non-polar portions of the fatty acids, as they electrostatically bind to the surface, their hexadecyl chain resumed its extended position, stretching up on MMT, making little difference in the system's overall behavior. The amylose–fatty acids–MMT systems were stabilized due to the extraordinary power of attraction of the clay mineral. Either extended or coiled conformations of the polysaccharide were quickly attracted to its vicinity, stabilizing the chains. It was also noted that, if there was a presence of water molecules between the organic and inorganic layers, a network of hydrogen bonds would be formed agreeing with the experimental data.[Reference Schlemmer14] The systems required the addition of water to stabilize. NPT simulations showed consistency with the experimental x-ray diffraction results and the arrangement result predicted by Toth et al.[Reference Toth, Coslanich, Ferrone, Fermeglia, Pricl, Miertus and Chiellini31]
The simulation results by MM and MD will serve as a stepping stone for the calculation of input parameters for mesoscale simulations or parameterize data to be inserted in mesoscale simulations. These efforts might lead to proposing new models for the design of new PCNs of natural biopolymers, with the inclusion of essential oils derived from Brazilian flora.
Supplementary material
The supplementary material for this article can be found at https://doi.org/10.1557/mrc.2018.41
Acknowledgments
Felipe Silva thanks the Brazilian agencies CNPq, for the doctoral fellowship in Brazil, and CAPES, for the year-long doctoral fellowship in France. He also thanks the Laboratoire Réactions et Génie des Procédés (LRGP/ENSAIA/University of Lorraine) for the structural and academic support received during this period.