
1. Introduction
In this paper, we analytically and experimentally study the flow that arises in a waterbody due to the presence of a solute source on its surface. The flow arises because the solute source modifies the local surface solute concentration, and hence the surface tension of water, giving rise to a surface tension gradient which drives the flow (Levich & Krylov Reference Levich and Krylov1969). The surface tension gradient driven flows, which can also arise due to the surfactant concentration or temperature gradients, are important in a range of problems. They can cause enhanced mixing, e.g. raindrops falling on ocean surface, and are important in many industrial processes (Grotberg Reference Grotberg1994; Dukhin, Kretzschmar & Miller Reference Dukhin, Kretzschmar and Miller1995; Ivanov & Kralchevsky Reference Ivanov and Kralchevsky1997; Eastoe & Dalton Reference Eastoe and Dalton2000; Eisner, Eisner & Siegler Reference Eisner, Eisner and Siegler2005; Barnes Reference Barnes2008), e.g. in stabilizing emulsions and foams (Carpenter & Homsy Reference Carpenter and Homsy1990; Craster & Matar Reference Craster and Matar2009). These flows are also important in a range of biological processes such as in pulmonary flow, where strain gradients induce surfactant concentration gradients (Wood & Jobe Reference Wood and Jobe1993), and some living organisms employ this mechanism for propulsion (Harshey Reference Harshey2003; Bush & Hu Reference Bush and Hu2006; Cantat et al. Reference Cantat, Cohen-Addad, Elias, Graner, Höhler, Pitois, Rouyer, Saint-Jalmes and Flatman2013).
Although our work's focus is on solutocapillary flow, the past studies conducted on the steady and transient surface flows caused by other surface tension altering sources present on a water surface are also relevant to this study (Jensen Reference Jensen1995; Mizev et al. Reference Mizev, Trofimenko, Schwabe and Viviani2013; Roché et al. Reference Roché, Li, Griffiths, Le Roux, Cantat, Saint-Jalmes and Stone2014; Le Roux et al. Reference Le Roux, Roché, Cantat and Saint-Jalmes2016; Mandre Reference Mandre2017). These studies note that, on a clean water surface, there is an axisymmetric radially outward flow on the surface, which extends for a few centimetres from the source and then changes direction into the bulk as the surface flow becomes unstable due to periodic azimuthal perturbations. Beyond this radial distance, the surface flow has a multi-vortex structure.
The studies show that the distance for which the axisymmetric outward flow persists increases with increasing source strength. The flow also depends on the solubility of the surfactant used (Bandi et al. Reference Bandi, Akella, Singh, Singh and Mandre2017) and parameters such as the depth of the waterbody (Jensen Reference Jensen1995). Roché et al. (Reference Roché, Li, Griffiths, Le Roux, Cantat, Saint-Jalmes and Stone2014) found the scaling laws for the radial distance over which the Marangoni flow persists (also see Suciu, Smigelschi & Ruckenstein Reference Suciu, Smigelschi and Ruckenstein1967; Napolitano Reference Napolitano1979). The water used in their study was Millipore water of high purity. Their data show that the radius depends on the critical micelle concentration of the surfactant which was used to devise a method for measuring the critical micelle concentration of a surfactant from the strength of the flow induced on the water surface.
The strength of induced flow is significantly reduced when there are surface-active contaminants that reduce the surface tension of water present in the waterbody (Mizev Reference Mizev2005). For example, it has been shown that, soon after the water is poured into a container, or the water already in a container is mixed so that a fresh surface forms, the water surface remains relatively clean for a few minutes, especially when the concentration of surface-active contaminants in the waterbody is small. Under these conditions, the radial distance over which the induced flow on the surface persists decreases with time as surface-active contaminants continue to accumulate on the surface. After a few minutes, the flow becomes unstable closer to the source needle, making the radius of the axisymmetric outward flow region smaller (Mizev Reference Mizev2005; Kovalchuk & Vollhardt Reference Kovalchuk and Vollhardt2006). These studies also find that the radius over which the flow induced by a solute source persists is larger than that by a thermal source, which the authors noted was due to the fact that it took them approximately two times longer to set up a thermal experiment than one involving a surfactant. As discussed below, another plausible reason for this could be that the flow induced by a solute or surfactant is stronger because it takes the solute or the surfactant longer to diffuse away from the surface than heat.
The steady-state analytic solution of the thermocapillary problem was obtained by Bratukhin & Maurin (Reference Bratukhin and Maurin1967). Specifically, they showed that, for a positive heat source, the flow on the surface is away from the source, below the source, the liquid rises towards the surface, and for a negative source, the opposite is true. Bratukhin & Maurin (Reference Bratukhin and Maurin1982) conducted a stability analysis of the axisymmetric flow, which showed that it was unstable for very small azimuthal perturbations leading to the formation of azimuthal vortices. This is consistent with a similar analysis done by Pshenichnikov & Iatsenko (Reference Pshenichnikov and Yatsenko1974) for surfactant-induced Marangoni flows. Also, the stability of the Marangoni flow depends strongly on the concentration of the surfactant, as the presence of a trace amount causes instabilities and ends the axisymmetric radial flow (Bratukhin & Maurin Reference Bratukhin and Maurin1982; Mizev Reference Mizev2005; Kovalchuk & Vollhardt Reference Kovalchuk and Vollhardt2006; Mizev et al. Reference Mizev, Trofimenko, Schwabe and Viviani2013).
Bandi et al. (Reference Bandi, Akella, Singh, Singh and Mandre2017) have used a laser doppler velocimetry method to measure the velocity profiles near the water surface as a function of the distance from the source and as a function of the depth within the boundary layer for both water soluble and insoluble surfactants. Their data show that, for both cases, the dependence of surface velocity on the distance can be described using a power-law model but with different decay coefficients. For an insoluble surfactant, the radially outward surface velocity component decreases as  $r^{-{3}/{5}}$, whereas for soluble surfactants, it decreases as
 $r^{-1}$. In fact, when the Marangoni number is large enough so that a boundary layer develops near the surface, this feature of the flow can be used to distinguish between these two types of surfactant behaviours. Mandre (Reference Mandre2017) used numerical simulation results for soluble and insoluble surfactants to develop two distinct boundary layer theories to model the flows near the surface in terms of self-similar boundary layer profiles in the depth-wise direction.
This work builds upon the past experimental studies which have focused on the flow at or near the surface, and the flow induced in the waterbody has been described only qualitatively by noting that the water below the surface circulates back towards the source. Our particle image velocimetry (PIV) data show that the actual flow is far more complex than the analytic solution because of the influence of other factors that are not accounted for in the analytic model. The flow induced in experiments can be divided into three main regions. The flow in region I is influenced by the fact that the source size is finite, the velocity on the surface of the source needle is zero and there is a flux of water from the source. There is an approximate agreement in the intermediate region, which is referred to as region II. The flow in this region has spherical axisymmetry, as for the analytic solution, and its strength varies inversely with the distance from the source. The flow profile in region III and beyond does not match with the analytic solution. On the surface, its direction changes into the waterbody at the end of this region, which leads to the transport of gases adsorbed at and near the liquid surface into the waterbody.
To compare the experimental and analytic results, we have identified certain flow features, so a visual comparison can be made with the experimental data in addition to a quantitative comparison. The induced flow is analogous to that for a doublet (source–sink pair), with well-defined in- and outflow regions. For a negative solute source, according to the analytic solution, the inflow occurs within a conical region, and the outflow occurs outside the conical region. The half-cone angle increases with increasing flow rate, and so the outflow is restricted to a thin region near the water surface which, as noted above, can be described using the boundary layer approach. These features of the analytic solution are compared with the experimental results in region II obtained using the PIV and planar laser-induced fluorescence (PLIF) techniques.
In the next section, we state the governing equations and discuss the analytic solution. This is followed by the comparison of the analytic and experimental results and conclusions.
2. Governing equations and boundary conditions
We next state the equations governing the steady-state fluid velocity and concentration fields that result when a point solute source is present on the air–fluid interface of an incompressible fluid occupying the lower half-space  ${{\varOmega}} :=\{(x,y,z)\in \mathcal{R}^3: x,y,z \in \mathcal{R}, 0 \le z\}$, where
 $\mathcal{R}$ is the real numbers. We will use a spherical coordinate system
 $(r,\theta,\phi)$, where
 $r := \sqrt{x^2+y^2+z^2}$ and
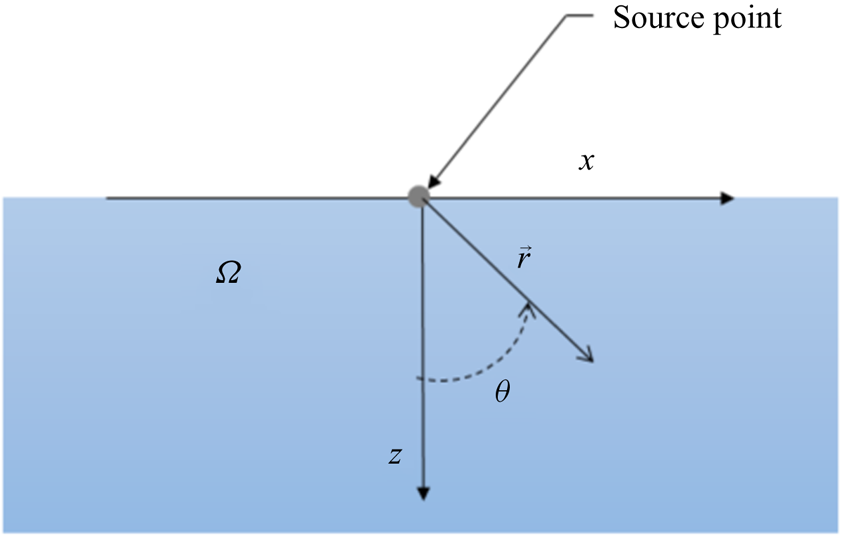
 $\phi$ is the azimuthal angle of rotation about the z-axis, to describe the flow with the source at its origin, as shown in figure 1.
A source at the origin of a spherical coordinate system used to model the flow.

For a negative solute source, achieved by adding pure water into saltwater in our experiments, the solute concentration decreases near the source, causing a positive solute concentration gradient away from the source (see (3.2)). For a positive solute source, on the other hand, there is a negative concentration gradient on the surface. The concentration gradient drives a solutocapillary flow on the surface away or toward the source. However, although there is a flow on the surface, there is no net liquid flow from (or into) the source itself.
In our experiments, the water flow rate from the source is not zero, as fresh or saltwater is injected at the surface using a syringe pump to modify the local salt concentration, which is not the case for the theoretical model equations (2.1)–(2.6). When freshwater is injected at the surface of a saltwater body, the salt concentration near the source decreases, and when saltwater is injected in a freshwater body, the salt concentration increases. The experimental data for the release of saltwater in clean water are not shown, as the flow generated for this case is much weaker. The rate of inflow is held constant, and so the effective solute inflow is also constant, as is the case for the analytic solution. Also, as discussed later, the velocity due to the influx of water is small compared with that due to the solutocapillary flow. Therefore, although the experimental and analytic results deviate in the vicinity of the source, a short distance away from the source in region II, there is an approximate agreement between them.
The governing mass, momentum and solute concentration equations for the fluid system are
 $$\begin{gather} \boldsymbol{\nabla}\boldsymbol{\cdot}\boldsymbol{u} = 0, \end{gather}$$
 $$\begin{gather}\rho\left(\frac{\partial \boldsymbol{u}}{\partial t} +\boldsymbol{u}\boldsymbol{\cdot}\boldsymbol{\nabla}\boldsymbol{u} \right) ={-}\boldsymbol{\nabla} p +\mu{\nabla}^2\boldsymbol{u} -\rho\boldsymbol{g}, \end{gather}$$
 $$\begin{gather}\frac{\partial c}{\partial t}+ \boldsymbol{u}\boldsymbol{\cdot}\boldsymbol{\nabla} c= D \nabla^2 c . \end{gather}$$
Here,  $\rho$ is the fluid density,
 $\boldsymbol {u}$ is the velocity,
 $p$ is the pressure,
 $\mu$ is the dynamic viscosity,
 $\boldsymbol{g}$ is the acceleration due to gravity,
 $D$ is the solute diffusion coefficient,
 $c=(c_a-c_\infty )$ is the relative concentration,
 $c_a$ is the actual solute concentration and
 $c_\infty$ is the solute concentration far away from the source which is assumed to be constant. Thus, far away from the source,
 $c=0$.
We will consider a steady-state solution of the equations. There is an obvious rotational symmetry about the  $z$-axis, which means that in terms of spherical coordinates, the variables are independent of the azimuthal angle. Hence,
 $\boldsymbol {u}$ and
 $c$ are functions of
 $(r,\theta )$ with
 \begin{equation} \boldsymbol{u} = u_r(r,\theta)\boldsymbol{e}_{\boldsymbol{r}}+u_\theta(r,\theta)\boldsymbol{e}_{\boldsymbol{\theta}}. \end{equation}
The interface is assumed to be flat and characterized by  $z=0$ or
 $\theta = {\rm \pi}/2$. We will also assume that the fluid is incompressible with a constant viscosity, and the gravitational force can be neglected. The density of water decreases with decreasing the salt concentration. However, to keep our analysis simple, we will assume that the water density is constant. The surface tension,
 $\gamma = \gamma (c)$, of water increases with the salt concentration, and so a change in the local surface salt concentration causes a surface tension gradient which induces a solutocapillary flow in the waterbody. We used experimentally measured equilibrium surface tension data to obtain
 $\gamma = 0.0473\ c_a+72.49$ from which we then obtained
 $\varGamma = {\textrm {d}\gamma }/{\textrm {d}c} = 0.0473$ N m
 $^{-1}$ g
 $_{NaCl}$ l
 $^{-1}$. Except for the source point, the boundary conditions on the interface
 $(z=0)$ are
 \begin{equation} \frac{\mu}{r} \frac{\partial u_r}{\partial \theta}= \frac{\textrm{d}\gamma}{\textrm{d}c}\frac{\partial c}{\partial r}= \varGamma\frac{\partial c}{\partial r}, \quad u_{\theta}=0, \quad \frac{\partial c}{\partial \theta}=0, \end{equation}
and
 \begin{equation} \boldsymbol{u},c \rightarrow 0 \quad \textrm{as} \ r \rightarrow \infty. \end{equation}
The velocity and solute concentration in the domain are determined by the solution of the governing equations (2.1)–(2.6). The problem is posed such that the mass flow rate of solute  $Q_c$ at the source
 $(r=0)$ is specified, but the solute concentration itself is not specified. Since the solute flow rate is finite, the solute concentration at the source is singular.
Notice that there are no characteristic length and velocity scales present in this problem. We will therefore characterize the results in terms of the parameters that appear in the analytic solution described in § 2.1. These include Schmidt number  $Sc = \nu /D$ and the solutocapillary Marangoni number
 $Ma = (\varGamma Q_c)/ ({\mu }^2 D)$, where
 $\nu$ is the kinematic viscosity, and
 $Q_c$ is the mass flow rate of solute. Our focus in this paper is on the solutocapillary flow induced on the surface of saltwater and so unless stated otherwise, we will assume that the parameter values correspond to this case. The diffusivity of salt (NaCl) in water
 $D= 1.6\times 10^{-9}$ m
 $^{2}$ s
 $^{-1}$,
 $\varGamma = 0.0473\times 10^{-3}$ N g
 $_{NaCl}$ m
 $^{-1}$ l
 $^{-1}$,
 $\mu =8.9\times 10^{-4}$ Pa s,
 $\nu = 8.9\times 10^{-7}$ m
 $^{2}$ s
 $^{-1}$ and so
 $Sc$ is equal to
 $447$ and
 $Ma=3.0\times 10^{14} Q_c$.
2.1. Analytic solution
The governing equations (2.1)–(2.3) are mathematically identical to that for a point heat source present at an air–water interface (see Bratukhin & Maurin Reference Bratukhin and Maurin1967), and so by using a similar approach, the velocity and concentration fields in spherical coordinates for (2.1)–(2.6) can be written as
 $$\begin{gather} u_r(r,\theta)= \frac{\varTheta_{r}}{r} = \frac{K\nu}{rR^2} \left\{\cos(\theta) RP + \sin^2{\left(\frac{\theta}{2} \right) [\alpha_1\xi^{2\alpha_2-1}+ \alpha_2\xi^{2\alpha_1-1}+K]}\right\}, \end{gather}$$
 $$\begin{gather}u_\theta (r,\theta) = \frac{\varTheta_\theta}{r} ={-} \frac{K\nu\sin(\theta)P}{2rR}, \end{gather}$$
 $$\begin{gather}c (r,\theta)= \frac{\varTheta_c}{r} ={-}\frac{K\nu\mu(1+K)^{Sc}}{\varGamma r R^{2Sc}}. \end{gather}$$
The dimensionless constant  $K$ is determined by the solute flux condition
 \begin{align} & K(1+K)^{Sc}
\int_0^{{\rm \pi}/{2}}\left\{1+ \frac{K
Sc}{R^2}\left[\left(\sin^2\left(\frac{\theta}{2}\right)+\cos\theta\right)T(\theta)\right.\right.\nonumber\\
&\qquad \left.\left.+ \,
K\sin^2\left(\frac{\theta}{2}\right)-\cos\theta\right]\right\}
\frac{\sin\theta}{R^{2Sc}}\,\textrm{d}\theta \nonumber\\
&\quad = \frac{-\varGamma Q_c}{2{\rm \pi} D {\mu}^2}
={-}\frac{Ma}{2{\rm \pi}}. \end{align}
Here,  $\alpha _1:=\frac {1}{2}[1+\sqrt {1+K}], \, \alpha _2:=\frac {1}{2}[1-\sqrt {1+K}]$,
 $\xi = 1+\cos \theta$,
 $R=R(\theta )= \alpha _1\xi ^{\alpha _2}-\alpha _2\xi ^{\alpha _1}$,
 $P=P(\theta )=\xi ^{\alpha _2-1}-\xi ^{\alpha _1-1}$,
 $T(\theta )=\alpha _1\xi ^{2\alpha _2-1}-\alpha _2\xi ^{2\alpha _1-1}$.
It is worth noting that  $K$ depends only on
 $Sc$ and
 $Ma$, but the velocity components and the solute concentration depend on
 $K$,
 $\nu$,
 $\mu$ and
 $\varGamma$. Therefore, to uniquely specify the solution, in addition to
 $Sc$ and
 $Ma$, which determine
 $K$, the values of
 $\nu$,
 $\mu$ and
 $\varGamma$ must also be given as they appear independently in (2.7)–(2.9). In this paper, unless otherwise noted, we will assume that
 $\nu$,
 $\mu$ and
 $\varGamma$ correspond to the case of water with dissolved salt (NaCl). Thus, as noted earlier, the value of
 $Sc=447$ is fixed for this case, and
 $Ma=3.0\times 10^{14} Q_c$. The value of
 $Ma$ is varied by changing
 $Q_c$ while holding other parameters fixed.
An approximate value of  $K$, which is appropriate when the solute in- or outflow rate and Schmidt number are small, is
 $K=(-\varGamma Q_c)/(2{\rm \pi} {\mu }^2 D) = -Ma/(2{\rm \pi} )$. For the case when the solute flow rate and Schmidt number are large, an expression given in Mandre (Reference Mandre2017) can be used. However, when the flow rate and Schmidt number are not small or very large,
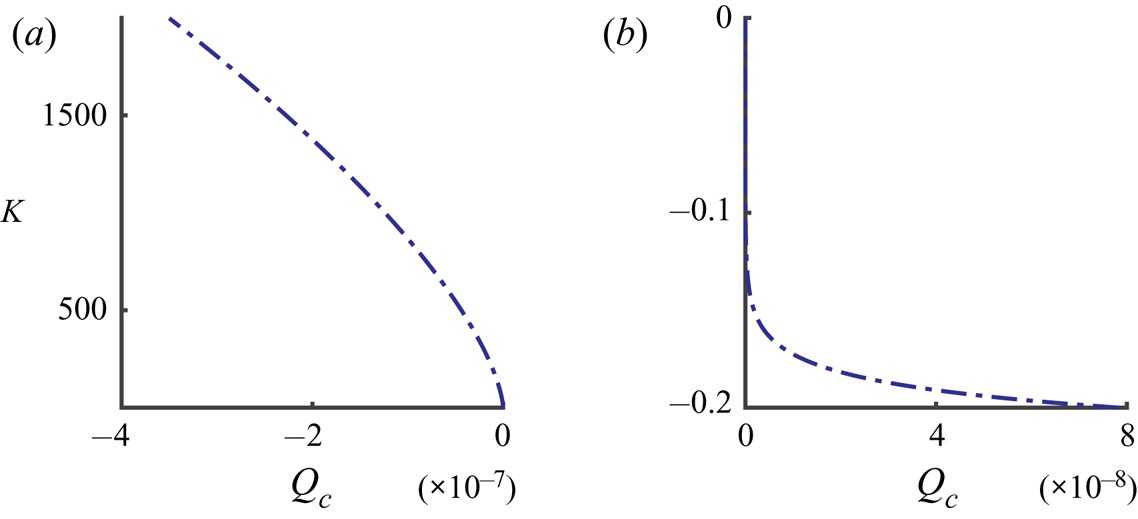
 $K$ has to be obtained numerically by solving equation (2.10). Figure 2 shows the numerically computed values of
 $K$ for the positive and negative values of
 $Q_c$. Notice that the magnitude of
 $K$ for a positive solute source is about three orders of magnitude smaller than for a negative source of the same strength and so the flow induced in this case is weaker.
Value of  $K$ as a function of
 $Q_c$ (kg s
 $^{-1}$) for
 $Sc = 447$ (common salt in water); (a)
 $Q_c$ is negative, (b)
 $Q_c$ is positive.

The computed value of  $K$ can then be substituted in (2.7)–(2.9) to obtain the velocity and concentration fields. The analytic solution has the radial dependence of
 $1/r$, and so its complexity is primarily in the
 $\theta$ dependence of
 $\varTheta _r$,
 $\varTheta _\theta$ and
 $\varTheta _c$ which depend on the parameter value (see (2.7)–(2.9)). A detailed discussion of the analytic solution is included in the Appendix.
The velocity and concentration fields on the surface, which take relatively simpler form, are given by:  $c(r,{\rm \pi} /2)= -(K\nu \mu )/(\varGamma r)$,
 $u_r(r,{\rm \pi} /2)= K\nu /2r$, and
 $u_\theta (r,{\rm \pi} /2)=0$. The surface tension gradient on the surface is
 $\textrm {d}\gamma /\textrm {d}r=(\textrm {d}\gamma /\textrm {d}c)\, (\textrm {d}c/\textrm {d}r) =\varGamma \,\textrm {d}c/\textrm {d}r= K\nu \mu /r^2$. Notice that, once the value of
 $K$ is known for the imposed
 $Q_c$, the velocity, concentration and surface tension gradient on the surface can be easily computed.
2.2. Velocity doublet induced by a solute source and its dependence on  $Sc$ and $Ma$


As noted above, according to the boundary conditions prescribed at the source, the solute can enter or leave the source, but the inflow rate of liquid at the source is zero. The velocity and concentration fields given by (2.7)–(2.9), satisfy these conditions. However, notice that, although the net liquid inflow rate at the solute source is zero,  $u_r$ and
 $u_\theta$ do not approach zero as
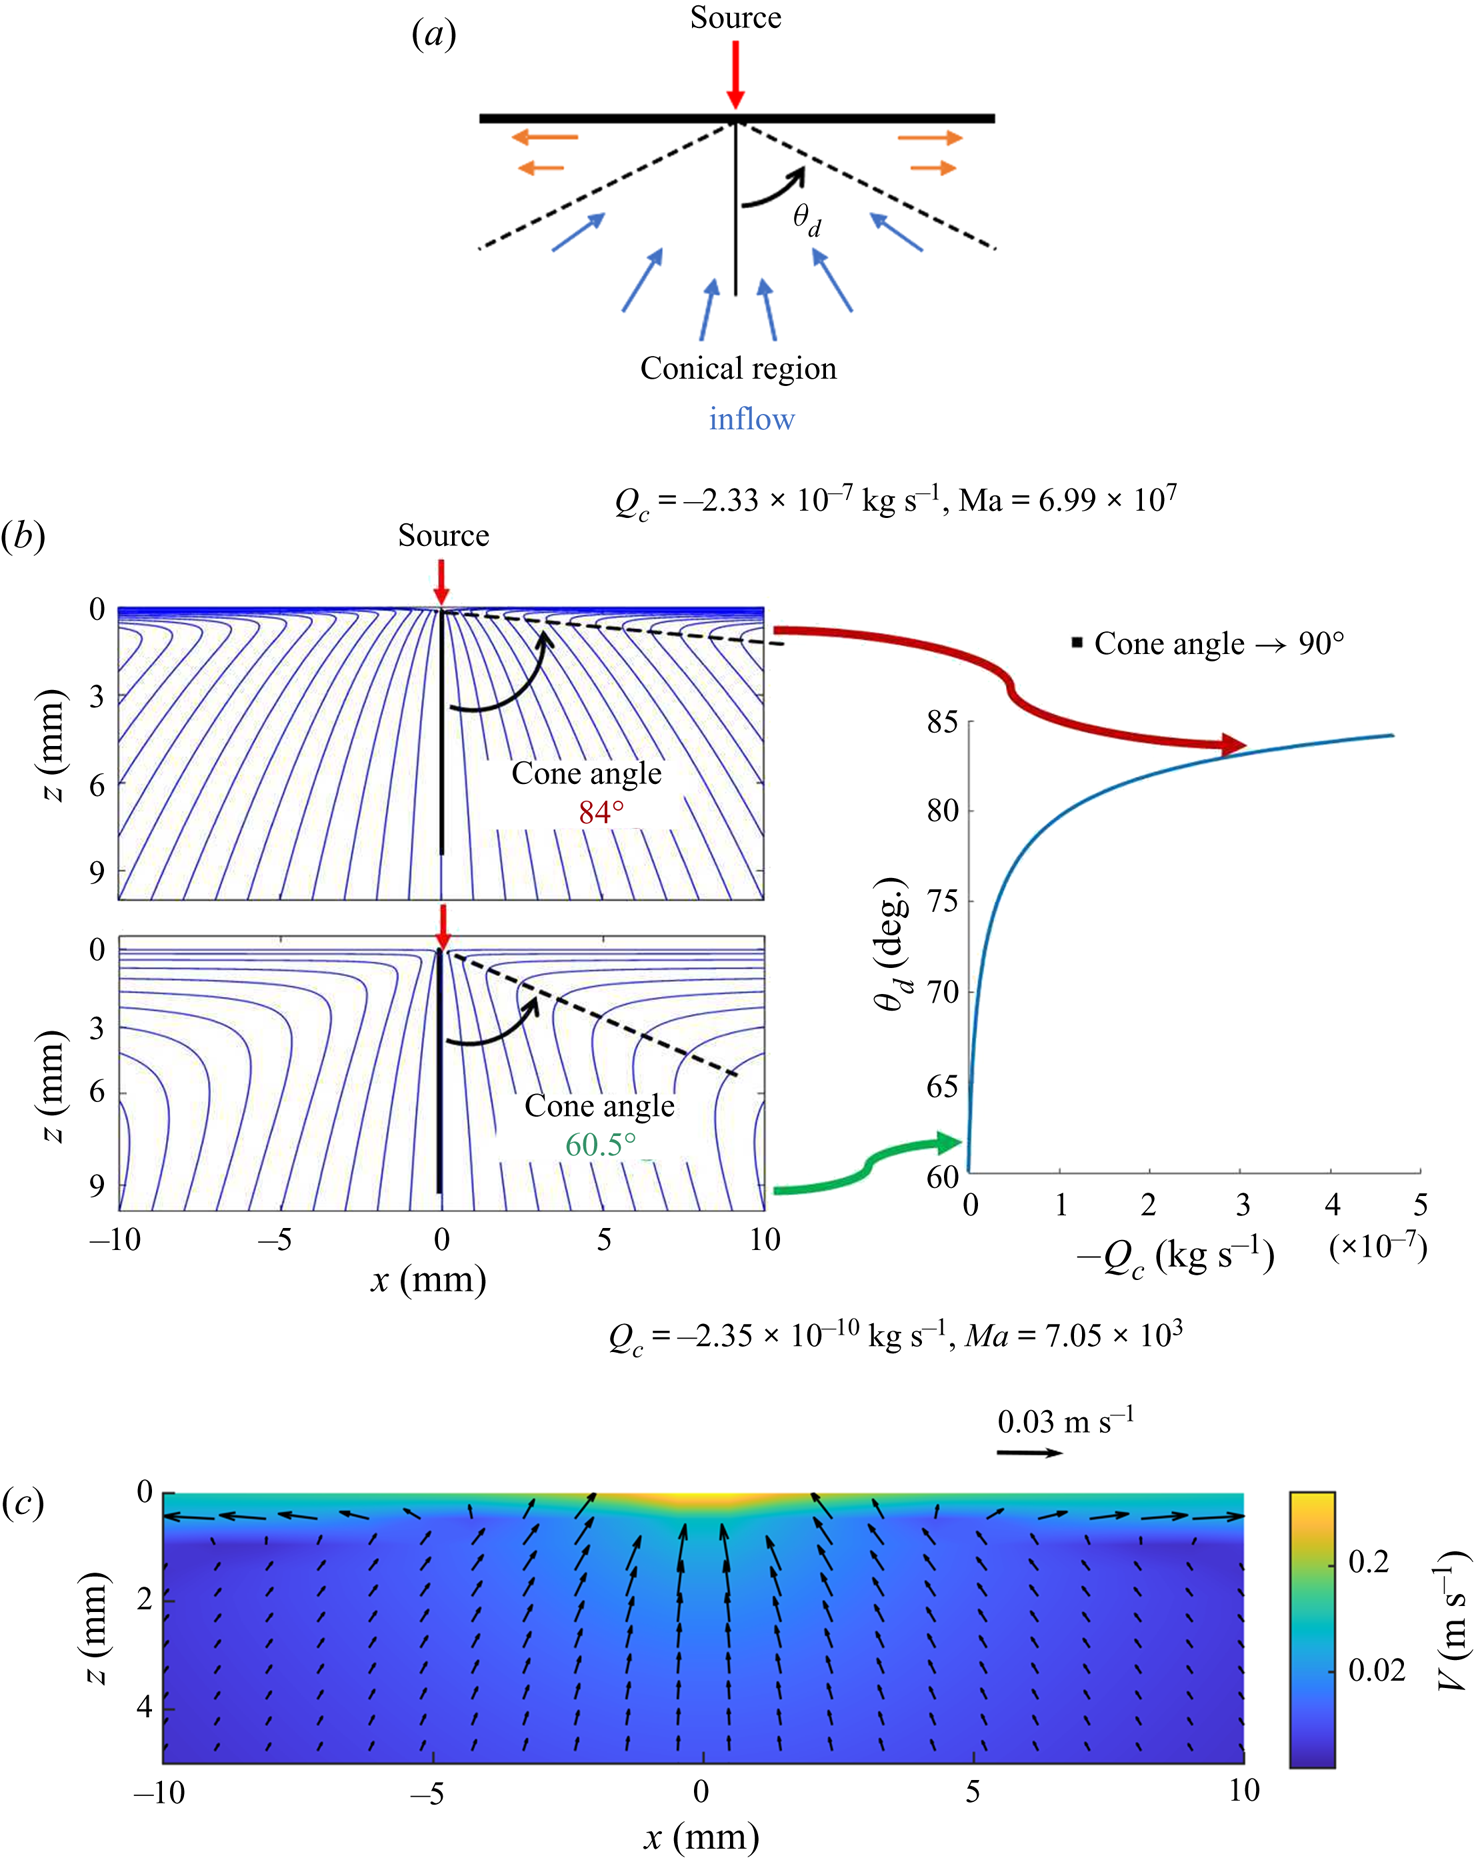
 $r$ approaches zero. Instead, they both approach infinity. The presence of a solute source on a liquid surface thus induces a flow doublet on the surface, which causes flow in the half-volume occupied by the liquid. For a negative solute source, the liquid below the source rises towards the source, and on the surface, it moves radially outward from the source, and both components increase in magnitude with decreasing
 $r$ (see figure 3). The flow behaviour for a positive solute source is qualitatively similar except that the flow direction is reversed. Also notice that, for a negative solute source
 $(Q_c< 0)$,
 $u_r$ is negative in a conical region with its vertex at the solute source and positive outside the conical region (see figure 3c). For a positive solute source, on the other hand,
 $u_r$ is positive in a conical region and negative outside the conical region (figure 18). The velocity magnitude is locally minimal along the cone boundary. The cone angle depends on the problem parameters, including the solute flow rate and the solute diffusion coefficient (see figure 3b). Let us denote the cone half-angle by
 $\theta _d$. For a negative solute source,
 $\theta _d$ approaches
 $60^{\circ }$ for small
 $Q_c$, and
 $\theta _d$ increases with increasing
 $|Q_c|$ to approach a value close to
 $90^{\circ }$ (see figure 3b). The outflow in the latter case is therefore restricted to a thin region near the liquid surface. For a positive solute source
 $(Q_c>0)$, for small
 $Q_c$,
 $\theta _d$ approaches
 $60^{\circ }$, and for larger
 $|Q_c|$,
 $\theta _d$ decreases with increasing flow rate to approach approximately
 $59.5^{\circ }$. The maximum change in the cone half-angle with the solute flow rate for the latter case is only approximately
 $0.5^{\circ }$, and so the streamlines are relatively rigid. For a negative solute source, on the other hand, the maximum change in the cone half-angle is approximately
 $30^{\circ }$.
(a) Schematic of the velocity doublet induced by a negative solute source. (b) The streamlines for two values of  $Q_c$ and cone half-angle
 $\theta _d$ as a function of
 $Q_c$. The cone half-angle increases with
 $|Q_c|$. (c) Velocity field coloured with velocity magnitude for a negative source with
 $K = 1525.8$,
 $Q_c = -2.33\times 10^{-7}$ kg s
 $^{-1}$ (
 $Ma=6.99\times 10^7$) (see (2.7) and (2.8)). To improve clarity, the arrows near the origin (source) where the velocity is relatively large are not plotted, and the colour bar is in the logarithmic scale.

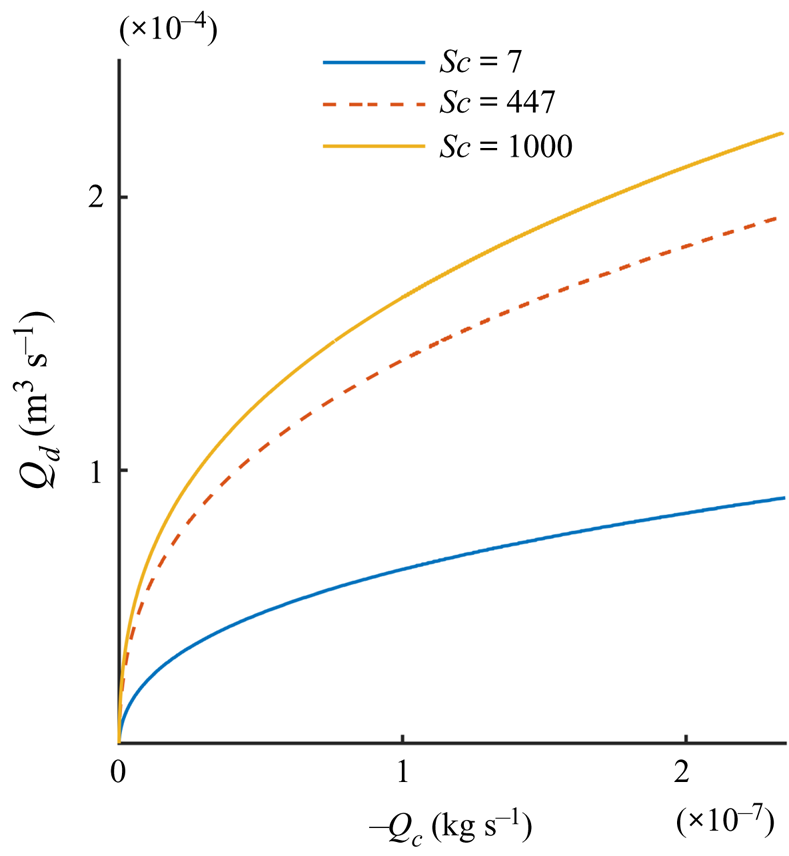
The volume flow rate of liquid in the conical region (towards or away from the solute source) at any distance  $r$ from the solute source is equal to the volume flow rate outside the conical region (away from or towards the solute source), which ensures that the net liquid inflow from the solute source is zero. The volume flow rate in the conical region, however, decreases with decreasing
 $r$. These facts can be used to quantify the doublet strength by computing the flow rate,
 $Q_d$, towards or away from the source at a unit radial distance
 $(r = 1)$ from the source in the conical region (see figure 4). The flow rate quantifies the volume of liquid moved per unit time by the solutocapillary flow, and can be used to compare the doublet strength for different parameter values. Notice that, for a given
 $Q_c$, the flow rate
 $Q_d$ increases with increasing
 $Sc$ (or decreasing
 $D$, as
 $Sc$ was increased by decreasing
 $D$ while holding all other parameters constant). This is due to the fact that when
 $D$ is reduced, the solute remains depleted on the surface for a longer duration of time, and thus the surface tension gradient and the flow it causes are stronger.
The solutocapillary volume flow rate  $Q_d$ for a negative solute source, as a function of
 $Q_c$ for
 $r =1$.

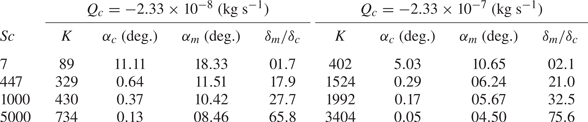
An important question we may ask is how the flow strengths differ for two solutes or surfactants that have slightly different diffusion coefficients and all other parameters are approximately similar. The answer to this depends not only on the difference in diffusion coefficient values, but also on the values of other parameters. The liquid velocity at the surface increases with decreasing solute diffusion coefficient  $D$ or increasing Schmidt number while all other parameter values are held fixed. The data presented in table 1 show that
 $K$ increases when
 $Sc$ is increased, and from (2.7) and (2.8) we know that the velocity increases with increasing
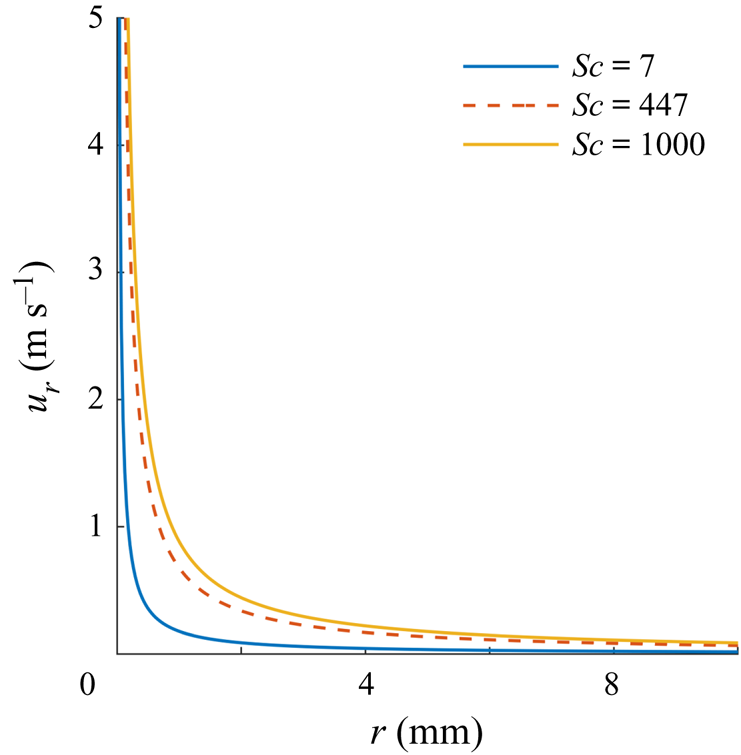
 $K$. Consequently, as figure 5 shows, the velocity on the surface increases with increasing
 $Sc$. For example, if
 $Sc$ is increased from
 $447$ to
 $1000$ (say, by using a solute with smaller diffusion coefficient), the velocity on the surface at a distance of 1 cm from the source increased by a factor of
 $1.3$.
The surface radial velocity as a function of  $r$ is shown for three values of Sc, obtained by reducing
 $D$ while keeping all other parameters fixed for a solute flux
 $Q_c= -2.33\times 10^{-7}$ kg s
 $^{-1}$.

For selected values of  $Q_c$ and
 $Sc$, the values
 $K$,
 $\alpha _m$,
 $\alpha _c$ and
 $\delta _m/\delta _c$ are shown for the analytic solution.

The distance at which the velocity on the surface becomes smaller than a given fixed value also increases with increasing  $Sc$. This suggests that a solute with a larger molecular weight will cause a stronger solutocapillary flow than a solute with a smaller molecular weight when their molar concentrations are the same, as the diffusion coefficient is inversely related to the molecular weight, and all other parameters do not change.
2.3. Solute and momentum boundary layers for $Q_c < 0$

As discussed above, the solute remains depleted (concentration negative) at the surface for a longer distance from the source with increasing  $Sc$, and so the solute concentration magnitude decreases sharply in the direction normal to the liquid surface. To quantify the latter, we may define the solute boundary layer thickness
 $\delta _c$ to be the distance from the surface at which the concentration decreases to one per cent of the concentration at the surface. Let us consider points
 $(r,{\rm \pi} /2)$ and
 $(r/\sin {\theta },\theta )$, on the normal to surface. The solute concentrations at these points are:
 $-K\nu \mu /(\varGamma r)$ and
 $-K\nu \mu (1+K)^{Sc}\sin {\theta }/(\varGamma r R^{2Sc})$, respectively (see (2.9)). Using the condition that the latter concentration is
 $0.01$ times the concentration at the surface, we obtain the following equation:
 \begin{equation} 0.01\left(\frac{K\nu\mu}{\varGamma}\right)= \frac{K\nu\mu{(1+K)}^{Sc}\sin{\theta}}{\varGamma R^{2Sc}}. \end{equation}
The above is a transcendental equation which can be solved for the angle 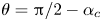 $\theta ={\rm \pi} /2-\alpha _c$, where the solute concentration reduces to
 $1\,\%$ of the concentration on the surface. Here,
 $\alpha _c$ is a small constant angle that depends on
 $Sc$ and
 $Q_c$, and other parameter values appearing in the governing equations. Notice that the angle does not depend on
 $r$. The equation can be solved numerically. In the spherical coordinate system, the equation for the concentration boundary layer is
 $\theta ={\rm \pi} /2-\alpha _c$. The concentration boundary layer thickness at distance
 $r$ then is
 $\delta _c=r\sin {\alpha _c}$.
Similarly, we may define the momentum boundary layer thickness  $\delta _m$ to be the distance
 $z$ at which the magnitude of
 $u$ (the
 $x$-component of the velocity) decreases to one per cent of the magnitude at the surface. The momentum boundary layer equation for this case is given by
 $\theta ={\rm \pi} /2-\alpha _m$, where
 $\alpha _m$ is a small constant angle, and the thickness at distance
 $r$ is
 $\delta _m=r\sin {\alpha _m}$. Both,
 $\delta _m$ and
 $\delta _c$ increase linearly with
 $r$ due to the separable form for the analytic solution. Thus,
 $\delta _m/\delta _c$ is independent of
 $r$.
However, notice that for the analytic solution,  $u$ decreases to zero and then becomes negative (its direction reverses) with increasing
 $z$. This is also the case for our PIV data reported below. Thus, it does not satisfy the requirement of a standard flat plate boundary layer that the shear rate approaches zero at the edge of the boundary layer. The experimental results reported in Bandi et al. (Reference Bandi, Akella, Singh, Singh and Mandre2017) for both water soluble and insoluble surfactants show that
 $u$ approaches zero such that the shear rate is also zero. In Mandre (Reference Mandre2017), a boundary layer approximation was developed to model the tangential velocity profile for soluble and insoluble surfactants near the surface by assuming that the flow has axisymmetric cylindrical symmetry and is self-similar which was observed in the numerical results reported in the paper. It was noted that this boundary layer approximation, which is valid at large
 $Ma$ and away from the source, did not satisfy the Marangoni stress condition at the interface. The velocity profile given by (2.1)–(2.3) being the exact solution satisfies the governing equations including the stress boundary conditions on the surface.
In table 1 the solute and momentum boundary layers are described for typical parameter values. For example, for  $Sc = 447$ and
 $Q_c= -2.33\times 10^{-7}$ kg s
 $^{-1}$ (
 $K = 1525.8$), the solute boundary layer is given by
 $\theta =89.7^{\circ }$ and the momentum boundary layer by
 $\theta =83.75^{\circ }$. So for
 $r=1$ cm,
 $\delta _m=r\sin {6.25} = 1.09$ mm and
 $\delta _c =r\sin {0.3}= 0.05$ mm. (We have chosen
 $r=1$ cm for describing our results because a typical solutocapillary flow persists for only a few centimetres.) Thus,
 $\delta _m/\delta _c\approx 20.97$. Furthermore, notice that the thicknesses of both momentum and solute boundary layers is small, which, as discussed below, makes the measurement of the velocity and solute profiles within the boundary layer challenging.
Also notice that if it is assumed that  $Sc = 7$ and
 $Q_c= -2.33\times {10}^{-7}$ kg s
 $^{-1}$, the solute boundary layer is given by
 $\theta =84.96^{\circ }$ and the momentum boundary layer by
 $\theta =79.44^{\circ }$. Thus, for
 $r=1$ cm,
 $\delta _m=r\sin {10.66} = 1.85$ mm,
 $\delta _c =r\sin (5.04)= 0.88$ mm and
 $\delta _m/\delta _c\approx 2.15$. The thickness of the solute boundary layer in this case is approximately
 $18$ times larger than for the case with
 $Sc = 447$, and the momentum boundary layer is approximately
 $1.7$ times thicker.
For the parameter range considered in table 1,  $\delta _m/\delta _c\approx Sc^{0.55}$, while all other parameters are held fixed. The ratio also varies with
 $Q_c$ for a fixed
 $Sc$. The exponent varies with
 $Sc$ and its limiting value for large
 $Sc$ is 0.5 (see Mandre Reference Mandre2017). The
 $Sc^{0.55}$ dependence is different from that for a flat plate boundary layer where the ratio of the momentum and solute boundary layer thicknesses varies as
 $Sc^{1/3}$.
The above examples show that when the Schmidt number is increased by decreasing  $D$ while holding all other parameters fixed, both
 $\delta _c$ and
 $\delta _m$ decrease and, as a result, the surface flow persists for a longer distance. This is a consequence of the fact that solute is not a passive quantity in this problem. In fact, its concentration gradient at the surface gives rise to the force that drives the flow, and so when
 $D$ is reduced, the flow becomes stronger and persists longer because the solute gradient on the surface is maintained for a longer time and distance.
The above case is interesting also because the Schmidt number, in this case, is comparable to the Prandtl number  $(Pr=\nu /\kappa )$ for the thermocapillary flows, where
 $\nu$ is the kinematic viscosity and
 $\kappa$ is the thermal diffusivity. For water
 $Pr\approx 7$ (which is approximately 64 times smaller than the solute Schmidt number). We remind the reader that the thermocapillary flow induced by a heat source is governed by mathematically similar equations and the analytic solution has a similar form, except that the Prandtl number, which is analogous to the Schmidt number, is
 $\approx$7. Thus, when all other parameters are the same, the solutocapillary flow is expected to remain strong over a longer distance than the corresponding thermocapillary flow as the solute concentration gradient would persist for a longer distance. Also, as discussed below, for the thermocapillary case, the cone half-angle for the typical parameter values is smaller, and so the inflow towards the source is at a steeper angle (i.e.
 $\theta _d$ is closer to 60
 $^\circ$).
3. Experimental set-up and results
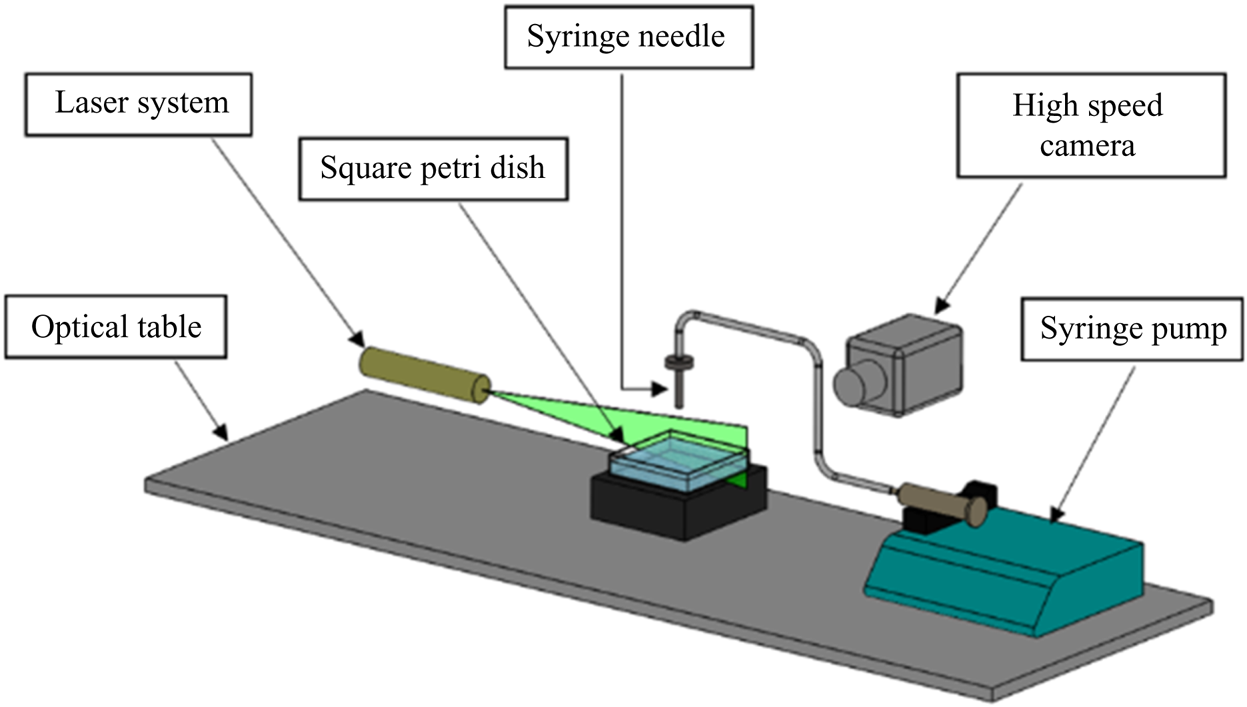
The experimental apparatus consisted of a glass aquarium with a  $10\ \text {cm} \times 10\ \text {cm}$ square cross-section which was partially filled to the depth of 5 cm with water (Millipore water, resistivity, 18.2 M
 $\Omega$ cm) (see figure 6). The cross-section of the container and the depth of water was selected to ensure that they were large enough so that the container walls did not constrain the induced flow. A solutocapillary flow was generated by releasing fresh or saltwater onto the surface using a needle held perpendicular to the surface touching the water surface. To avoid contamination, the salt solutions were prepared using Sigma-Aldrich sodium chloride (purity
 $\geq$99.0 %). The salt concentration in the waterbody was 35, 70 or 105 g l
 $^{-1}$. The flow rate from the needle was controlled by a syringe pump. The transient solutocapillary flow in the waterbody was measured by the PIV technique. A high-speed camera was used to record seeding particles’ motion visible on a vertical plane illuminated by a laser sheet, normal to the camera axis. The camera's vertical position was in line with the water surface, providing an undistorted view of the volume directly below the water surface. We used 14 micron silver-coated neutrally buoyant glass particles in our PIV experiments. The particle concentration was so that there were approximately 15–20 particles per interrogation window. Then an open-source code, PIVlab, was used for the time-resolved PIV analysis. PIVlab is a Matlab based software which analyses a time sequence of frames to give the velocity distribution for each frame (Thielicke & Stamhuis Reference Thielicke and Stamhuis2014).
Schematic of the experimental set-up used to create a point freshwater source on the surface of a saltwater body.

We also employed the PLIF technique in which CO $_2$ is used as a flow tracer, and its transport allows us to visualize the solutocapillary flow. A
 $1.0\times 10^{-5}$ mol l
 $^{-1}$ fluorescein sodium (Uranine
 $\textrm {C}_{20}\textrm {H}_{10}\textrm {Na}_2\textrm {O}_5$) solution was used to monitor the concentration of dissolved
 $CO_2$ in the waterbody on a vertical plane illuminated by a laser sheet. At this concentration, water's surface tension remained approximately equal to that of pure water (Takagaki & Komori Reference Takagaki and Komori2014). The fluorescence intensity of the Uranine solution decreases with decreasing pH, and thus since the pH decreases with increasing
 $CO_2$ concentration, the areas with increased
 $\textrm {CO}_2$ concentration appear darker. In our experiments, pressurized
 $\textrm {CO}_2$ from a cylinder was released via a diffuser into a closed chamber above the water surface, increasing the concentration of
 $\textrm {CO}_2$ in the chamber and absorption of additional
 $\textrm {CO}_2$ into the waterbody. The newly absorbed
 $\textrm {CO}_2$ was concentrated in a thin layer near the surface. The layer appeared darker in the PLIF experiments as its fluorescence intensity was weaker than in bulk. Dissolved
 $\textrm {CO}_2$ slowly diffused into the waterbody. The solutocapillary flow convected the
 $\textrm {CO}_2$ rich water near the surface in the flow direction, with the latter serving as a flow tracer.
In our experiments, the local surface salt concentration of the waterbody was reduced by injecting freshwater at a constant volume flow rate onto the surface. This approach is necessary because it is difficult, if not impossible, to remove salt locally from the water surface at a fixed rate. The volume of freshwater injected in our experiments was much smaller than the volume of the waterbody, and so the change in the average salt concentration of the waterbody due to the addition of water was small. The inside diameter of the syringe needle was 0.2 mm, which ensured that the water was injected onto a relatively small area on the surface.
When freshwater is injected onto the surface, the salt concentration near the source decreases, which causes a solutocapillary flow (see supplementary movie 1 available at https://doi.org/10.1017/jfm.2021.500). Notice that, since the salt concentration is reduced near the source, this case is equivalent to the case when a negative salt source is present on the surface. In order to quantify the reduction in the salt concentration, notice that the addition of freshwater causes a salt deficit equal to the volume of freshwater added times the salt concentration in the waterbody, i.e.
 \begin{equation} \text{Salt deficit} = c_\infty V_s, \end{equation}
where  $V_s=Q\Delta t$ is the volume of freshwater added in the time interval
 $\Delta t$,
 $c_\infty$ is the solute concentration of the waterbody before the addition of freshwater, and
 $Q$ is the volume flow rate from the source. The average concentration after the addition of freshwater is
 $c_{av}=c_\infty V_b/ (V_b+V_s) \approx c_\infty ,$ where
 $V_b$ is the volume of the waterbody, and the volume of freshwater added is small,
 $V_b \gg V_s$. An equivalent negative solute flow rate
 $Q_c$ can be obtained by dividing the salt deficit given by (3.1) by the time interval
 $\Delta t$
 \begin{equation} Q_c={-}\frac{c_\infty V_s}{\Delta t}={-}c_\infty Q. \end{equation}
From this equation, we notice that a constant freshwater injection rate ensures an effective constant salt outflow rate. This relation allows us to quantitatively compare our experimental measurements with the theoretical results presented in § 2.
Furthermore, (3.2) implies that when  $c_\infty$ is larger the same effective solute flow rate
 $Q_c$ is obtained for a smaller
 $Q$. For example,
 $Q_c$ for the 35 g l
 $^{-1}$ case with
 $Q = 100$
 $\mathrm {\mu }$l min
 $^{-1}$ is equal to that for the 70 g l
 $^{-1}$ case with
 $Q = 50$
 $\mathrm {\mu }$l min
 $^{-1}$. This is important because the water flow rate from the syringe for the 70 g l
 $^{-1}$ case is one half of the flow rate for the 35 g l
 $^{-1}$ case, and so the resulting error due to the introduction of freshwater is smaller. Thus, we expect that the velocity field near the source needle for a waterbody with higher salt concentration to be closer to that for an ideal negative solute source from which the water flow rate is zero, and in the limiting case when
 $c_\infty$ approaches infinity, it will be the same as for the ideal negative solute source.
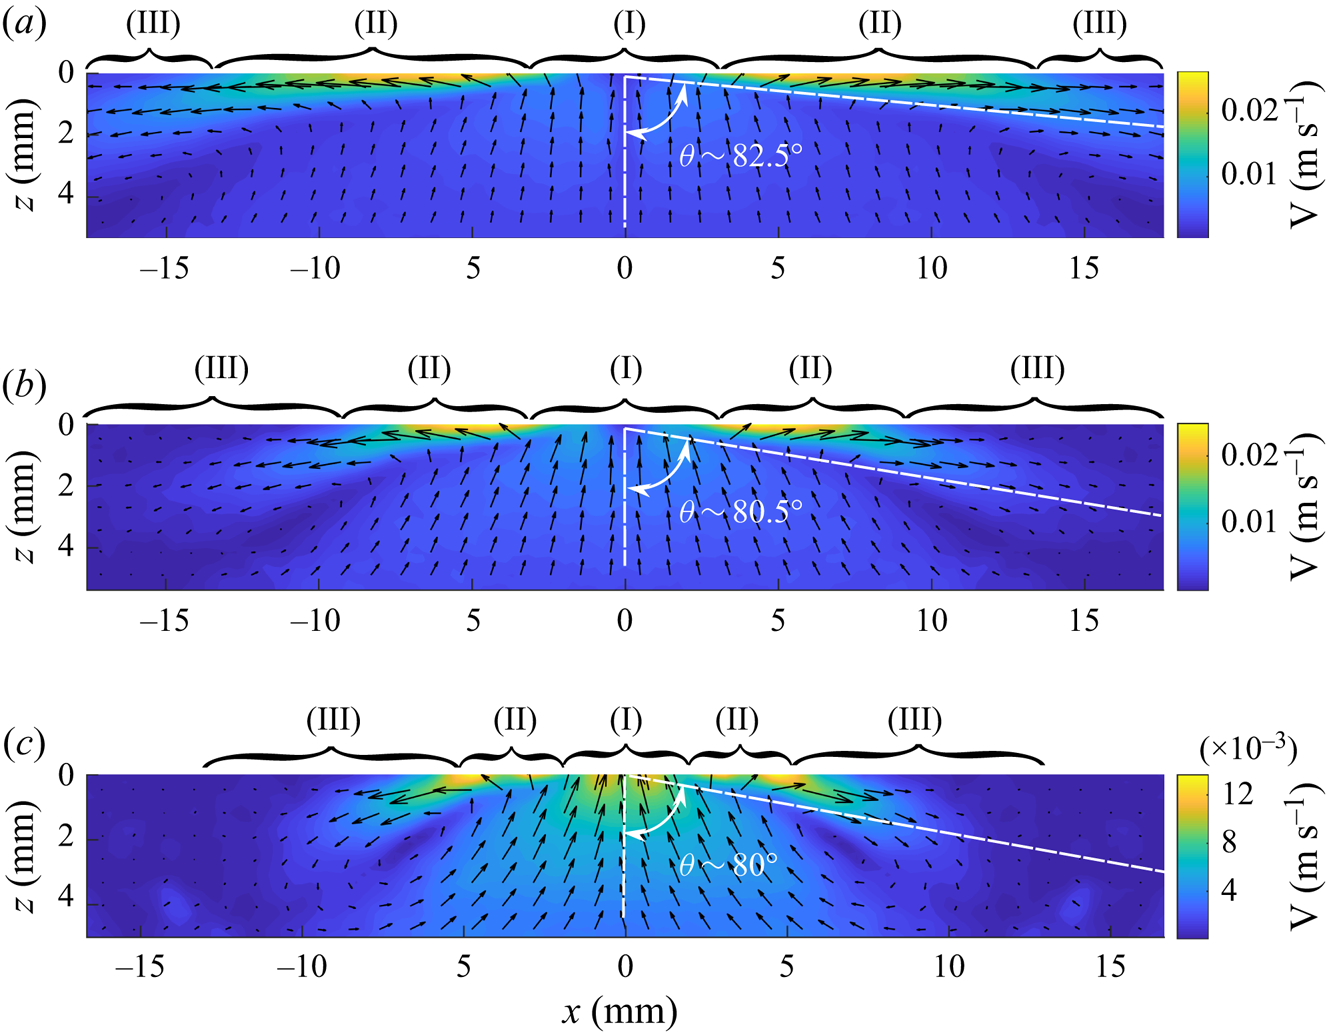
In figure 7, the velocity fields for three flow rates are shown on a vertical plane passing through the centre of the syringe needle used to inject freshwater onto the surface of the saltwater body with 35 g l $^{-1}$. Notice that in region II, the velocity field obtained using the PIV technique is qualitatively similar to that for the analytic solution presented in figure 3(c) for a negative solute source. However, it differs near the source needle (region I) and in region III. The end of region II is taken to be the location at which w becomes positive. The data beyond this distance differ from the analytic solution; as for the latter, w is negative throughout the flow domain. At the end of region III, the surface flow changes direction into the waterbody, and the PIV velocity field is no longer similar to the analytic solution. The inflow in region II is in a conical region, and the outflow is outside this conical region. As is the case for the analytic solution shown in figure 3(c), the velocity magnitude along the cone boundary is locally minimal, and the cone angle increases with increasing freshwater flow rate. The half-cone angles for the three cases shown in figure 7(a–c) are
 $82.5^{\circ }$,
 $80.5^{\circ }$ and
 $80.0^{\circ }$. The corresponding values for the analytic solution are
 $83.55^{\circ }$,
 $82.32^{\circ }$ and
 $80.89^{\circ }$, respectively. The half-cone angles in experiments are approximately 1–2 degrees smaller than for the corresponding analytic solution for all three cases. The angles are measured in the middle of region II, and since the length of region II increases with increasing freshwater flow rate, there is smaller uncertainty in the measured angle for the higher flow rates. In a waterbody with 35 g l
 $^{-1}$ salt concentration, a velocity field with three clearly distinguishable regions only develops when the flow rate is approximately 30
 $\mathrm {\mu }$l min
 $^{-1}$ or larger.
The velocity field on a vertical plane passing through the centre of the needle used to inject freshwater onto the surface obtained using the PIV technique. The distribution on the right side of the needle was measured and on the left side is the mirror image of the former. The solute concentration in the waterbody was 35 g l $^{-1}$. Region (I): flow influenced by the needle. Region (II): flow qualitatively matches the analytic solution. Region (III): surface flow slows and changes direction into the waterbody at the end of this region. The half-cone angles for region II are also marked. Panel (a) shows
 $Q_c= -2.33\times 10^{-7}$ kg s
 $^{-1}$ (
 $Q = 400$
 $\mathrm {\mu }$l min
 $^{-1}$,
 $K=1525.8$). The outer boundary of region III extends beyond the image boundary, (b)
 $Q_c = -1.17\times 10^{-7}$ kg s
 $^{-1}$ (
 $Q = 200$
 $\mathrm {\mu }$l min
 $^{-1}$,
 $K=961$) and (c)
 $Q_c= -0.58\times 10^{-7}$ kg s
 $^{-1}$ (
 $Q = 100$
 $\mathrm {\mu }$l min
 $^{-1}$,
 $K=606$).

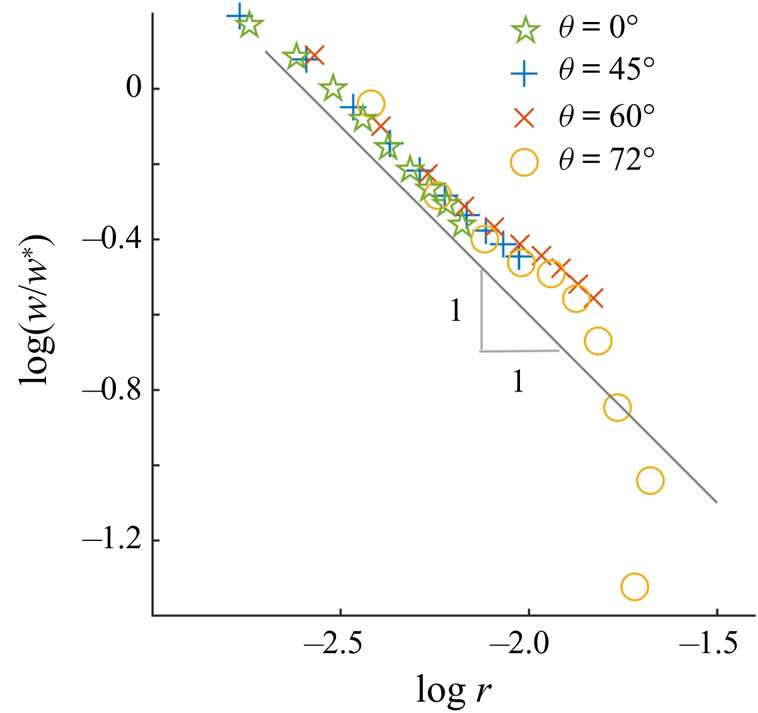
Figure 8 shows the non-dimensionalized  $z$-components of velocity
 $w/w^*$ for
 $\theta =0^{\circ }$,
 $\theta =45^{\circ }$,
 $\theta =60^{\circ }$ and
 $\theta =72^{\circ }$ as a function of the radial distance
 $r$ from the source on a log–log plot. The non-dimensionalization is done using the velocity component
 $w^*$ at a fixed distance
 $r_0=0.61$ mm from the source for each direction. The waterbody salt concentration for this case is 105 g l
 $^{-1}$ and the flow rate is 100
 $\mathrm {\mu }$l min
 $^{-1}$. In region II, the profiles are linear with the slope approximately equal to
 $-1$ which shows that for
 $\theta = \textrm {constant}$ the velocity decays as
 $1/r$. The data for
 $\theta ={\rm \pi} /2$ (not shown) were noisy because, as discussed below, the PIV technique does not allow for accurate measurements near the water surface. Also, note that since
 $u_r$ and
 $u_\theta$ for the analytic velocity vary as
 $1/r$, the
 $z$-components also vary as
 $1/r$. The
 $r$-dependence in region II was similar for the other flow rates and the salt concentrations considered.
Log–log plot of the normalized vertical component of the velocity  $w/w^*$ as a function of
 $r$, in metres, for four different angles:
 $\theta =0^{\circ }$,
 $\theta =45^{\circ }$,
 $\theta =60^{\circ }$ and
 $\theta =72^{\circ }$. The solute concentration in the waterbody was 105 g l
 $^{-1}$ and
 $Q_c = -1.75\times 10^{-7}$ kg s
 $^{-1}$. A line of slope
 $-$1 is also included for reference.

Also, as previous experimental studies have noted, the solutocapillary flow weakens with increasing distance from the source, and at a distance of a few centimetres from the needle, depending on the volume flow rate from the needle, its direction turns into the waterbody (Mizev et al. Reference Mizev, Trofimenko, Schwabe and Viviani2013; Roché et al. Reference Roché, Li, Griffiths, Le Roux, Cantat, Saint-Jalmes and Stone2014; Mandre Reference Mandre2017). This, as discussed below, is accompanied by the formation of vortices, which cause gases dissolved near the surface to mix in the bulk water. The flow field after this distance was not qualitatively similar to the analytic solution. The distance for which the surface flow persisted increased with increasing flow rate from the needle (see figure 7). For the flow rates of  $Q_c= -2.33\times 10^{-7}$ kg s
 $^{-1}$,
 $Q_c = -1.17\times 10^{-7}$ kg s
 $^{-1}$ and
 $-5.83\times 10^{-8}$ kg s
 $^{-1}$, the distances were approximately 2.5, 1.7 and 1.3 cm, respectively.
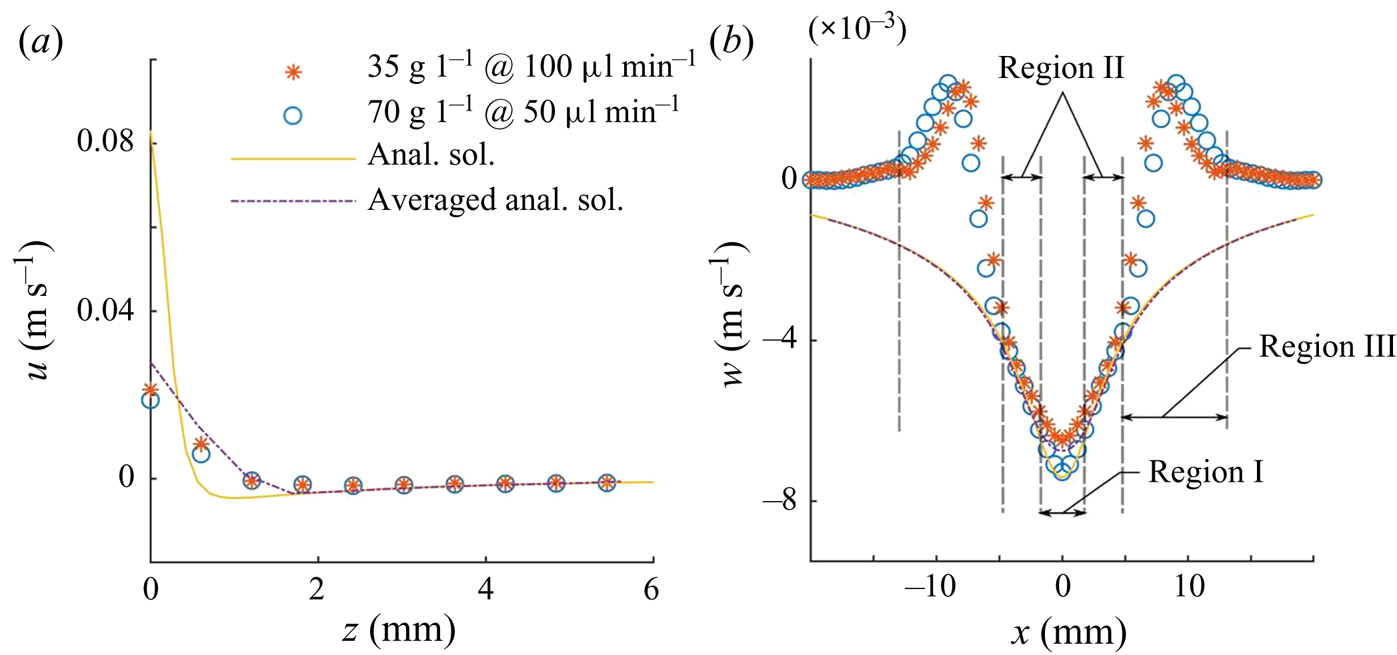
In figure 9(a) the  $x$-component of velocity
 $u$ obtained from the PIV data is plotted as a function of
 $z$ at a flow rate of 50
 $\mathrm {\mu }$l min
 $^{-1}$ for a waterbody with 70 g l
 $^{-1}$ salt concentration and at a flow rate of 100
 $\mathrm {\mu }$l min
 $^{-1}$ for a waterbody with 35 g l
 $^{-1}$ salt concentration. These two combinations of the flow rates and the waterbody salt concentrations result in the same effective solute flow rate of
 $Q_c = -5.83\times 10^{-8}$ kg s
 $^{-1}$. In figure 9(b) the
 $z$-component of velocities (
 $w$) are shown as a function of
 $x$ for these cases. The profile in figure 9(a) is for
 $x= 3.0$ mm which is in region II. The profile in figure 9(b) is for
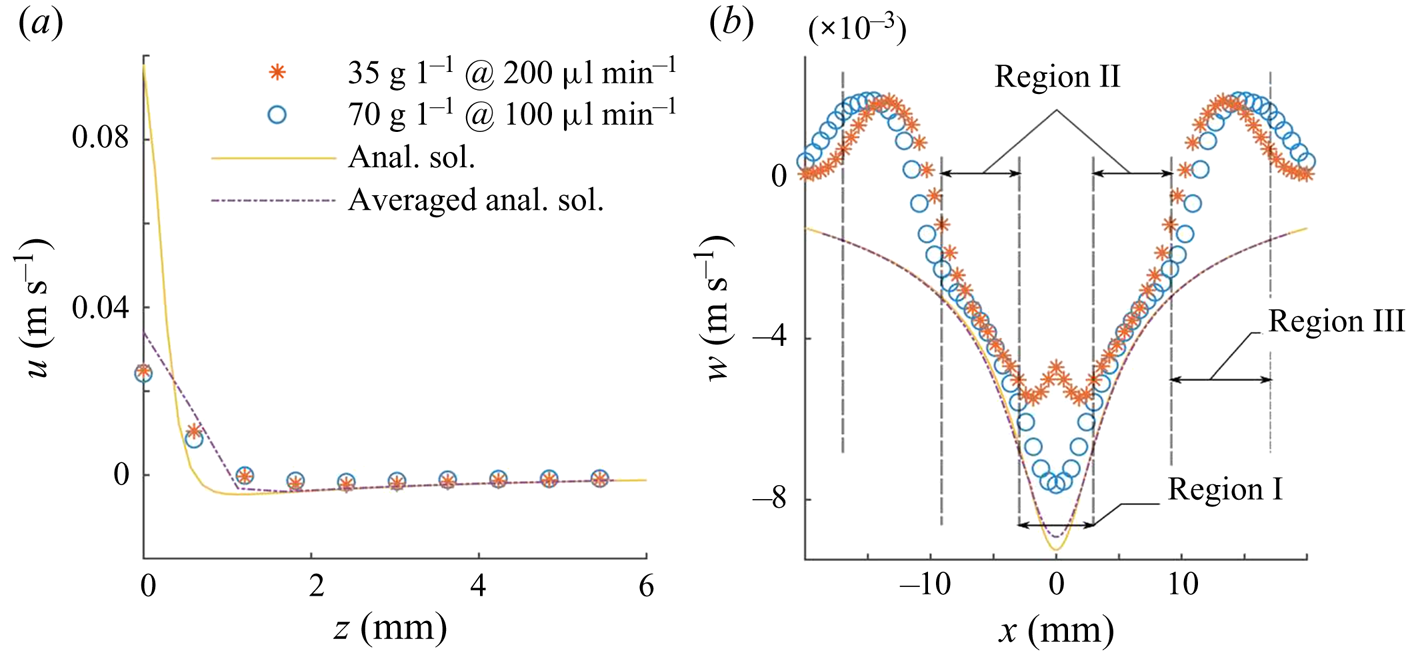
 $z= 3.0$ mm and passes though regions I, II and III. In figure 10 similar data are shown for
 $Q = 100$ and 200
 $\mathrm {\mu }$l min
 $^{-1}$ with the saltbody concentrations of 70 and 35 g l
 $^{-1}$, respectively. The effective solute flow rate for these cases is
 $Q_c = -1.17\times 10^{-7}$ kg s
 $^{-1}$. In figures 9 and 10, the values of
 $K$ are
 $606$ and
 $961$, respectively. These values of
 $K$ were used in (2.7) and (2.8) to obtain the analytic velocity components. Since the analytic velocity field is computed for the same
 $Q_c$ as for the PIV data, there are no adjustable parameters. These figures also include the corresponding velocity components for the analytic solution and the average velocity components obtained by locally averaging over an
 $0.6\ \textrm {mm} \times 0.6\ \textrm {mm}$ area, which is of the same size as the averaging area used in the PIV analysis. The averaging in the middle of the domain is symmetric. However, at and near the water surface, the averaging is one sided (as there are no data points available above the surface) and is progressively transitioned to symmetric averaging for the points below the surface.
Velocity distribution on a vertical plane passing through a negative source for  $Q_c = -5.83\times 10^{-8}$ kg s
 $^{-1}$ (
 $K = 606$); (a)
 $u$ as a function of
 $z$ for
 $x = 3.0$ mm, (b)
 $w$ as a function of
 $x$ for
 $z = 3.0$ mm. Anal. sol., analytic solution.

Velocity distribution on a vertical plane passing through a negative source for  $Q_c = -1.17\times 10^{-7}$ kg s
 $^{-1}$ (
 $K = 961$); (a)
 $u$ as a function of
 $z$ for
 $x = 4.2$ mm, (b)
 $w$ as a function of
 $x$ for
 $z = 3.0$ mm.

Figures 9 and 10 show that there is approximate agreement between the PIV velocity profiles for the two flow rates with different waterbody salt concentrations. This implies that (3.2) correctly estimates the effective solute flow rate, and that the model correctly captures the dependence on the salt concentration in the waterbody. There is a significant difference between the profiles only in region I near the needle where the velocity magnitude for the flow rate of 50  $\mathrm {\mu }$l min
 $^{-1}$ is larger than for 100
 $\mathrm {\mu }$l min
 $^{-1}$. This is expected because, in the former case, the same effective solute flow rate is obtained by injecting water at a lower rate. The flow from the needle in region I is in the opposite direction to the solutocapillary flow and, as a result, the PIV velocity magnitude for the flow rate of 100
 $\mathrm {\mu }$l min
 $^{-1}$ is smaller than for the 50
 $\mathrm {\mu }$l min
 $^{-1}$ case.
Figure 9 also shows that the PIV velocity profiles are in approximate agreement with the analytic velocity profiles in region II. In region I, the PIV profile for the 70 g l $^{-1}$ case is closer to the analytic profile, as the freshwater flow rate for this case is smaller than for the 35 g l
 $^{-1}$ case. The analytic and PIV profiles deviate from each other near the water surface because the PIV technique's accuracy diminishes near the surface. The averaged analytic profiles in regions I and II are closer to the PIV profiles. Also, as expected, the profiles do not match in region III and beyond.
In figure 10, the approximate agreement between the PIV velocity and the analytic solution holds only in region II. The size of region I for this case, is larger than in figure 9, as the flow rate from the needle is larger. Also, in region I, the PIV profiles differ substantially from the analytic solution, but they are closer to the averaged analytic profiles. Also, as expected, the profile for the 70 g l $^{-1}$ salt concentration case is closer to the analytic solution.
Due to the high spatial gradient of  $u$ in the boundary layer region near the surface, the profile was not accurately resolved in the PIV measurements. Notice that the measured values of
 $u$ at and near the surface differ significantly from the analytic values. The momentum boundary layer thickness for the PIV velocity profile in figure 10(a) is approximately 1.2 mm and for the analytic solution 0.69 mm (and it is 1.16 mm for the averaged analytic velocity), and in figure 9(a) they are 1.1 and 0.5 mm, respectively (and 1.13 mm for the averaged analytic velocity). The uncertainty in the momentum boundary layer thickness is due to the fact that the width of the averaging area is of the same order as the momentum boundary layer thickness. Moreover, the averaging area at and near the surface is centred below the intended points which introduces additional error, especially because there is a strong
 $z$-dependence of
 $u$ near the surface.
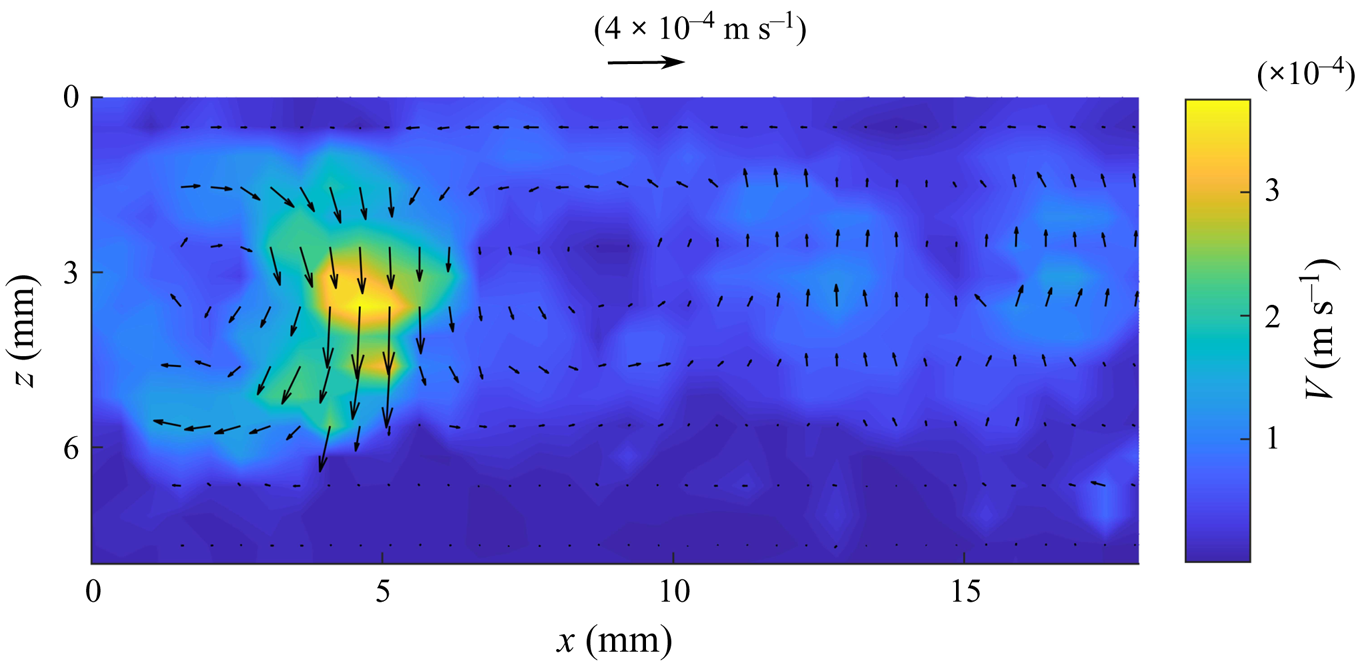
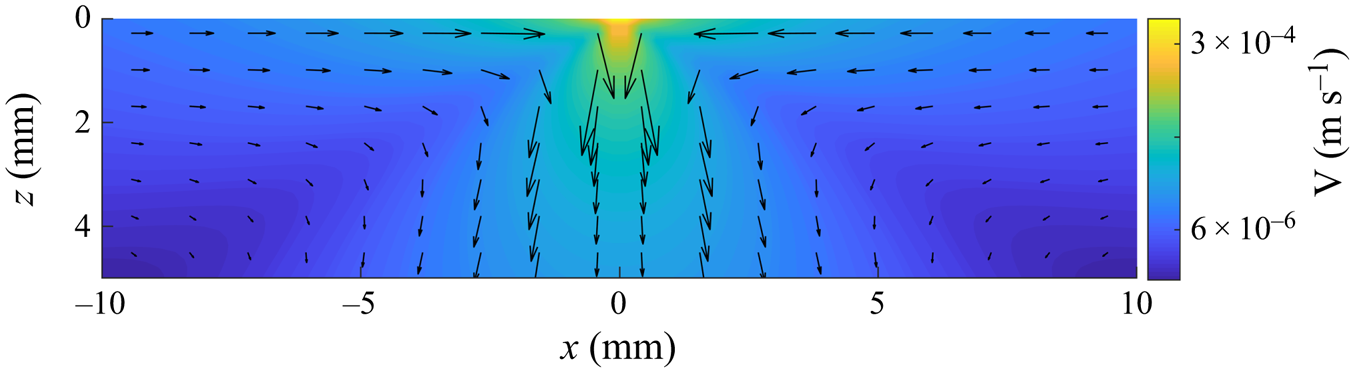
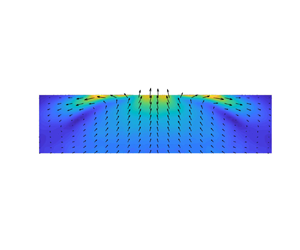
According to the analytic solution, the flow on the surface slows down with increasing distance as  $1/r$, but its direction does not change into the waterbody. We postulate that the surface flow changes direction in experiments because of the presence of other naturally occurring adverse surface tension gradients which interfere with the flow when the solute-induced surface tension gradient, which diminishes with increasing distance from the source, is no longer the dominant gradient. For example, the water surface is cooler than the bulk because of the evaporative cooling, which gives rise to Rayleigh–Bénard–Marangoni (RBM) convection cells that are accompanied by temperature and surface tension gradients on the surface (Spangenberg & Rowland Reference Spangenberg and Rowland1961). It is also noted in the paper that the convection cells due to evaporative cooling begin to form within 70 s which is shorter than the time needed for conducting our PIV experiments. Figure 11 shows the velocity field on a vertical plane induced due to evaporative cooling in our set-up. The flow cells are transient; they appear and dissipate with time.
Velocity field induced on a vertical plane due to evaporative cooling in the absence of solutocapillary flow. Notice that, in addition to the cell near the left of the middle, there are two other weaker cells.

The RBM surface tension gradients arise because of the temperature variation on the surface, and thus the magnitude of  $(\textrm {d}\gamma /\textrm {d}r)_{RBM}= |(\textrm {d}\gamma /\textrm {d}T)| \,|(\textrm {d}T/\textrm {d}r)|$. For water,
 $\textrm {d}\gamma /\textrm {d}T= -1.7\times 10^{-4}$ N m
 $^{-1}$
 $^{\circ }$C
 $^{-1}$, Spangenberg & Rowland (Reference Spangenberg and Rowland1961) and so
 $(\textrm {d}\gamma /\textrm {d}r)_{RBM}= 1.7\times 10^{-4}\ |\textrm {d}T/\textrm {d}r|$. From the experimental data of the RBM convection due to evaporation under standard conditions,
 $\textrm {d}T/\textrm {d}r\approx 0.1^{\circ }\text {C}/1 \text {cm} =10^{\circ }$ C m
 $^{-1}$ (estimate from figure 10 in Spangenberg & Rowland (Reference Spangenberg and Rowland1961)). Thus,
 $(\textrm {d}\gamma /\textrm {d}r)_{RBM}= 1.7$ mN m
 $^{-2}$ (which will vary with other factors such as the waterbody temperature and the humidity which influences the evaporation rate). We therefore expect that the surface flow would face strong interference when the solute-induced surface tension gradient reduces to this approximate magnitude.
The solute-induced surface tension gradient cannot be measured using the experimental techniques employed in this study. However, we can estimate it using the expression obtained in § 2,  $\textrm {d}\gamma /\textrm {d}r=K\nu \mu /r^2$. For example, for the case shown in figure 7(a), the estimated
 $K=1525.8$ and at the end of region III,
 $r=2.5$ cm (the figure does not show the entire region III as the flow extended beyond the frame; the size of the frame was selected based on the PIV requirements and it is the same for the three cases shown in the figure), and so
 $\textrm {d}\gamma /\textrm {d}r=1.93$ mN m
 $^{-2}$ which is of the same approximate magnitude as the RBM convection-induced surface tension gradient as discussed above. Also, note that the above changes in the surface tension due to evaporative cooling are not axisymmetric, and as discussed earlier, Bratukhin & Maurin (Reference Bratukhin and Maurin1982) have shown that even weak azimuthal perturbations can destabilize solutocapillary flows.
We next estimate the distance at which the magnitude of solute-induced surface tension gradient becomes comparable to that for the RBM convection. Setting the solute surface tension gradient  $\textrm {d}\gamma /\textrm {d}r=K\nu \mu /r^2$ equal to that for the RBM convection, we have
 $\textrm {d}\gamma /\textrm {d}r=K\nu \mu /r^2 = (\textrm {d}\gamma /\textrm {d}r)_{RBM}= 1.7\times 10^{-4} \textrm {d}T/\textrm {d}r$. The distance at which the two gradients are equal,
 $r_c=\sqrt {(K\nu \mu )/(1.7\times 10^{-4} \textrm {d}T/\textrm {d}r)} = 76.7\sqrt {(K\nu \mu )/(\textrm {d}T/\textrm {d}r)}$.
Using  $\textrm {d}T/\textrm {d}r\approx 10\,^{\circ }\textrm {C}\ \textrm {m}^{-1}$ in the expression above,
 $r_c = 76.7\sqrt {K\nu \mu /10}= 24.3 \sqrt {K\nu \mu }$. Thus, for
 $K=1525.8$, which corresponds to the case shown in figure 15(a),
 $r_c= 2.9$ cm. This distance is comparable to the distance of 2.5 cm for which the surface flow persisted in figure 7(a). The distances for
 $Q_c = -1.17\times 10^{-7}$ kg s
 $^{-1}$ (
 $K=961$) and
 $-5.83\times 10^{-8}$ kg s
 $^{-1}$ (
 $K=606$), are 2.4 and 1.9 cm, respectively. The corresponding values in figure 7 are 1.7 and 1.3 cm, respectively. This model for the critical distance based on the RBM surface tension gradient prevailing on the surface thus approximately estimates the distances at which the surface flow changes direction into the waterbody.
We also observed that, soon after the water was vigorously mixed, the solutocapillary flow on the surface was stronger and changed direction into the waterbody after a longer distance. However, after about a minute, which is the time interval after which the RBM convection cells form on the surface, the flow slowed and changed direction at the same distance as before. The presence of the RBM convection cells and associated surface tension gradients are expected to interfere with the solutocapillary flow after it weakens sufficiently. This, however, does not rule out the possibility that other mechanisms interfere with the flow and come into play after a similar time interval. For example, the presence of a trace amount of surfactant, which may also accumulate at the surface after a similar time interval, can also diminish the strength of solutocapillary flow. This possibility was, however, ruled out for our experiments as the experiments were performed using ultra-pure water.
3.1. PLIF visualization and solute transport due to solutocapillary flow
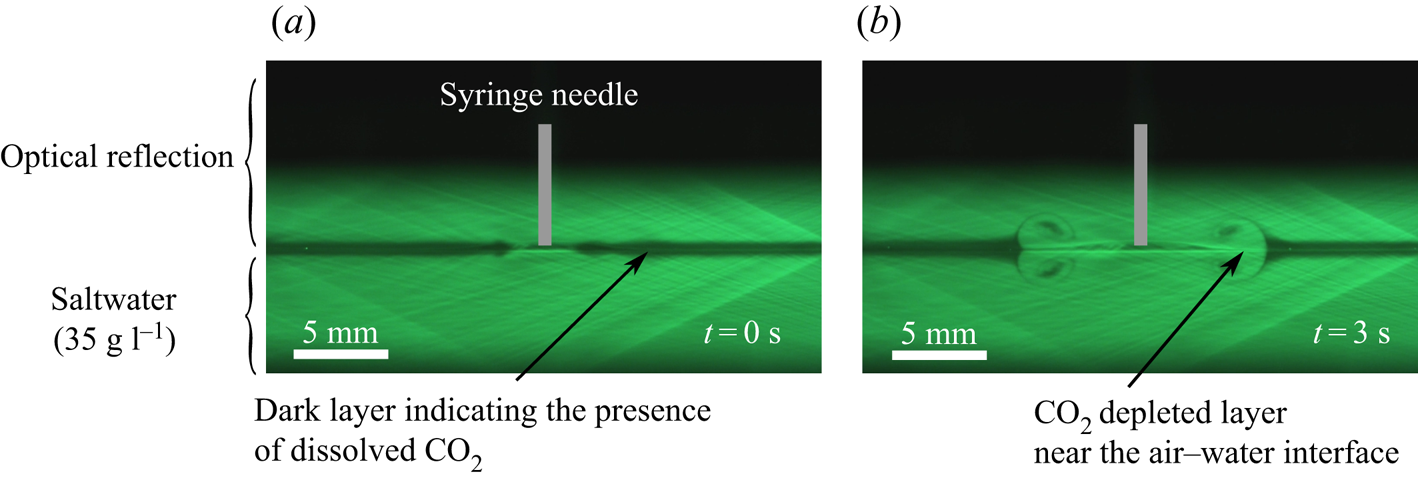
The PLIF technique can be used to visualize the solutocapillary flow induced at and near the water surface, including its start-up behaviour, by monitoring the  $\textrm {CO}_2$ concentration profile as a function of time. As discussed above, a thin layer of
 $\textrm {CO}_2$ rich region, approximately 0.5 mm thick, is formed near the water surface by releasing
 $\textrm {CO}_2$ into the chamber at the beginning of the experiment (see figure 12). Since the diffusion rate of
 $\textrm {CO}_2$ is low, the layer diffuses slowly into the bulk, but it is readily convected by the flow. Thus, the time evolution of the
 $\textrm {CO}_2$ concentration profile can be used to visualize the induced solutocapillary flow (see Dussaud & Troian Reference Dussaud and Troian1998; Kim et al. Reference Kim, Muller, Shardt, Afkhami and Stone2017 for other visualization approaches). The
 $\textrm {CO}_2$ rich layer in this figure is transported by the solutocapillary flow induced by a freshwater source present in the middle of the photograph. The figure shows that the flow is symmetric and that it induces vortices in the near-surface layer which causes a
 $\textrm {CO}_2$ rich surface layer of water to mix with the water below. After the surface flow changes direction inwards, the radially outward transport of
 $\textrm {CO}_2$ rich surface layer stops.
PLIF images of  $\textrm {CO}_2$ concentration profiles as it is being transported by the flow induced by a solute source (
 $Q_c = -5.83\times 10^{-8}$ kg s
 $^{-1}$) present in the middle. (a) Shortly after
 $\textrm {CO}_2$ was injected in the chamber it is concentrated near the surface in the black band. The actual thickness of the layer is one half of the band thickness, as the upper half of the band is the reflection of the actual band. The image shows the distribution just before the source flow was switched on. (b) The induced solutocapillary flow transports
 $\textrm {CO}_2$ rich layer away from the source and into the bulk. The image shows the distribution 3 s after the flow was switched on, and the
 $\textrm {CO}_2$ distribution was quasi-steady.

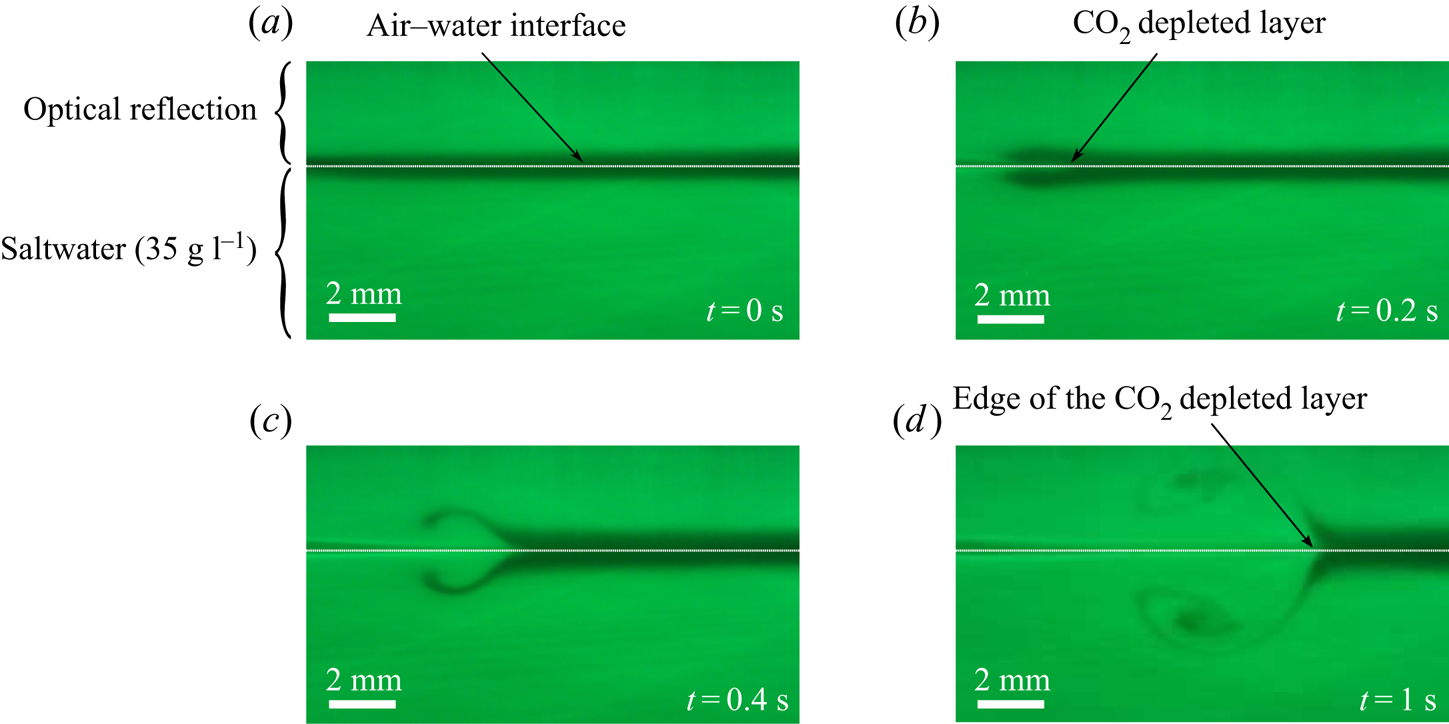
Figure 13 shows the magnified views of the  $\textrm {CO}_2$ concentration profiles as a layer of
 $\textrm {CO}_2$ is transported by the solutocapillary flow induced by a freshwater source present on the surface, which is out of view and one centimetre to the left of the photograph (not visible in the photograph). The induced flow on the surface is towards the right, and below the surface, it is towards the needle, and so the
 $\textrm {CO}_2$ rich dark layer of water on the surface is swept to the right (away from the needle), and its place is taken by the water from below which has smaller
 $\textrm {CO}_2$ concentration (hence colourless). Furthermore, as the water velocity is maximal at the surface and decreases sharply with increasing distance from the surface, the part of the
 $\textrm {CO}_2$ rich layer at and near the surface is convected to a greater distance than the part slightly below the surface which creates a colourless band near the surface in which the
 $\textrm {CO}_2$ concentration is smaller (and also the salt concentration). As a result, the left end of the layer in figure 13(b) looks like a horseshoe (however, note that the upper part of the shoe in the photograph is the reflection of the lower part.) The thickness of this colourless band is
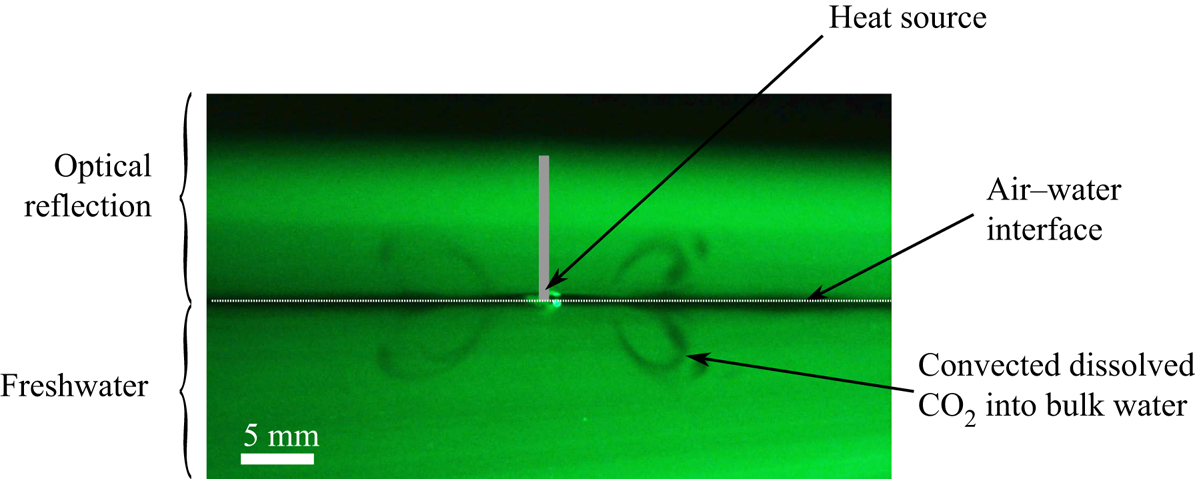
 $\approx$0.5 mm, which is of the same order as the momentum boundary layer thickness. In contrast, the thermocapillary flow on the surface induced by a hot rod persisted for only a few millimetres and then it changed direction inwards (see figure 14). As a result, in this case
 $\textrm {CO}_2$ was transported in a relatively smaller region near the heat source and the half-cone angle for inflow was around
 $60^{\circ }$.
Magnified PLIF images of  $\textrm {CO}_2$ concentration profiles at four different times. The source needle (
 $Q_c = -1.17\times 10^{-7}$ kg s
 $^{-1}$) is present at a distance of 1 cm on the image's left side. White dotted lines are added to distinguish the optical reflection from the bulk. (a) Shortly after
 $\textrm {CO}_2$ was injected in the chamber. (b–d) The solutocapillary flow transported
 $\textrm {CO}_2$ layer away from the source.

A PLIF image of  $\textrm {CO}_2$ transport by the quasi-steady thermocapillary flow induced by a cylindrical heat source present on the surface. The half-angle of the conical inflow region is approximately
 $60^{\circ }$ and the
 $\textrm {CO}_2$ rich layer moves inwards after a few millimetres.

As noted earlier, for the source flow rates considered in this study, the radially outward flow on the surface changed direction into the waterbody at a distance of a few centimetres from the needle, which marks the end of region III. Beyond this distance, the streak lines of  $\textrm {CO}_2$ leave the surface at an angle into the waterbody. The latter is consistent with the velocity distribution of figure 7. Also, the
 $\textrm {CO}_2$ concentration profile on the surface does not change beyond this distance as the convection transport is not present. This suggests that the salt concentration is also approximately constant beyond this point, which is consistent with the fact that there is no solutocapillary flow in this region (in agreement with the measurements reported in Roché et al. (Reference Roché, Li, Griffiths, Le Roux, Cantat, Saint-Jalmes and Stone2014) which show that the surfactant concentration is approximately constant after the surface flow changes direction into the waterbody). The water moving downward away from the surface carries
 $\textrm {CO}_2$ rich water, enhancing the mixing of the surface water into the bulk.
4. Summary and discussion
In summary, the focus of this paper is on the solutocapillary flow induced at and below the surface by a freshwater point source present on the surface of a saltwater body. The experiments have been conducted for three salt concentrations of the waterbody and several source flow rates. Our PIV data show that the flow induced in experiments is far more complex than the analytic solution because of the influence of other factors that are not included in the analytic model. The flow can be divided into three main regions. The velocity field measured using the PIV technique is in approximate agreement with the analytic solution only in region II. They differ in region I (near the source needle) and region III and beyond after the solute-induced surface tension gradient becomes small. There is an approximate agreement in all three regions between the PIV results that have the same effective solute flow rate from the source, as determined by 3.2, but have different waterbody salt concentrations.
The analytic solution has a separable form with its strength varying as  $1/r$ and the same
 $\theta$ dependence for all values of
 $r$. The flow has a spherical axisymmetric form such that
 $u_r <0$ in a conical region with its vertex at the source and
 $u_r >0$ outside the conical region. The velocity magnitude is locally minimal along the cone boundary. The velocity components assume positive and negative values such that the net liquid flow rate from the source is zero, and become singular as
 $r$ approaches zero. The flow induced by a solute source is thus analogous to that induced by a doublet consisting of a source–sink pair, except that the solutocapillary flow is limited to the half-space below the water surface. These features of the analytic solution are also present in the experimentally measured velocity data in region II for
 $Q_c < 0$.
In region II, which starts a few millimetres from the source needle, there is an approximate agreement with the velocity field given by the analytic solution, which does not contain any adjustable parameters. The only input parameters in the analytic solution are the water and salt properties, salt concentration and the flow rate from the source needle. The comparison has been verified for several different flow rates from the source needle and salt concentrations of the waterbody, including the cases which have different salt concentrations and flow rates from the source needle such that the effective solute flow rates are the same.
Furthermore, the half-cone angle for the induced flow in region II varies with the solute inflow rate, as the critical value of  $\theta$ at which the direction of radial flow reverses increases with the solute inflow rate. At small solute inflow rates, the angle is approximately
 $60^{\circ }$, and increases with increasing solute inflow rate to values greater than
 $80^{\circ }$. Under the latter conditions, the velocity and concentration boundary layers develop near the surface as the outflow is restricted to a thin axisymmetric wedge-shaped boundary layer region. For the solute flow rates considered, at a distance of
 $1$ cm from the source the solute boundary layer thickness (
 $\approx$0.05 mm) is an order of magnitude smaller than the momentum boundary layer (
 $\approx$1 mm). The sharp changes in the velocity profile near the water surface make its measurement challenging.
In the region near the source needle (region I), the measured velocity magnitude is smaller than for the analytic solution as it is influenced by the presence of the source needle and also by the flow of water from the needle in the opposite direction. The latter influence is reduced when the salt concentration of the waterbody is increased as a smaller water flow rate is required for the same effective solute flow rate and, as a result, there is improved agreement with the analytic solution.
The flow slows down with increasing distance from the source, and after a few centimetres, the surface flow changes direction into the waterbody (end of region III). The flow beyond this distance is qualitatively different from the analytic solution. A similar change in the flow direction happens in other surface tension driven flows at a distance which depends on the governing parameters. This change in the flow direction enhances mixing as it convects the surface water with dissolved gases into the waterbody. The PLIF data show that the solute is not convected beyond this distance, and so the surface tension gradient is negligible. This was also found to be the case for the surfactant-induced Marangoni flows for which the surfactant concentration was constant beyond the distance after which the surface flow direction changes inwards (Roché et al. Reference Roché, Li, Griffiths, Le Roux, Cantat, Saint-Jalmes and Stone2014).
Analysis of the experimental and analytic results shows that the surface flow changes direction at a distance where the solute-induced surface tension gradient reduces to the same order of magnitude as that for the RBM convection due to evaporative cooling under standard room conditions. The latter is not axisymmetric, and earlier studies have shown that even weak azimuthal perturbations can destabilize solutocapillary flows. Also, the expression for the distance at which the surface flow changes direction, obtained by setting the solute and RBM convection-induced surface tension gradients equal, approximately estimates the distance over which the surface flow occurs as a function of the source flow rate.
Supplementary data
Supplementary material and movies are available at https://doi.org/10.1017/jfm.2021.500.
Funding
The support of research by the National Science Foundation Award number CBET-1236035 is gratefully acknowledged.
Declaration of interests
The authors report no conflict of interest.
Appendix
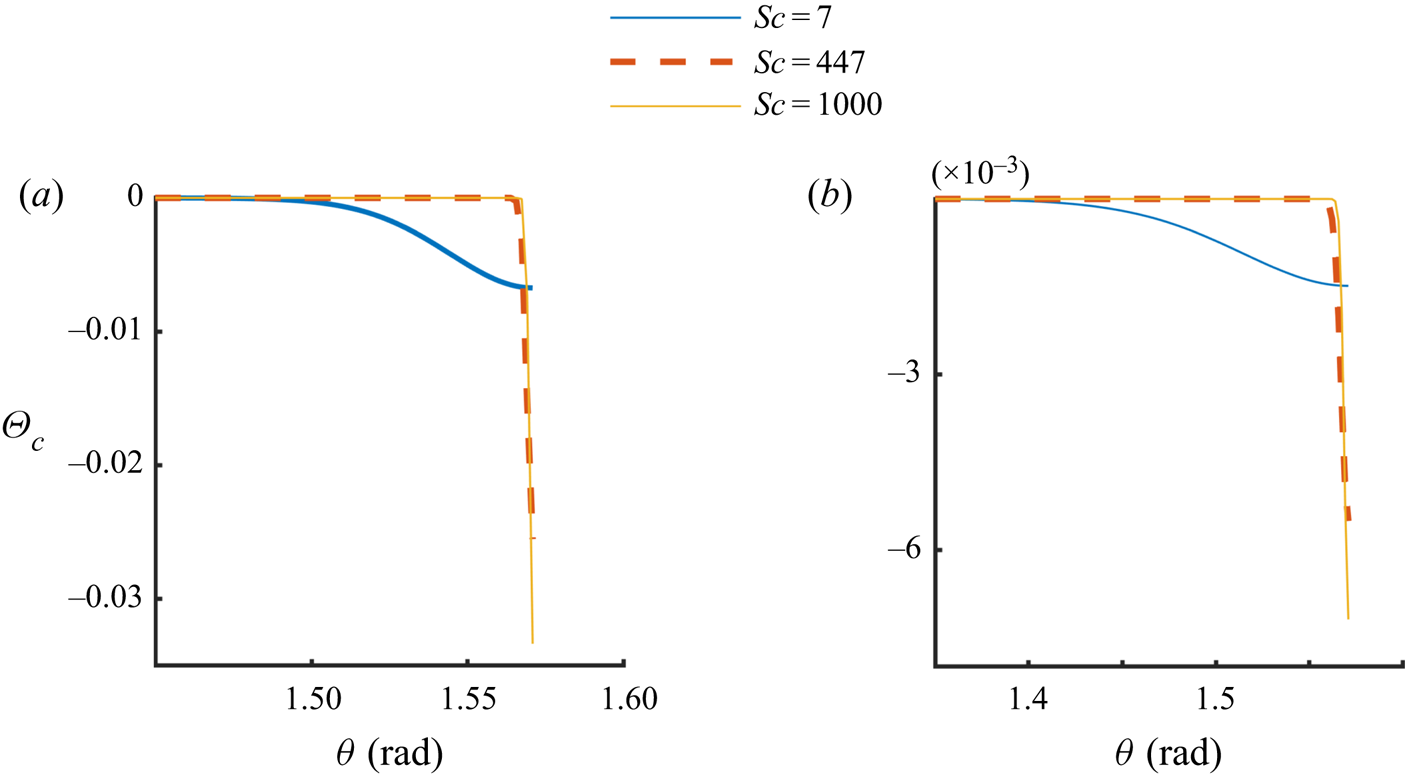
In this section, we discuss the analytic solution given by (2.7)–(2.9), including its dependence on the parameter values. In figure 15,  $\varTheta _c$ is shown as a function of
 $\theta$ for three different values of
 $Sc$, with
 $Q_c = - 2.33\times 10^{-7}$ kg s
 $^{-1}$ in figure 15(a) and
 $Q_c = - 2.33\times 10^{-8}$ kg s
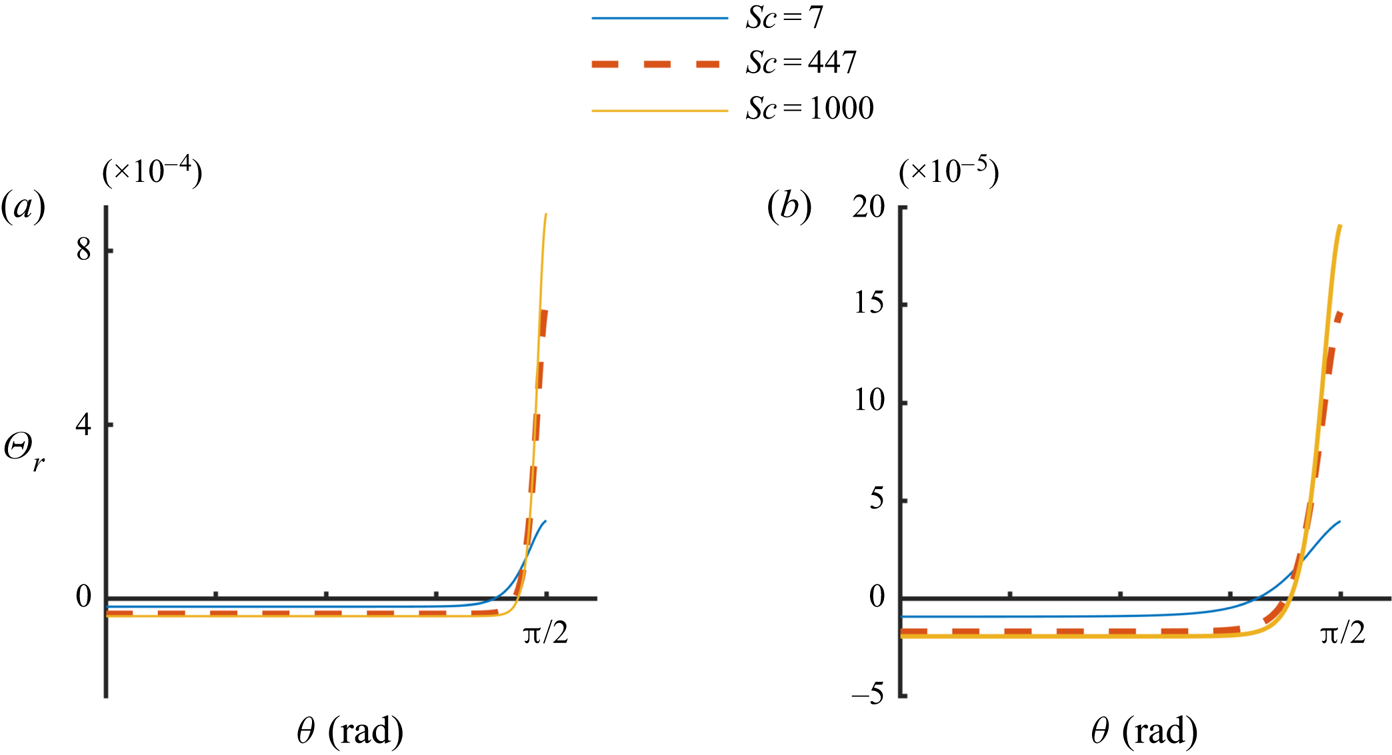
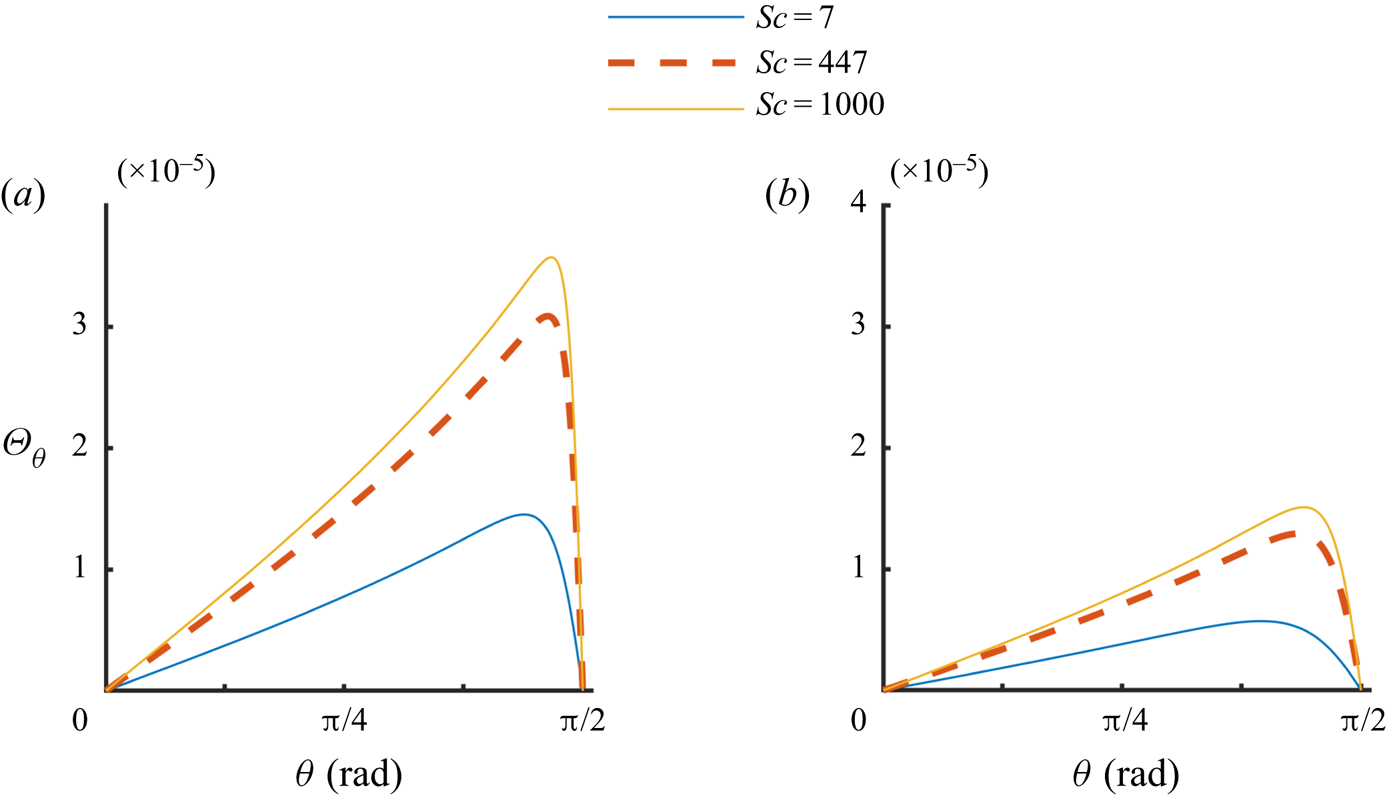
 $^{-1}$ in figure 15(b). Figures 16 and 17 show
 $\varTheta _{r}$ and
 $\varTheta _{\theta }$ as a function of
 $\theta$ for the same parameter values. The value of
 $Sc$ in these figures is increased by reducing
 $D$ while keeping the remaining parameters fixed. The corresponding
 $Ma$ values are included in the figure captions. Figure 15 shows that near the liquid surface, i.e.
 $\theta$ near
 ${{\rm \pi} }/{2}$, the concentration varies slowly with
 $\theta$ for
 $Sc = 7$. However, for
 $Sc=447$ and
 $1000$, a boundary layer of the solute concentration develops in which the solute concentration is sharply reduced while the concentration away from the surface remains approximately zero. Notice that the concentration at the surface is negative because of the presence of a negative solute source which reduces the concentration from the mean bulk concentration that is assumed to be zero. Also, notice that the concentration at the solute source is not specified in the analytic solution, and that only the solute in- or outflow rate is specified. Since the concentration far away from the source is assumed to be zero, for a positive solute source,
 $c > 0$ near the source and approaches infinity, as
 $r\rightarrow 0$. For a negative source (sink),
 $c < 0$ near the source and approaches minus infinity, as
 $r\rightarrow 0$.
Value of  $\varTheta _c$ as a function of
 $\theta$ for three different values of
 $Sc = 7$, 447 and 1000: (a)
 $Q_c = - 2.33\times 10^{-7}$ kg s
 $^{-1}$,
 $Ma = 1.1\times 10^{5}$,
 $7.0\times 10^{6}$,
 $1.57\times 10^{7}$; (b)
 $Q_c = - 2.33\times 10^{-8}$ kg s
 $^{-1}$,
 $Ma = 1.1\times 10^{4}$,
 $7.0\times 10^{5}$,
 $1.57\times 10^{6}$.

Value of  $\varTheta _r$ as a function of
 $\theta$ for three different values of
 $Sc = 7$, 447 and 1000: (a)
 $Q_c = - 2.33\times 10^{-7}$ kg s
 $^{-1}$,
 $Ma = 1.1\times 10^{5}$,
 $7.0\times 10^{6}$,
 $1.57\times 10^{7}$; (b)
 $Q_c = - 2.33\times 10^{-8}$ kg s
 $^{-1}$,
 $Ma = 1.1\times 10^{4}$,
 $7.0\times 10^{5}$,
 $1.57\times 10^{6}$.

Value of  $\varTheta _{\theta}$ as a function of
 $\theta$ for three different values of
 $Sc = 7$, 447 and 1000: (a)
 $Q_c = - 2.33\times 10^{-7}$ kg s
 $^{-1}$,
 $Ma = 1.1\times 10^{5}$,
 $7.0\times 10^{6}$,
 $1.57\times 10^{7}$; (b)
 $Q_c = - 2.33\times 10^{-8}$ kg s
 $^{-1}$,
 $Ma = 1.1\times 10^{4}$,
 $7.0\times 10^{5}$,
 $1.57\times 10^{6}$.

The velocity field on a vertical plane passing through the source for  $Sc = 447$. To improve clarity, the arrows near the origin (source) where the velocity is relatively large are not plotted, and the colour bar is in logarithmic scale. Positive source with
 $k = -0.5$,
 $Q_c = 2.33\times 10^{-7}$ kg s
 $^{-1}$ (
 $Ma=7.00\times 10^{-7}$).

The maximum value of  ${|\varTheta }_c|$ increases and the thickness of the boundary layer decreases with increasing Sc. Thus, the gradient of solute concentration at the surface increases with increasing
 $Sc$ which makes the liquid velocity near the surface larger and
 $\varTheta _{r}$ develops a boundary layer near the surface while
 $\varTheta _{\theta }$ remains small. Notice that the thickness of the solute concentration boundary layer is smaller than that of the velocity boundary layer. For both boundary layers the thickness is defined to be the distance from the surface at which the value becomes
 $1\,\%$ of the value at the surface. Also, due to the separable nature of the analytic solution, the thickness increases linearly with the distance from the source.
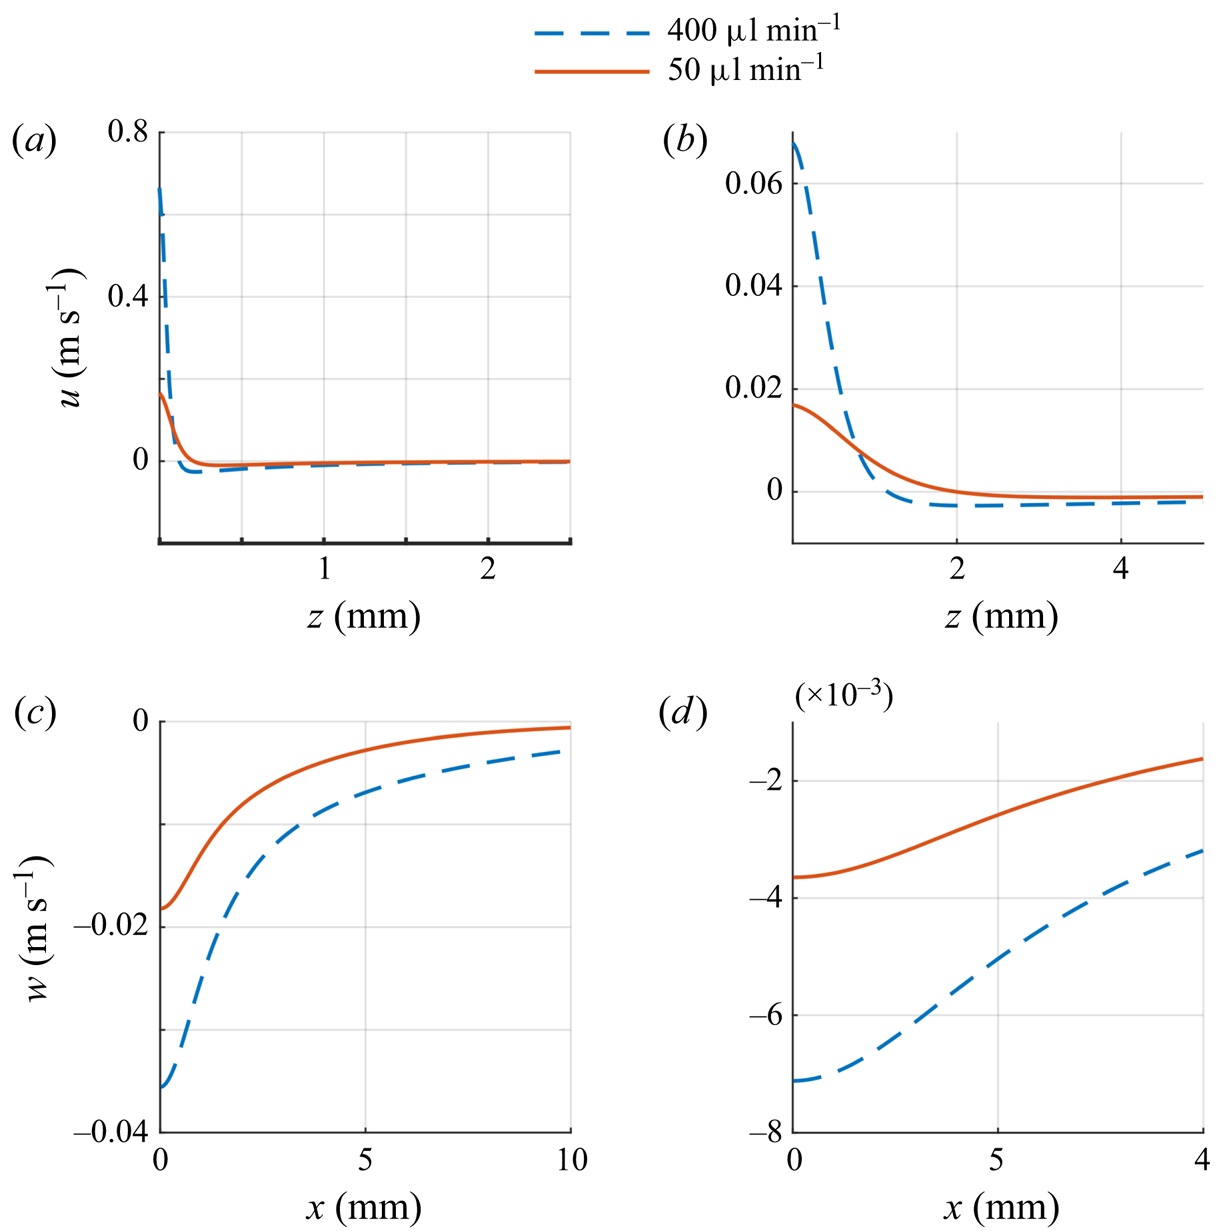
We next describe the velocity and solute concentration fields in the physical space. In figures 3(c) and 18 the velocity field is shown for a solute sink  $(Q_c<0$) and a solute source
 $(Q_c>0)$, and in figure 19 the velocity components are plotted for fixed
 $x$ or
 $z$ values. The solute concentrations are shown is figures 20 and 21. Figures 3(c) and 20(a) show that the outflow of solute (due to the solute sink) decreases the local solute concentration which decreases the surface tension near the sink giving rise to a flow on the surface away from the sink. This in turn causes a decrease in the solute concentration on and near the surface along the outflow direction. The opposite is true for a solute source (see figures 18 and 20b). The inflow of solute increases the local salt concentration and this in turn increases the local surface tension which drives a flow on the surface towards the source and below the surface away from the source. The flow away from the source convects liquid with higher solute concentration downwards.
The velocity as a function of  $x$ and
 $z$ and for two negative source strengths,
 $Q_c = -2.33\times 10^{-7}$ kg s
 $^{-1}$,
 $-2.91\times 10^{-8}$ kg s
 $^{-1}$ (
 $Ma = 7.0\times 10^6$,
 $8.75\times 10^5$) and
 $Sc = 447$. These values correspond to the freshwater flow rates of 50 and 400
 $\mathrm {\mu }$l min
 $^{-1}$, respectively, in our experiments; (a)
 $u$ as a function of
 $z$ for
 $x= 1$ mm, (b)
 $u$ as a function of
 $z$ for
 $x= 10.0$ mm, (c)
 $w$ as a function of
 $x$ for
 $z = 1$ mm and (d)
 $w$ as a function of
 $x$ for
 $z = 5$ mm.

Isovalues of solute concentration  $c$ on a vertical plane passing through the source for
 $Sc = 447$. (a) Negative source,
 $K = 1525.8$ and
 $Q_c = -2.33\times 10^{-7}$ kg s
 $^{-1}$ (
 $Ma = 7.0\times 10^7$). The solute concentration is reduced near the source and the flow on the surface is away from the source, and so the region of small
 $c$ emanates radially outward along the surface. (b) Positive source,
 $K = -0.5$ and
 $Q_c = 2.33 \times 10^{-7}$ kg s
 $^{-1}$
 $(Ma = 7.0\times 10^7)$. The solute concentration is larger near the source and the flow near the source is in the downward direction, and so the region of large
 $c$ emanates downward from the source.

Solute concentration (c) as a function of  $x$ and
 $z$ on a vertical plane passing through the source for
 $Sc = 447$. (a) For a negative source
 $(K =1525.8)$,
 $c$ is shown as a function of
 $z$ for fixed
 $x$-values;
 $Q_c = 2.33\times 10^{-7}$ kg s
 $^{-1}$ and
 $Ma = 7.0\times 10^7$. (b) Positive source,
 $K = -0.5$,
 $c$ is shown as a function of
 $x$ for fixed
 $z$-values.
 $Q_c = 2.33 \times 10^{-7}$ kg s
 $^{-1}$ and
 $Ma = 7.0\times 10^7$.

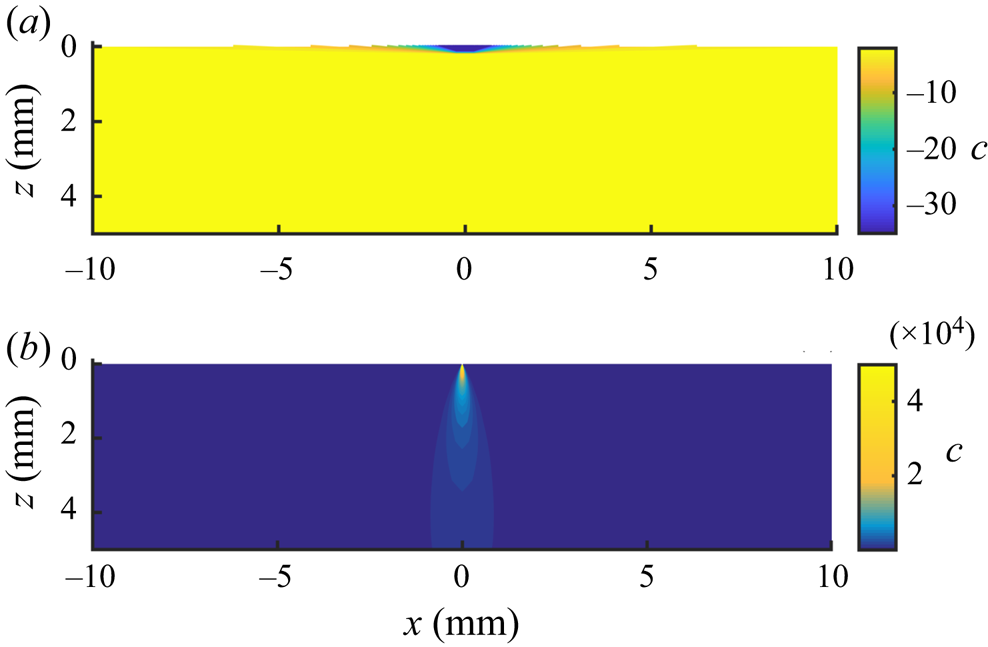
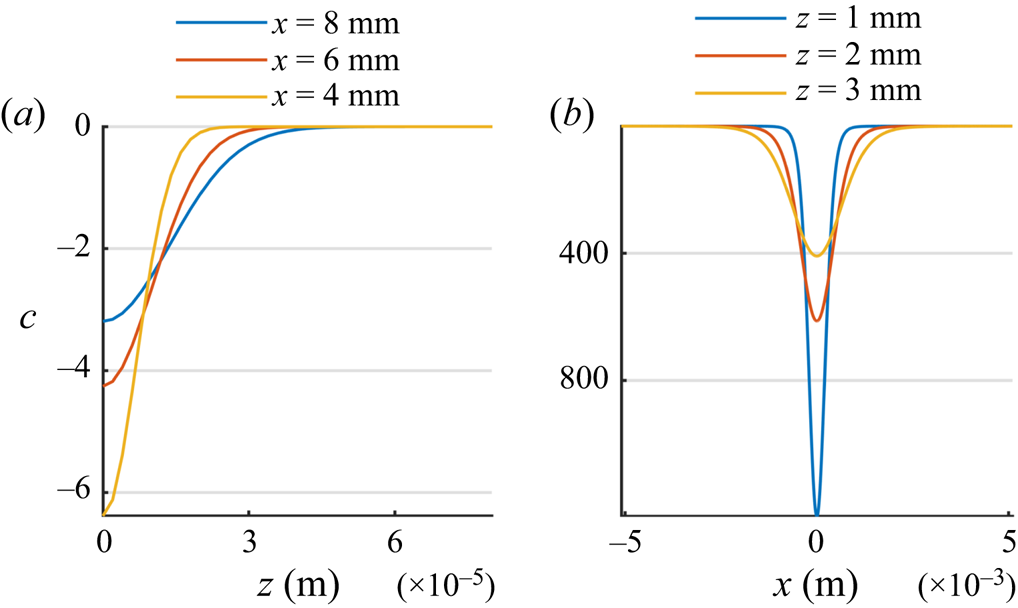
The solute transport is convection dominated, as can be seen from the solute iso-concentration levels of figure 20. Therefore, since for a negative source the solute concentration near the source is smaller and on the surface the liquid moves radially outward from the source, the liquid with low solute concentration is convected outward on the surface. This results in the formation of a solute concentration boundary layer, i.e. a thin layer in which the solute concentration varies sharply in the direction normal to the flow direction and is considerably depleted (figure 20). In figure 21, at a distance of 4 mm from a negative source, the solute boundary layer thickness is only a fraction of 1 mm. The thickness of the solute boundary layer increases with increasing distance from the source due to diffusion (see figure 21). This is also the case for the velocity boundary layer thickness which increases with increasing distance from the source (see figure 19). Also, as noted above, the thickness of velocity boundary layer is larger than that of the concentration boundary layer.
For a positive source, the solute concentration near the source is larger and the flow on the surface is towards the source and below the source it is away from the source and so the solute rich liquid near the source is convected downward resulting in the iso-concentration levels as shown in figure 20(b). This results in a boundary layer below the source, in the outflow direction, where the velocity is larger. Furthermore, as figure 19 shows, when  $|Q_c|$ is increased, the magnitude of velocity increases and the thickness of the velocity boundary layer decreases as the relative importance of convection increases.