


Introduction
The East Antarctic ice sheet appears as a stable and dominant feature on Earth at least for the last few million years. Three-dimensional model experiments (Reference HuybrechtsHuybrechts, 1993) demonstrated that a large temperature rise (>15K) is necessary to reduce the ice sheet significantly The ability of the East Antarctic ice sheet to resist a much larger warming than its West Antarctic counterpart is partly due to the presence of several mountain systems, enabling the ice sheet to retreat to a higher, hence colder, elevation when a significant warming occurs (Reference HuybrechtsHuybrechts, 1993). The three major systems are the Transantarctic Mountains, the Gamburtsev subglacial mountains in the central part of the East Antarctic craton and a semi-continuous belt of coastal mountains in Dronning Maud Land stretching from Heimefrontfjella in the west (15°W) to the Yamato Mountains in the east (35°E). These mountain systems are separated by large subglacial depressions, such as the Pensacola, Wilkes and Aurora subglacial basins between the Transantarctic and Gamburtsev Mountains, and Lambert Glacier between Gamburtsev subglacial mountains and Enderby Land. Within the Dronning Maud Land coastal mountain chain some transverse gaps are noticed, such asjutulstraumen in the west and Shirase Glacier in the east, which together with Lambert Glacier form the most prominent continental ice streams of East Antarctica.
The alternation of marginal mountain glacier systems and fast-flowing continental ice streams implies a local differentiation in ice-sheet behaviour as a reaction to changing climate, which is confirmed by observations. Stake measurements in the Shirase drainage basin, Dronning Maud Land (Reference Nishio, Mae, Ohmae, Takahashi, Nakawo and KawadaNishio and others, 1989; Reference Toh, Shibuya, Yoshida, Kaminuma and ShiraishiToh and Shibuya, 1992), show a marked thinning rate of the ice sheet of >1m a−1. However, in the nearby Sor Rondane Mountains, Reference Moriwaki, Hirakawa, Hayashi, Iwata, Yoshida, Kaminuma and ShiraishiMonwaki and others (1992) found that the maximum ice surface attained over the last 100 000 years was only a few meters higher than the present surface, whereby the authors concluded that only minor glacier fluctuations occurred over this period (in the order of a few meters to a few tens of meters). The first observation points to a dynamical ice sheet, while the second observation, made in a neighbouring area 500 km to the west, corroborates the idea of a very stable ice sheet. Also a different pattern in ice-sheet behaviour is observed between the coastal area and the inland ice sheet. While near the coast the Last Glacial Maximum (LGM) ice sheet is generally believed to be thicker, it is presumed to be thinner for central parts of Antarctica (Reference Lorius, Raynaud, Petit, Jouzel and MerlivatLorius and others, 1984; Reference JouzelJouzel and others, 1989).
In order to interpret the variety of observations with respect to present and past ice-sheet dynamics, Reference PattynPattyn (1996) proposed a numerical model experiment that could explain the present dynamics of fast-flowing glaciers. Reference Pattyn and DecleirPattyn and Decleir (1998) presented an experimental framework to determine past glacier variations in a marginal mountain range in a consistent way by linking the climatic signal to the proxy record of glacial-geological observations through numerical ice-sheet modelling. In this paper, the results of both studies will be further analyzed. More details on the numerical model itself can be found in those two papers.
Experimental Set-Up
The numerical model is a time-dependent flowline model that predicts the ice-thickness distribution along a fixed flow-line in responseto environmental conditions, according to

where
 is the depth-averaged horizontal velocity, H is the ice thickness and M and S are the surface mass balance and basal melting, respectively. The ice-sheet response ∂H/∂t is obtained by calculating at a given moment the two-dimensional flow regime (velocity, strain rates and stress fields) and the temperature distribution, determined by the ice-sheet geometry and boundary conditions, on a numericalgrid using finite differences. The main boundary conditions to the ice-flow field are the mass-balance distribution at the surface, and basal motion at the bottom of an ice shelf at the outer edge. The temperature field is conditioned by surface temperature at the top and geothermal heat flux at the bottom. Additional sub-models entering as boundary conditions to the main system are also considered, i.e. isostatic adjustment and heat conduction in the bedrock.
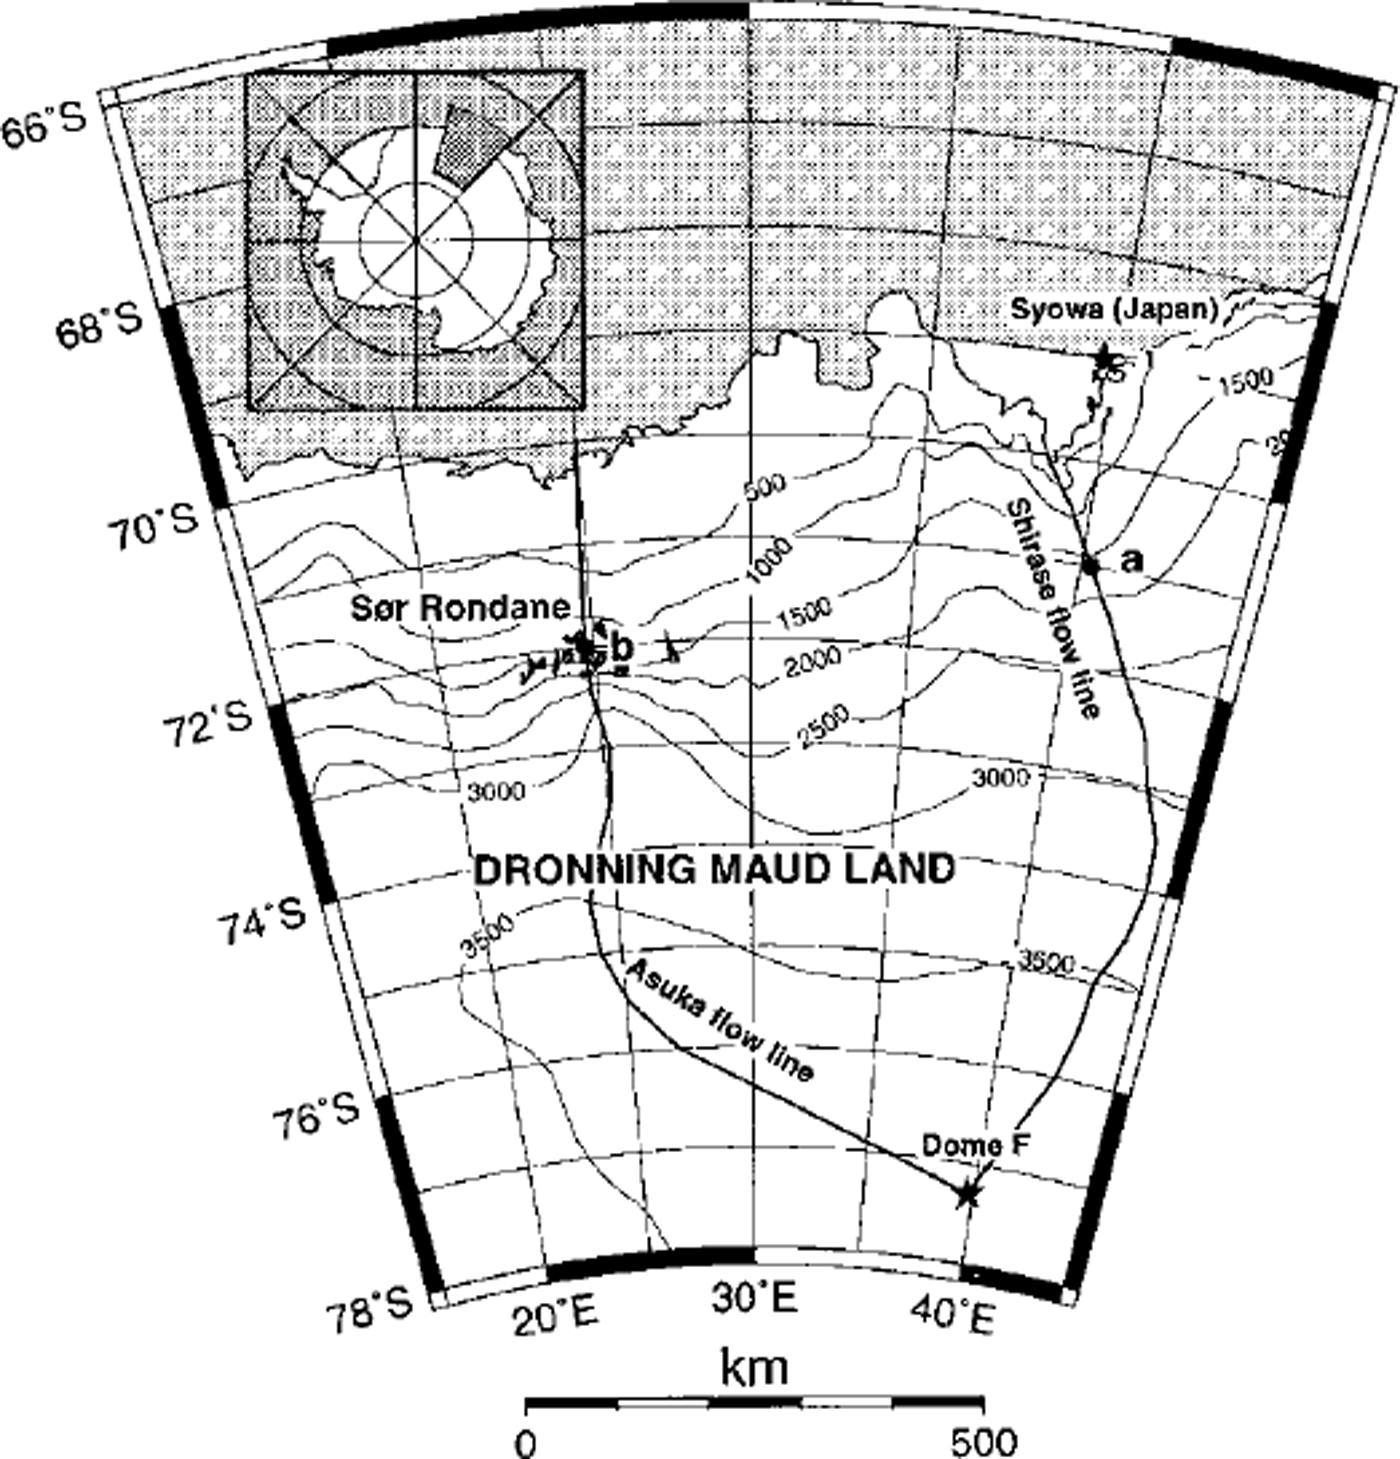
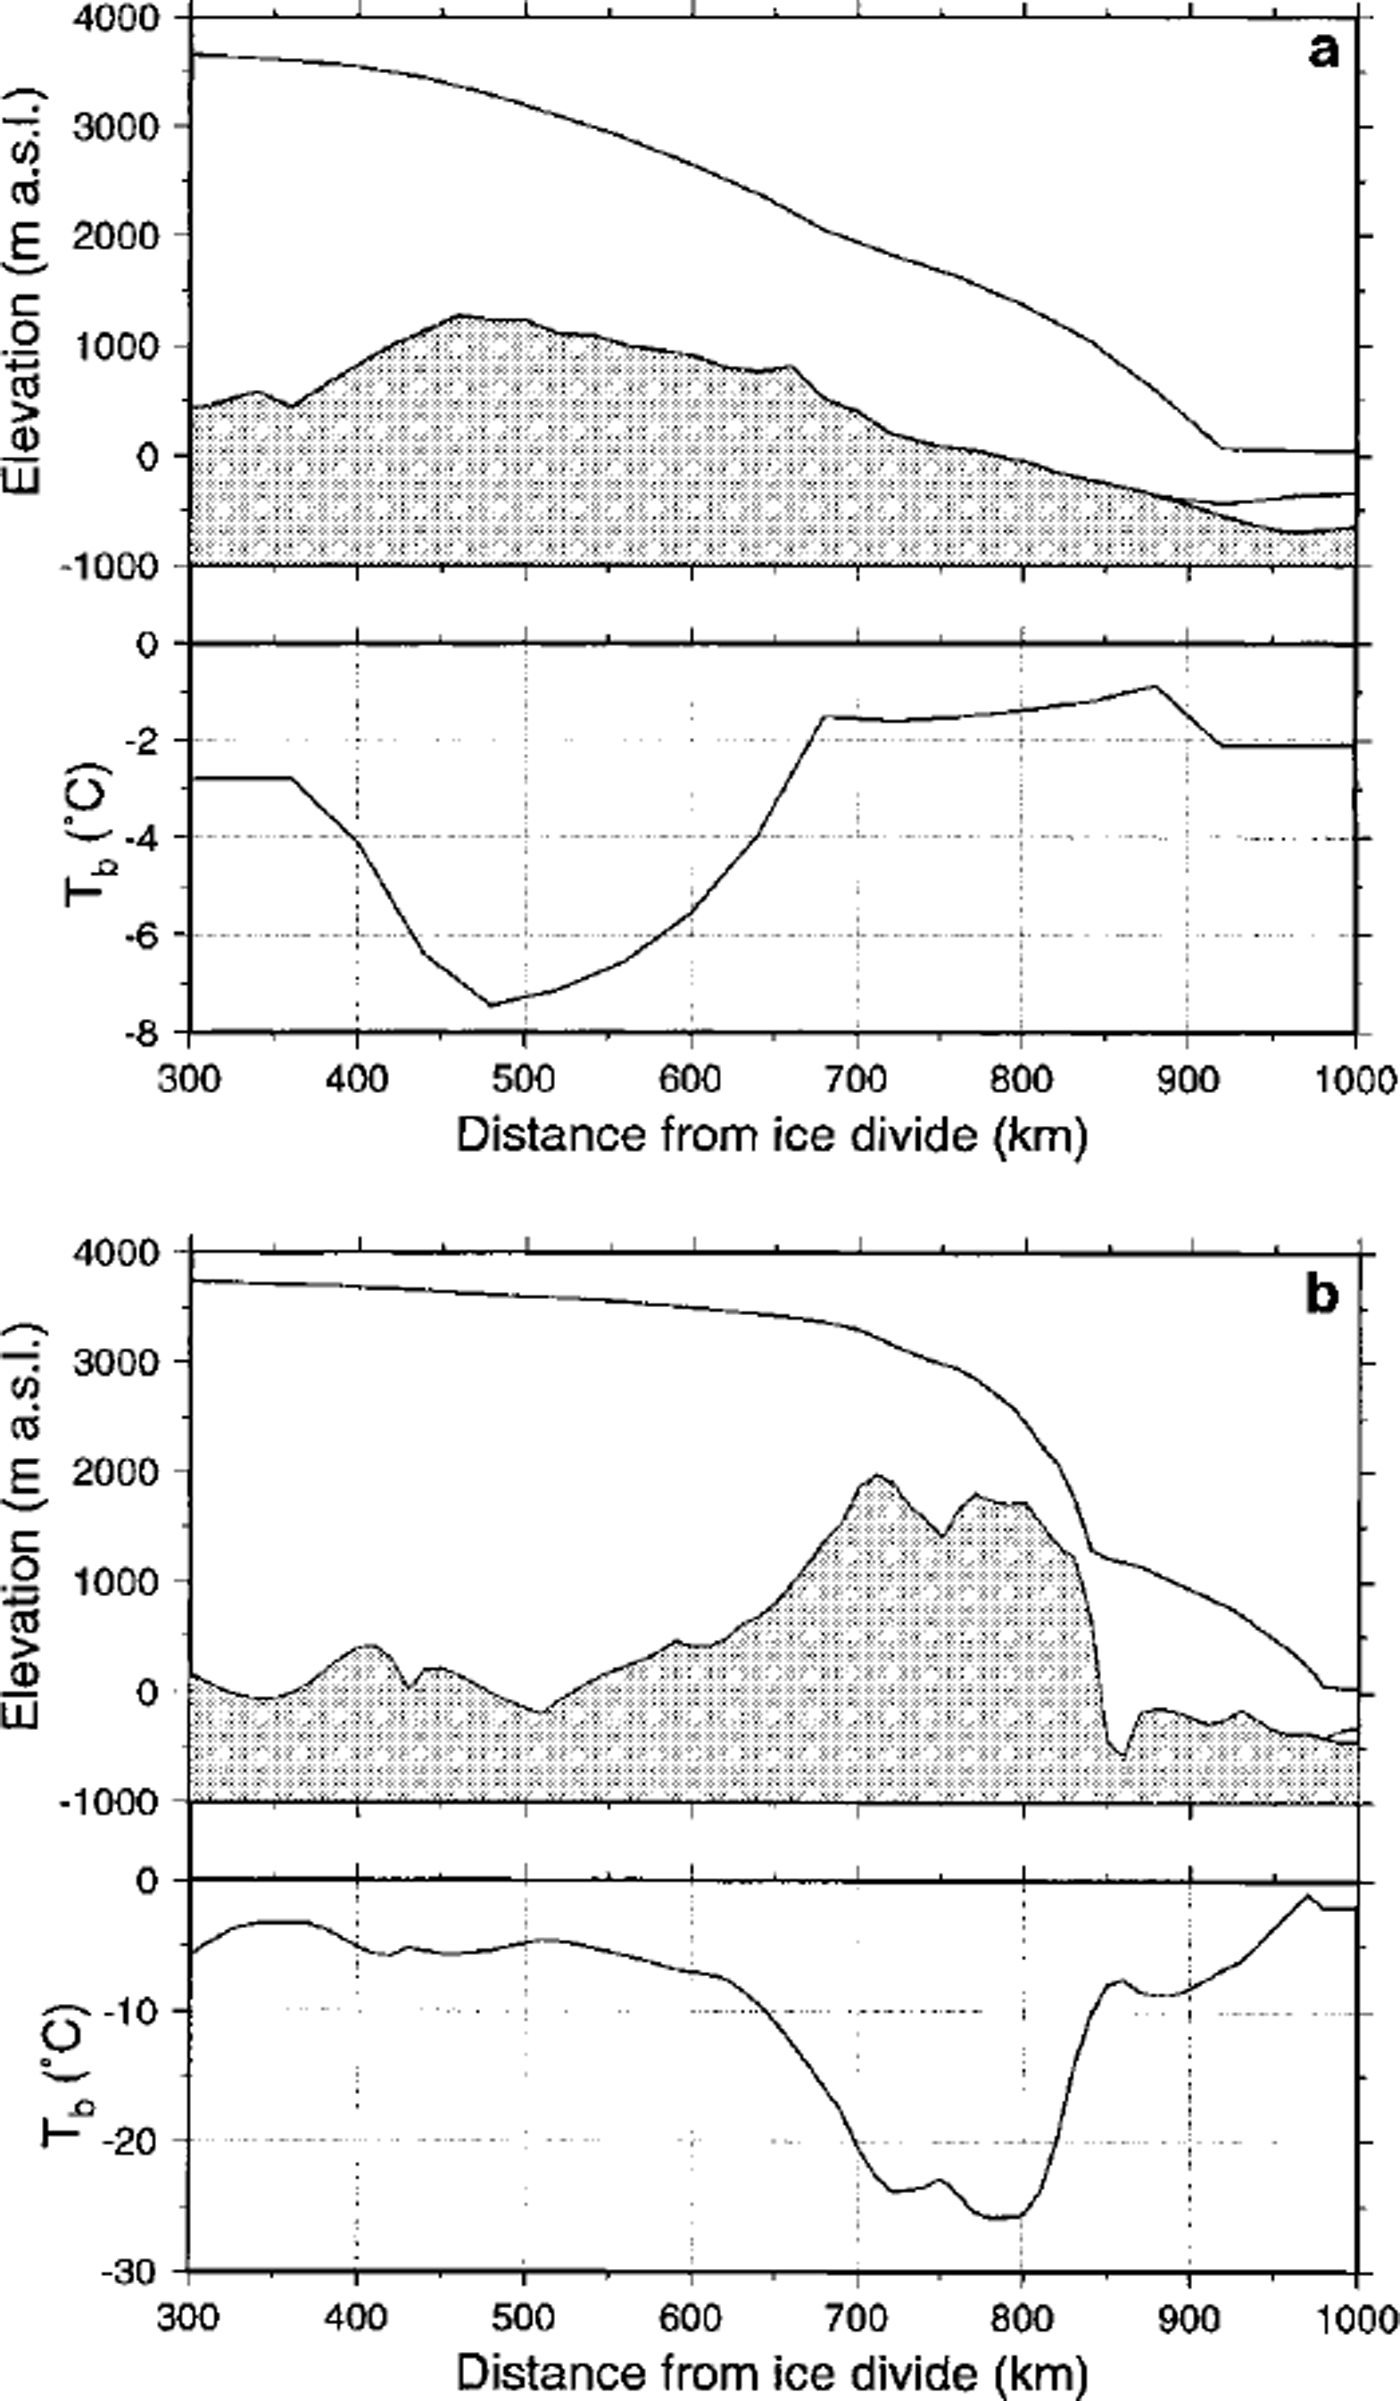
In this study, numerical flowline modelling experiments were carried out along two flowlines in Dronning Maud Land (Fig. 1), i.e. one along a major ice stream (Shirase drainage basin: Shirase flowline, Fig. 2a), and the other through the central part of a coastal mountain range (Sør Rondane Mountains: Asuka flowline, Fig. 2b). Both start at the Dome Fuji ice divide and reach beyond the edge of the continental plateau in the Southern Ocean.
Situation map of Dronning Maud Land with the two modelled flowlines.
Present modelled longitudinal profiles of the Shirase flowline (a) and the Asuka flowline (b) after 200 ka of forward integration. Lower panels display the corresponding basal temperature profiles.
Each model experiment is a twofold process. First, a steady-state ice sheet at 200 ka BP is established starting from an ice-free bedrock topography isostatically adjusted to the removal of the present ice load, under climatic conditions taken as the mean of the last 200 ka, i.e. a background temperature of-5.2 K compared to the present. Second, the model is run forward in time, forced by the Vostok signal (Reference JouzelJouzel and others, 1993). Changes in surface temperature also affect accumulation rates, according to Reference LoriusLorius and others (1985):

where M is the surface accumulation rate (ma−1), T0 = 273.15 K, and Tf(t) = 0.67Ts(t)+ 88.9, the temperature above the inversion layer (Reference Jouzel and MerlivatJouzel and Merlivat, 1984), where Ts(t) is the surface temperature. This means that changes in surface accumulation rate exactly follow changes in background temperature. Thus, for each gridpoint along the flowline a local time series according to Equation (2) and a local ice-sheet response time series according to Equation (1) of vertical ice-surface changes over the last 200 ka is obtained.
The Shirase Flowline Experiments
Previous modelling experiments on Shirase Glacier (Reference Pattyn and DecleirPattyn and Decleir, 1995) showed that the large observed thinning rate could not be explained as a reaction to the climate signal alone. Another mechanism must account for this. A new model formulation, taking into account the physical properties of ice streams, i.e. longitudinal stresses in the force budget and different basal motion models (Reference PattynPattyn, 1996), revealed different patterns of cyclic behaviour in ice streams depending on the basal boundary conditions. In this study, similar experiments are repeated, this time applied to the Shirase flowline. Basal motion was treated by considering a water film underneath the ice sheet, as radio-echo sounding measurements (Reference Nishio and UratsukaNishio and Uratsuka, 1991) demonstrated that subglacial water is omnipresent in the downstream area of the Shirase drainage basin. According to Reference Weertman and BirchfieldWeertman and Birchfield (1982), the sliding velocity is dependent on the depth of the water layer 6 and the critical particle size ´c:
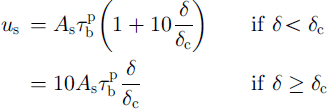
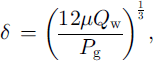
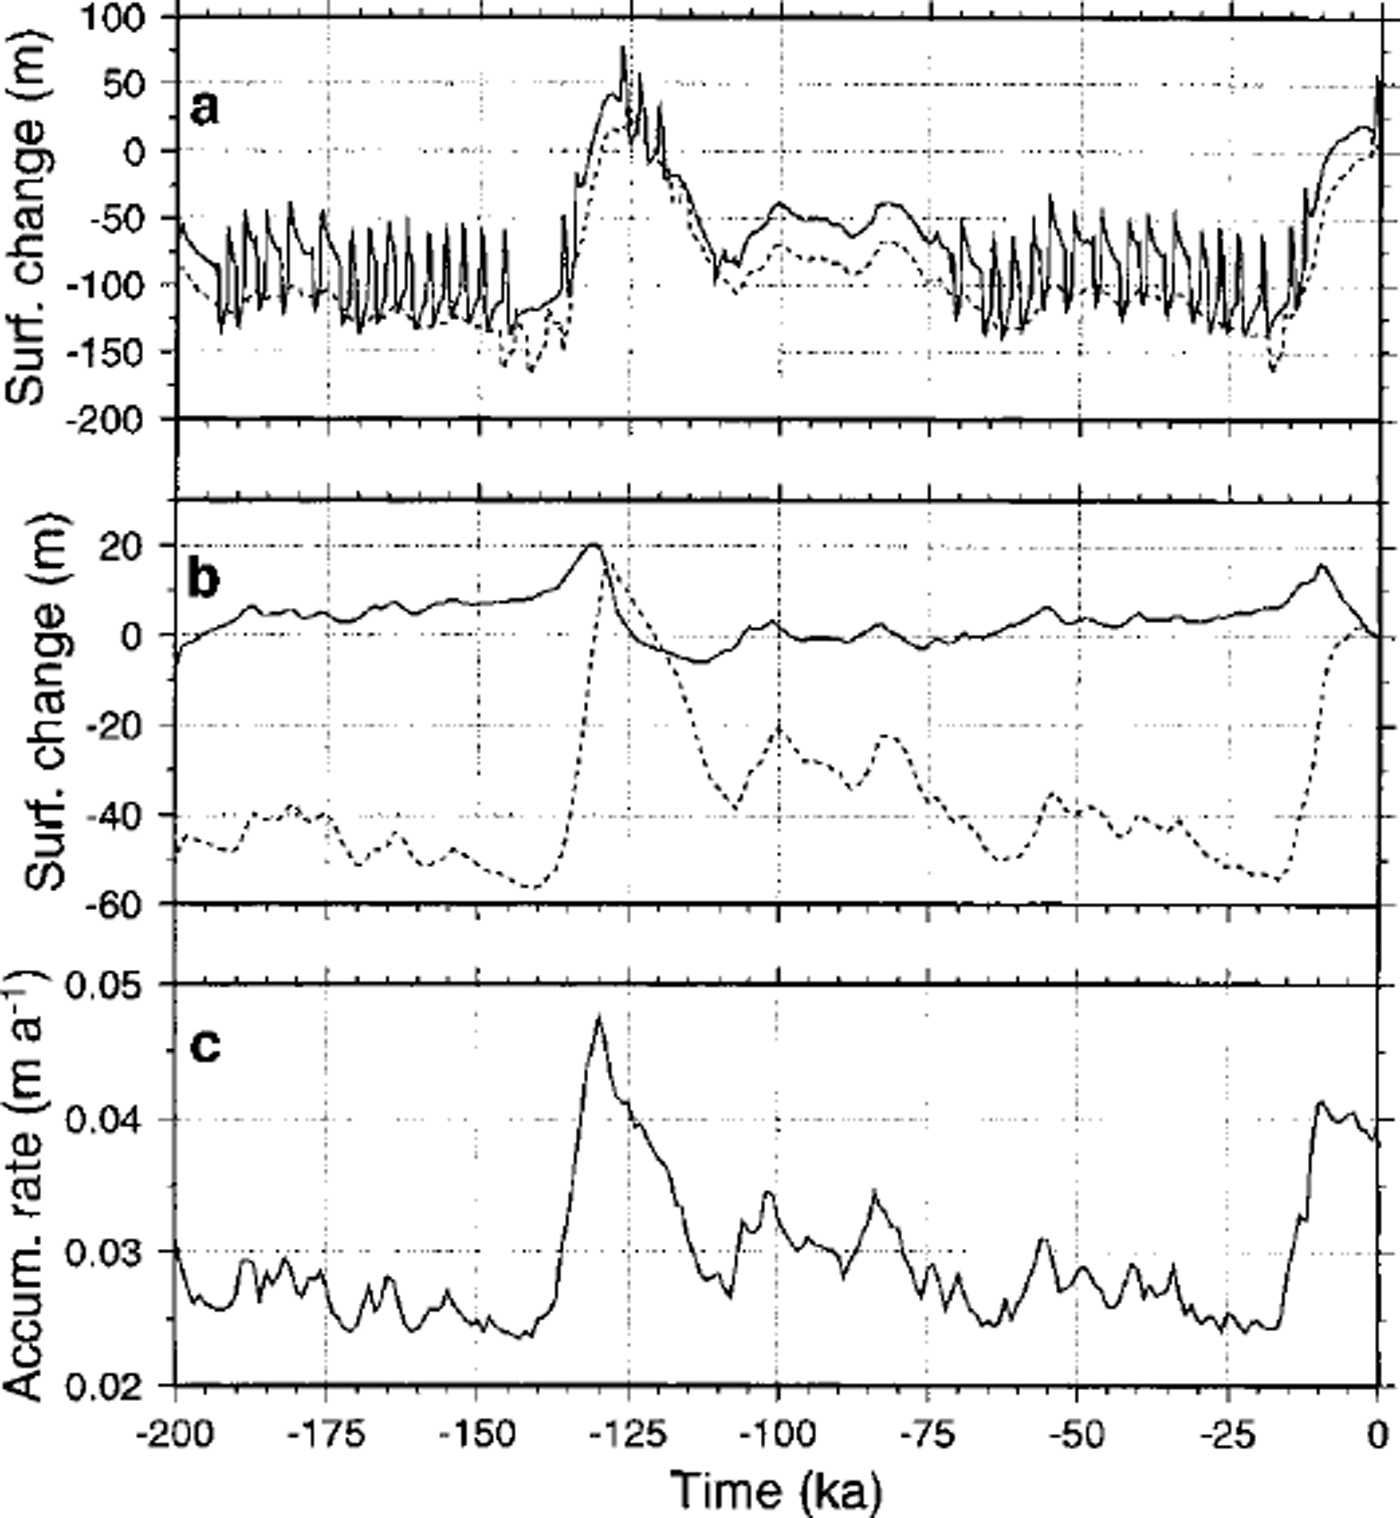
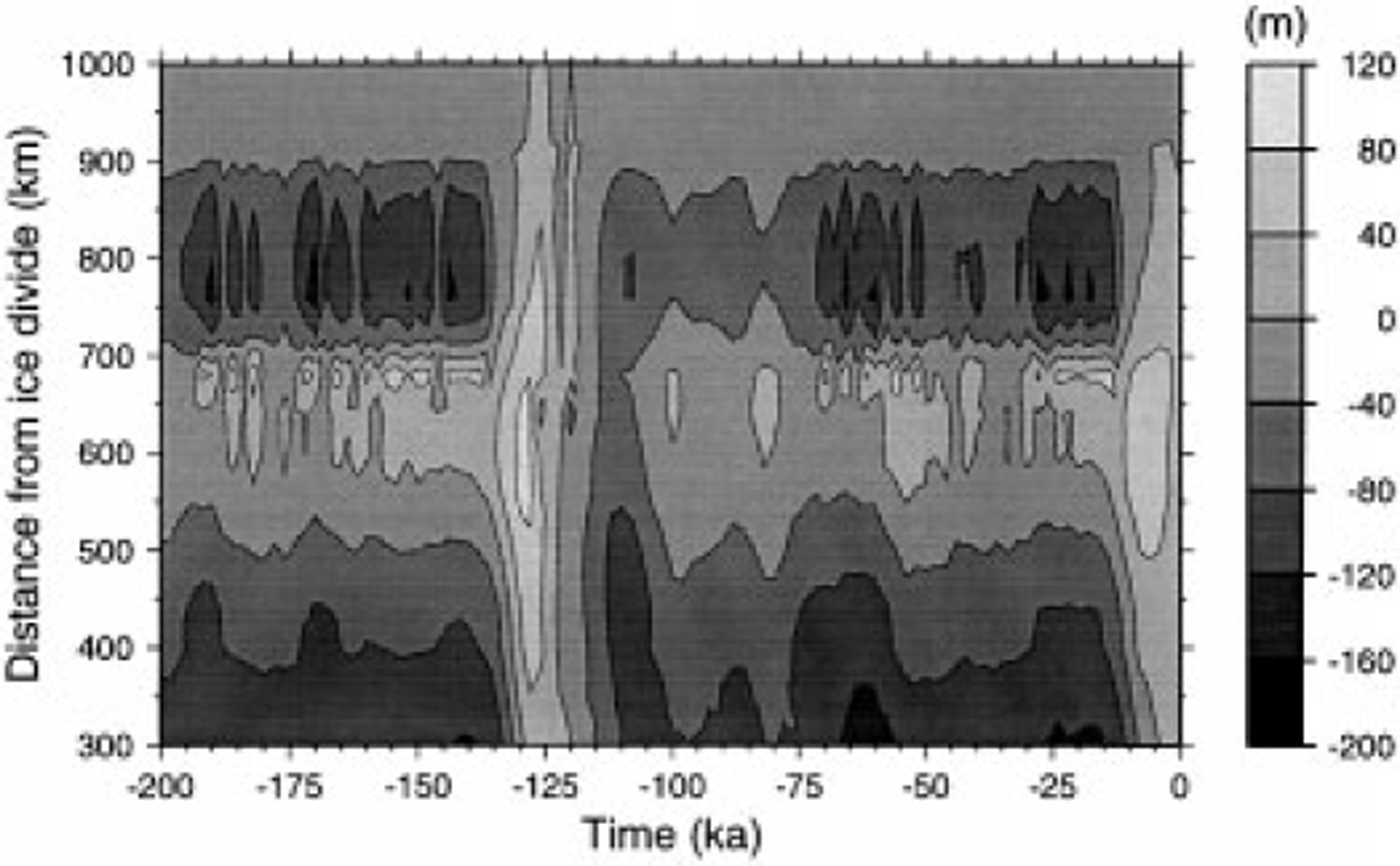
where Qw is the water flux per unit width (m2s–1), calculated through downstream integration of the basal melting rate, Pg is the pressure gradient (Reference AlleyAlley, 1989), As is a shding-law constant (taken as 2.0 × 10⁻¹¹ Pa-2 m–1 a−1) and τb is the shear stress at the base of the ice sheet. Two model experiments were carried out, both over a period of 200 ka forced by the Vostok signal. The first model run (TYPE I) was based on the sliding law of Equation (3), the second (TYPE II) on a Weertman sliding law which is independent of the presence of subglacial water and is widely used in numerical ice-sheet modelling (Fig. 3). According to the TYPE I experiment, high-frequency oscillations occur during the coldest phase of the glacial periods and during the warmest phase of the interglacials. As explained in Reference PattynPattyn (1996), they are due to the interaction of the ice-sheet temperature field and the conditions at the base: basal motion causes the ice sheet to move more rapidly, increasing horizontal and vertical advection rates. Gold ice is thus advected towards the bottom, reducing the total surface subjected to melting. Basal velocities decrease, stabilising the ice-sheet motion. The whole process gives rise to a cyclic behaviour; the slower ice sheet tends to grow, advection rates decrease and bottom melting increases, resulting in large basal velocities. The periodicity of these cycles is approximately 3000-4000 years. High-frequency oscillations are observed only in the downstream area of Shirase Glacier, and disappear gradually towards the inland plateau (Fig. 4).
(a) Tine series of TYPE I (solid line) and TYPE II (dotted line) experiments along the Shirase flowline at grid-point a; (b) time series of T-COUPLING (solid line) and ISOTHERM (dotted line) experiments along the Asuka flowline at gridpoint b; ( c) time series of surface accumulation rate at gridpoint b (see Fig lfor situation of points a and b along bothflowlines).
Time-space map of vertical surface variations (compared to present) along the Shirase flowline for the TYPE I experiment.
Reference PaynePayne (1995) showed a similar cyclic behaviour with a thermomechanical ice-sheet model, including a basal sliding mechanism according to TYPE II. His model produced limit cycles that are caused by on-and-off switching of sliding as basal ice reaches the pressure-melting point. Our TYPE II experiments do not show any cyclic behaviour for a sliding law in which the effect of basal water is not explicitly included, due to a lower tuning value compared to the sliding law of Reference PaynePayne (1995) and the fact that sliding is also possible when basal temperatures are lower than the pressure-melting point, thus avoiding abrupt on-and-off switching between shding/no-shding conditions.
The TYPE I experiments show that there is no need for a massive drainage in the coastal area of Shirase Glacier to explain the large thinning rate observed in the field; the high frequency of the oscillations accounts for this, while the ice sheet remains stable. Any runaway of ice is counteracted by the thermomechanical process described above. A marine instability is unlikely to occur since most of the bedrock lies above sea level.
The Asuka Flowline Experiments
Using an experimental framework, Reference Pattyn and DecleirPattyn and Decleir (1998) carried out a large number of model experiments each with different settings of boundary conditions. The results were then compared with glacial-geological evidence and field measurements such as ice velocities and ice thickness. Experiments in agreement with these observations could be divided into two major groups or scenarios. The first scenario (T-COUPLING) is the so-called standard model experiment, i.e. with full thermomechanical coupling (ice stiffness depends on local ice temperature), while for the second scenario (ISOTHERM) a constant flow parameter for the whole ice sheet is used, i.e. independent of the ice-temperature distribution (constant ice stiffness). Although the response time series of both scenarios are similar along the flowline, a marked discrepancy is observed in the mountain area (Fig. 3). One interpretation (T-COUPLING) is that only minor glacier variations have occurred during the last 200 ka, as was concluded by Reference Moriwaki, Hirakawa, Hayashi, Iwata, Yoshida, Kaminuma and ShiraishiMoriwaki and others (1992) based on glacial-geological evidence, and the present glacier surface is close to its minimum, while the other interpretation (ISOTHERM) is that glacier variations are of the order of 60 m, but that the present glacier surface is close to its maximum elevation of the last 200 ka. Outside the Sor Rondane (not shown), on the polar plateau, as well as in the coastal area, both scenarios are in accord and ice-sheet surface variations are of the order of 60-80 m. The main difference between the inland area and the coast is that near the ice divide the ice sheet seems at present close to its maximum position, while in the coastal area deglaciation is completed and the ice-sheet surface seems close to its minimum.
Analysis of Time Series
The model ice sheet reacts to the climatic signal according to Equation (1), where the rate of change of the ice sheet ∂H/∂t is a function of changes in the surface mass balance (through M(x, t)) and a function of changes in ice temperature (that influence the velocity field and hence the flux-divergence term in Equation (1)). The complexity and nonlinear nature of this relation cause H(x,t) to differ from the climatic record that enters the model as M(x,t) and Ts(x, t). One way to investigate the response of the ice sheet to changes in climate is to compare the time series of H(x, t) and M(x, t) in both time and spectral domain.
Lag-correlation analysis
The reaction time of the ice sheet to the climatic signal can be expressed by the time lag. The correlation between the forcing time series (surface accumulation rate at a given gridpoint M(x, t)) and the response time series (ice-surface variations at that gridpoint H(x, t)) was calculated for different lags using the fast Fourier transform (Reference Press, Teukolsky, Vetterling and FlanneryPress and others, 1992). The lag corresponding to the maximum correlation then gives the time lag between both time series (Fig. 5a). For all model experiments, the time lag is positive for the interior ice sheet and gradually decreases towards the coast, meaning that a maximum ice-surface elevation is reached 2-5 ka after the maximum of the accumulation-rate signal. However, the T-COUPLING experiment shows a large negative time lag clearly associated with the presence of the mountain range. The ISOTHERM experiment does not show this discrepancy, so the negative time lag is probably due to differences in ice stiffness along the flowline, as basal temperatures are low in the mountain area and increase rapidly northward of the icefall (Fig. 2b). This feature is also present in the graph of the maximum correlation that corresponds to the time lag (Fig. 5b), implying that in areas characterised by a negative time lag, the shape of the response signal might differ slightly from the input signal as correlation coefficients are rather low.
Time lag between the input and response time series (a), maximum correlation coefficient corresponding to the time lag between the input and response time series (b), and range (difference between maximum and minimum) of the vertical ice-surface variations (c) at each gridpoint along the flowline for the four experiments, i.e. TYPE I (open circle) and TYPE II (filled circle) along the Shirase flow line; T-COUPLING (open triangle) and ISOTHERM (filled triangle) along theAsuka flowline.
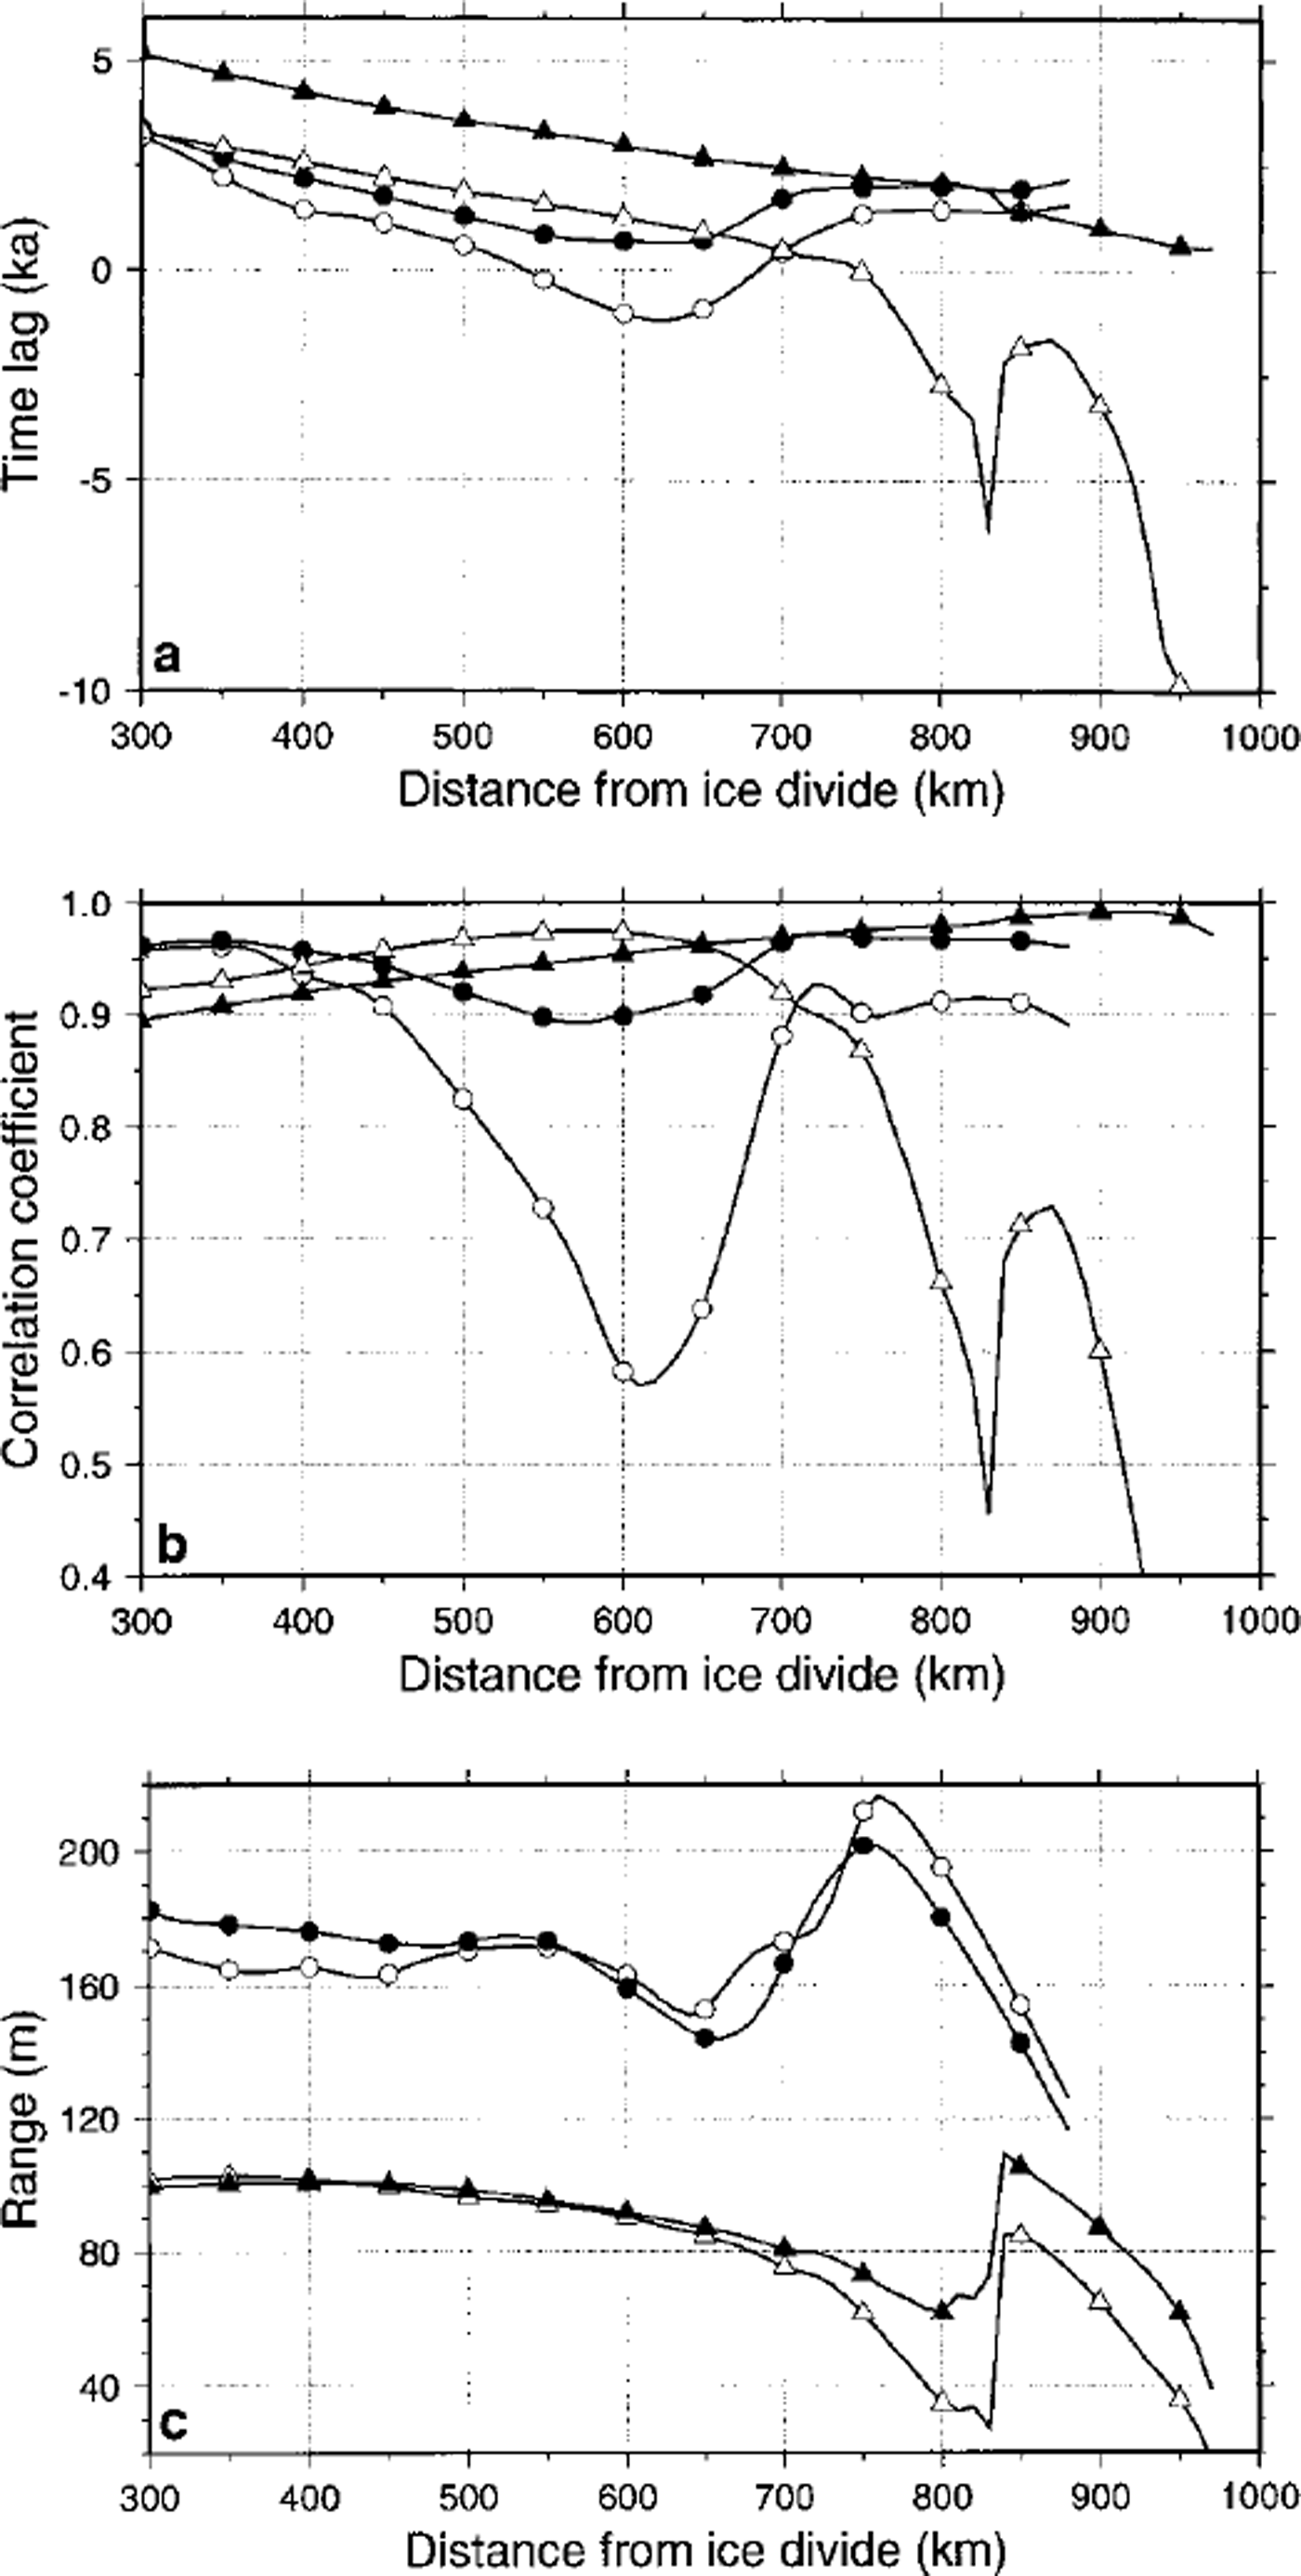
A slight negative time lag is also observed for the TYPE I experiment along the Shirase flowline. Although a damming mountain range is not present in this area, a subglacial continuation of the mountain chain can be observed 400-600 km from the ice divide, associated with a similar pattern in the basal temperature profile (Fig. 2a).
Range analysis
The amplitude of the response time series, i.e. the range of vertical surface variations at each gridpoint, is taken as the difference between the maximum and the minimum of the series (Fig. 5c). Generally, the range of ice-surface variations along the Shirase flowline is higher (150-200 m) than for the Asuka experiments (40-100 m). Since ice thicknesses in the inland part are comparable for both flowlines, the difference may be due to a lower accumulation rate in the Asuka drainage basin. Furthermore, ice motion is much faster in the Shirase drainage basin. Again, all four curves in Figure 5c display a marked jump associated with the presence of the (subglacial) mountain range. The lowest amplitude is encountered in the mountain area for the T-COUPLING experiment, which corresponds to the time series of Figure 3.
Fractal analysis
Long-term climatic series are considered to be self-affine (non-isotropic) fractals (Reference Fluegelman and SnowFluegelman and Snow, 1989; Reference TurcotteTurcotte, 1992), characterised by a fractal dimension lying between 1.0 and 1.5. A fractal analysis of the oxygen-isotope record of Pacific coreV28-293 revealed a fractal dimension of 1.22, meaning that such time series show persistence through time (Reference Fluegelman and SnowFluegelman and Snow, 1989). The aim of this study is to use a fractal analysis, or an analysis of variance on different time-scales, to interpret the difference in response patterns along the two flowlines. A common technique is the rescaled range analysis (RSA; Reference FederFeder, 1987) that was applied to the time series of local imbalance ξ(t) = ∂H/∂t. The rescaled range R/S is the ratio of the range R, i.e. the difference between the maximum and minimum of cumulated values of ξ at time t over a timespan τ, and the standard deviation S estimated from the observed values ξ(t):
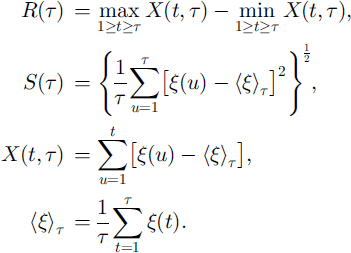
The rescaled range is shown to have a power-law dependence on time-span τ (Reference FederFeder, 1987)

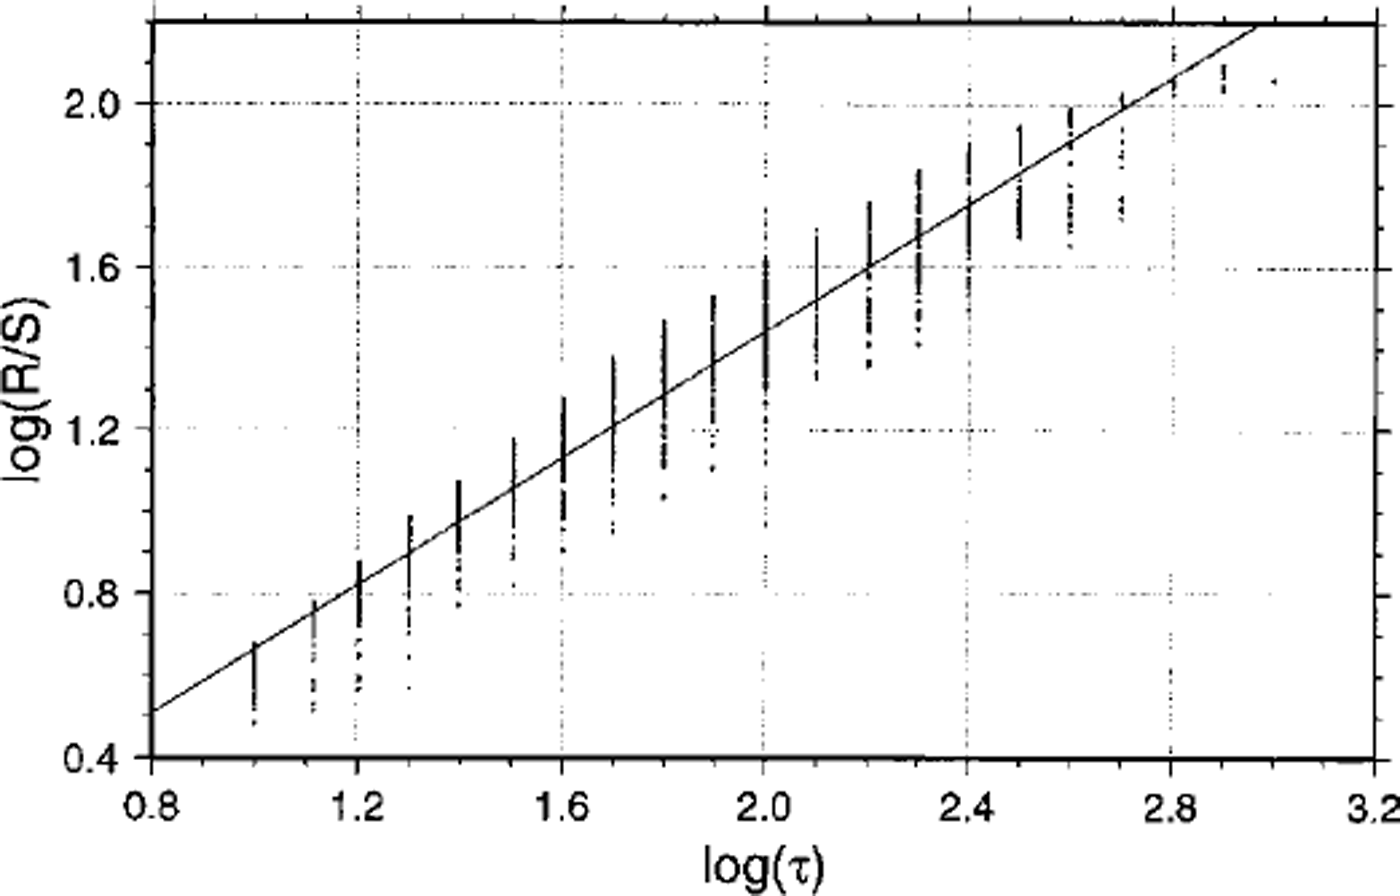
where H is the Hurst exponent. If H is >0.5 and <1.0, it is related to the fractal dimension by DH = 2–H (Reference Fluegelman and SnowFluegelman and Snow, 1989). For each response time series along the flow-line, DH was determined from a linear least-squares fit of log(R/S) vs log(r) (Figs 6 and 7). For the Asuka flowline experiments DH lies between 1.1 and 1.3, gradually increasing towards the coast. A small bump is observed near the mountain area for the T-COUPLING as well as for the ISOTHERM experiment, although the DH of the latter is lower over the whole flowline. A much higher fractal dimension is observed for the TYPE I experiment associated with the occurrence of the high-frequency oscillations, which is not shown in the TYPE II experiment. The sharp vertical jump in this DH curve around 600 km from the ice divide (Fig. 7) marks the limit of the influence area of these oscillations.
Plot of log (R/S) vs log (r) for the time series according to the T-COUPLING experiment of the Asuka flowline at gridpoint b. The slope of the fitted line H = 0.78, representing a fractal dimension of DH = 122.
Fractal dimension determined by rescaled range analysis of the variation of local imbalance at each gridpoint along the flowline for the four experiments (see Fig 5 caption). The dotted line shows the fractal dimension of the input signal (∂M/∂t) which is constant along the flowline.
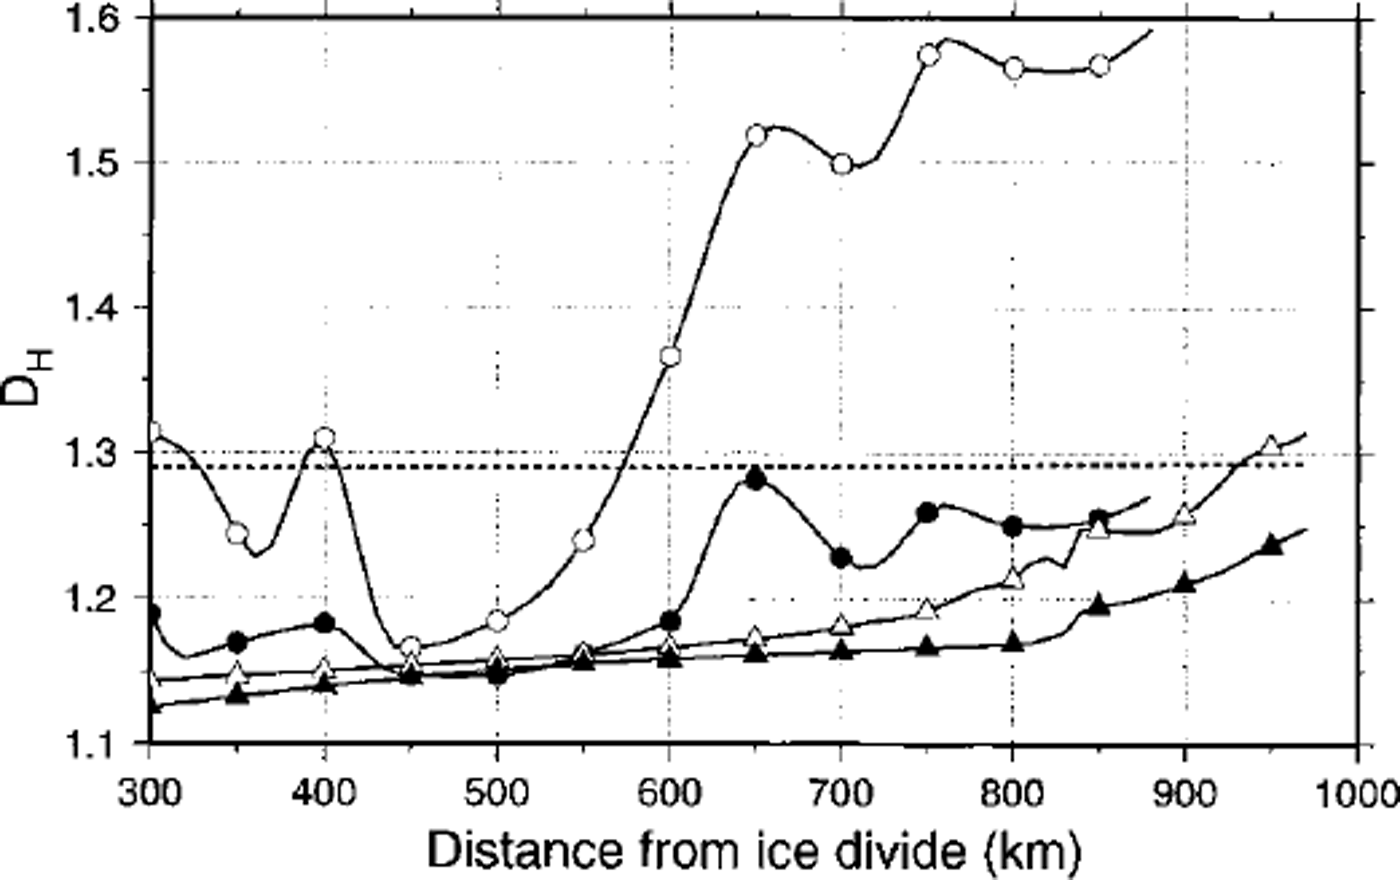
The variance on different time-spans of the response signal increases towards the coast, but is hardly influenced by the presence of subglacial mountains or the contrast in stiffer/softer ice. Different response patterns in terms of high-frequency oscillations account for a high fractal dimension. With the exception of the TYPE I experiment, the fractal dimension of the response series is lower than the DH of the input signal (taken as ξ = ∂M/∂t). This means that the response signals are smoother and that small-scale climatic variations have less effect on the ice-sheet response.
Discussion and Conclusions
Numerical ice-sheet model experiments were capable of simulating different response patterns of the East Antarctic ice sheet to the climatic signal as observed in the field, i.e. the large thinning rate in the Shirase drainage basin and the small glacier variations that, according to glacial-geological evidence, occurred over the last 200 ka in the nearby Sor Rondane Mountains, Dronning Maud Land. Whether the high-frequency oscillations, as a result of the interaction between the ice-sheet thermodynamics and basal sliding, are a dynamic process that really occurs in the Shirase drainage basin has never been proven due to the lack of field evidence. However, similar mechanisms are capable of explaining the dynamics of the Siple Coast ice streams, i.e. a switching between fast and slow ice-stream flow (Reference PaynePayne, 1998).
All of the above-described time-series analyses, i.e. lag correlation, range and fractal analysis, demonstrate that the presence of a coastal mountain range strongly influences the response of the ice sheet to the climatic signal, not only in places where the ice is clearly dammed (e.g. Sor Rondane), but also where a subglacial continuation of this mountain chain is visible (Shirase Glacier). In the first case (Asuka flowline), the damming effect is observed in the marked con-cavity in the ice-surface topography forming an icefall (Fig. 2b, upper panel) and the reduced surface velocities at the bottom of the icefall (compressed flow), while in the latter case (Shirase flowline) none of these are observed. The lag-correlation analysis reveals something more: in the Asuka flowline experiments, the time-lagged response of the ice sheet is positive along the whole flowline when an isotherm ice sheet is considered (ISOTHERM). However, a marked differentiation is observed when full thermomechamcal coupling is considered (T-COUPLING). Since most of the ice deformation is concentrated in the lower (basal) layers of the ice sheet, basal temperature controls to a large extent the flow characteristics of the ice sheet. For both flowlines, cold basal temperatures are found in the presence of subglacial mountains (Fig. 2a and b, lower panels), where a small ice thickness and a high surface elevation imply a faster advection of cold ice towards the base of the ice sheet.
While both lag-correlation and range analysis clearly show an aberrant ice-sheet behaviour related to the presence of subglacial mountains, the fractal analysis explains only the effect of coastal high-frequency oscillations caused by basal sliding. The fractal dimension of the ice-sheet response is lower than the dimension of the input signal, but increases towards the coast, so the ice-sheet response is smoother in the interior than in the coastal area.
Acknowledgements
This paper is a contribution to the Belgian Research Programme on the Antarctic (Federal Office for Scientific, Technical and Cultural Affairs), contract A4/DD/E03. I thank G. S. Boulton and R. Greve for reviewing this paper.



