Introduction
Magnetic resonance imaging (MRI) studies have identified structural brain alterations associated with depression. Several reviews and meta-analyses summarizing these studies have reported a reduced hippocampal volume (HcV) in depressed patients (Campbell et al. Reference Campbell, Marriott, Nahmias and MacQueen2004; Videbech & Ravnkilde, Reference Zhang, Qiu, Lindberg, Bronge, Aspelin, Backman, Fratiglioni and Wahlund2004; Koolschijn et al. Reference Koolschijn, van Haren, Lensvelt-Mulders, Pol and Kahn2009; Lorenzetti et al. Reference Lorenzetti, Allen, Fornito and Yucel2009; Kempton et al. Reference Kempton, Salvador, Munafo, Geddes, Simmons, Frangou and Williams2011). However, the direction of this association remains unresolved. Some studies have found that HcV is smaller in first-episode depression patients, suggesting that a reduced HcV is already present at the first manifestation of the illness and could therefore be a susceptibility factor for depression (Frodl et al. Reference Frodl, Meisenzahl, Zetzsche, Born, Groll, Jager, Leinsinger, Bottlender, Hahn and Moller2002; Kronmüller et al. Reference Kronmüller, Schroder, Kohler, Gotz, Victor, Unger, Giesel, Magnotta, Mundt, Essig and Pantel2009; Dedovic et al. Reference Dedovic, Engert, Duchesne, Lue, Andrews, Efanov, Beaudry and Pruessner2010). Other studies in clinical settings favor the converse, i.e. that smaller HcV can be the consequence of depression as they have found links between recurrence and duration of depression and HcV reductions (Bell-McGinty et al. Reference Bell-McGinty, Butters, Meltzer, Greer, Reynolds and Becker2002; MacQueen et al. Reference MacQueen, Campbell, McEwen, Macdonald and Young2003; Sheline et al. Reference Sheline, Gado and Kraemer2003).
One proposed explanation for the relationship between depression and smaller HcV is the neurotoxicity hypothesis, which implies that biological alterations that accompany depression tax the hippocampus, its morphology, and its functionality (Sapolsky et al. Reference Sapolsky, Krey and McEwen1986; McEwen & Gianaros, Reference McEwen and Gianaros2010). It is derived from observations that depression is accompanied by deregulations of key neural pathways such as the glucocorticoids and glutamate networks, which eventually cause neuronal damages and losses (Sapolsky et al. Reference Sapolsky, Krey and McEwen1986; Bremner, Reference Bremner1999; Sapolsky, Reference Sapolsky2000; McEwen & Gianaros, Reference McEwen and Gianaros2010).
The association between HcV and depression is of particular interest in older populations given the extensive literature linking depression to cognitive functioning and dementia (Chen et al. Reference Chen, Ganguli, Mulsant and DeKosky1999; Schweitzer et al. Reference Schweitzer, Tuckwell, O'Brien and Ames2002; Fuhrer et al. Reference Fuhrer, Dufouil, Dartigues and Paquid2003; Thomas et al. Reference Thomas, Gallagher, Robinson, Porter, Young, Ferrier and O'Brien2009) and implicating hippocampal atrophy in cognitive impairment and dementia (Jack et al. Reference Jack, Petersen, Xu, O'Brien, Smith, Ivnik, Boeve, Tangalos and Kokmen2000; Lister & Barnes, Reference Lister and Barnes2009; Kaup et al. Reference Kaup, Mirzakhanian, Jeste and Eyler2011). In order to explore the directionality of the depression–HcV relationship and to assess the neurotoxicity hypothesis, longitudinal studies are needed and few have been undertaken so far. Moreover, among the published studies in older adults, there is a lack of standardization in the definition of depression [ranging from life-time depression diagnosis (Geerlings et al. Reference Geerlings, Sigurdsson, Eiriksdottir, Garcia, Harris, Sigurdsson, Gudnason and Launer2013), to recent depressive symptoms (Dotson et al. Reference Dotson, Davatzikos, Kraut and Resnick2009), to categorizing depression based on depressive symptoms (Geerlings et al. Reference Geerlings, den Heijer, Koudstaal, Hofman and Breteler2008; den Heijer et al. Reference den Heijer, Tiemeier, Luijendijk, van der Lijn, Koudstaal, Hofman and Breteler2011; Goveas et al. Reference Goveas, Espeland, Hogan, Dotson, Tarima, Coker, Ockene, Brunner, Woods, Wassertheil-Smoller, Kotchen and Resnick2011)]. Furthermore, only two studies used longitudinal measures of HcV (Dotson et al. Reference Dotson, Davatzikos, Kraut and Resnick2009; den Heijer et al. Reference den Heijer, Tiemeier, Luijendijk, van der Lijn, Koudstaal, Hofman and Breteler2011) and both focused on depressive symptoms concurrent to the HcV changes.
In this study, we investigate further the relationship between depression and HcV in older populations, by studying within a population-based cohort of older adults the association of history of depression and more proximal depressive symptoms with both HcV and change in HcV over 4 years. We assessed the association between history of depression and both baseline HcV and change in HcV, with the objective of evaluating whether distal depressive episodes are linked to HcV and/or HcV loss at older age. We also examined the relationship between HcV and concurrent depressive symptoms in an attempt to replicate the correlation between smaller HcV and depression found in clinical samples. Finally, we looked at more proximal measurements of depressive symptoms and their association with changes in HcV.
Given the well-documented higher prevalence of depressive symptoms and depression in women (Holden, Reference Holden2005; Marcus et al. Reference Marcus, Young, Kerber, Kornstein, Farabaugh, Mitchell, Wisniewski, Balasubramani, Trivedi and Rush2005) and reports suggesting that age-related hippocampal atrophy (Zhang et al. Reference Zhang, Qiu, Lindberg, Bronge, Aspelin, Backman, Fratiglioni and Wahlund2010; Holland et al. Reference Holland, Desikan, Dale and McEvoy2013) is faster in women compared with men, we assessed gender differences in the relationship between depression-related measures and HcV outcomes.
Method
Study population and data
The Three City (3C) Study is a population-based prospective study of older adults. Between 1999 and 2001, individuals selected from the electoral rolls of three French cities (Bordeaux, Dijon and Montpellier) were invited to participate if they were non-institutionalized and aged ⩾65 years. In total, 9294 subjects agreed to participate (2104 in Bordeaux, 4931 in Dijon, and 2259 in Montpellier) and have been followed every 2 years since inception.
The study protocol has been described previously (3C Study Group, 2003) and was approved by the Ethics Committee of the University Hospital of Kremlin-Bicêtre. Each participant signed an informed consent.
We report results from the Dijon cohort, where brain MRI examinations were performed. At baseline, an MRI was proposed to all subjects aged 65–80 years and enrolled between 1999 and 2000 (n = 2763); 2285 subjects agreed to participate (83%). Due to financial restrictions, 1924 MRIs were performed. Of those, 1806 had valid HcV measurements. We further excluded eight subjects with prevalent dementia and 23 participants who were >80 years at baseline, resulting in a sample of 1775 subjects with one valid HcV measurement. At the 4-year follow-up, 1328 subjects had a second valid MRI scan and follow-up HcV measurements; these subjects with two MRIs constitute our final sample. Of the 447 subjects without a second MRI, 49 were deceased before the second MRI, 111 had poor-quality scans, and 287 refused or were not offered a second MRI. These 447 subjects were older and had smaller HcV, higher depressive symptoms, poorer cognitive functioning and a higher percentage of antidepressant use at baseline.
Measures
Depression-related measures
At baseline, subjects reported whether they had a history of treated depression, age at onset of first treated depression and age at last episode, and whether they had been hospitalized at least once for depression. We considered that subjects had recurrent depression when ages at first and last episodes were different. A severity index of depression history was created by combining the indicators for previous treated depression and hospitalization for depression, generating a three-level index: no previous depression; previous depression without hospitalization; and previous depression with hospitalization.
At baseline and each biennial study wave, depressive symptoms were measured using the Center for Epidemiologic Studies-Depression (CES-D) scale (Radloff, Reference Radloff1977). The CES-D includes 20 self-report items about feelings and symptoms experienced during the preceding week; its suitability for measuring depressive symptoms in older adults has been established, including in the French population (Fuhrer & Rouillon, Reference Fuhrer and Rouillon1989). Of interest to this analysis are CES-D scores collected throughout the 4 years over which hippocampal changes were measured (baseline, first, and second follow-up visits).
Information on antidepressant use at baseline was collected as part of the questionnaire on all medications (prescribed and over-the-counter) used regularly in the previous month. To reduce under-reporting and recall bias, participants showed medical prescriptions and drug packages whenever possible.
Information on depression-related measures was collected through standardized face-to-face interviews administered by trained psychologists at each subject's home.
Hippocampal outcomes
Baseline and follow-up MRIs were performed using the same scanner (1.5 Tesla Magnetom; Siemens, USA) and analysed using identical procedures, as described previously (Maillard et al. Reference Maillard, Delcroix, Crivello, Dufouil, Gicquel, Joliot, Tzourio-Mazoyer, Alperovitch, Tzourio and Mazoyer2008; Crivello et al. Reference Crivello, Lemaitre, Dufouil, Grassiot, Delcroix, Tzourio-Mazoyer, Tzourio and Mazoyer2010). Tissue segmentation and brain tissue probability maps were obtained using Statistical Probability Mapping software (http://www.fil.ion.ucl.ac.uk/spm/) and a voxel-based morphometry protocol that was modified to account for characteristics of aged brains (Good et al. Reference Good, Johnsrude, Ashburner, Henson, Friston and Frackowiak2001; Lemaitre et al. Reference Lemaitre, Crivello, Grassiot, Alperovitch, Tzourio and Mazoyer2005) (for details, see online Supplementary Appendix). Gray matter (GM), white matter (WM), and cerebrospinal fluid volumes were computed as the integral of the voxel intensities of the modulated tissue partition images; total intracranial volume (TIV) was generated as their sum.
Volumes of GM in specific regions of interest were automatically computed by integrating within these regions the voxel intensities of the modulated GM partition images (Tzourio-Mazoyer et al. Reference Tzourio-Mazoyer, Landeau, Papathanassiou, Crivello, Etard, Delcroix, Mazoyer and Joliot2002; Crivello et al. Reference Crivello, Lemaitre, Dufouil, Grassiot, Delcroix, Tzourio-Mazoyer, Tzourio and Mazoyer2010). In this project, we investigated HcV (total = sum of left and right hemispheres).
We explored baseline HcV and change in HcV, which was expressed as the annualized percentage change and computed as the change between HcV at baseline scan (T0) and follow-up scan (T2), relative to baseline HcV, divided by the individual delay in years between scans:
 $$\left[ {\displaystyle{{HcV_{T0} - HcV_{T2}} \over {HcV_{T0} (T2 - T0)}}} \right] \times 100$$
Positive values indicate HcV loss (henceforth referred to as atrophy); higher (positive) values correspond to faster atrophy.
Covariates
Several covariates were taken into account because of their potential associations with HcV or their possible role as confounders in the depression–HcV relationship. Based on prior research and bivariate relationships (described below) between each of the covariates and CES-D scores and/or hippocampal outcomes in our sample, we identified a primary set of covariates that was adjusted for in all analyses: age; gender; education (⩽primary school, intermediate/technical school, ⩾secondary school); baseline: hypertension (systolic blood pressure ⩾140 mmHg or diastolic blood pressure ⩾90 mmHg or use of antihypertensive medication); smoking status (former, current, never-smoker); TIV; apolipoprotein E (APOE) genotype (Crivello et al. Reference Crivello, Lemaitre, Dufouil, Grassiot, Delcroix, Tzourio-Mazoyer, Tzourio and Mazoyer2010); and WM lesion (WML) volumes (by adjusting for, respectively, baseline WML volume and annualized change in WML volume in analyses of baseline HcV and change in HcV).
In sensitivity analyses, we additionally adjusted for baseline history of vascular events (at least one of: myocardial infarction, stroke, coronary surgery, angioplasty, and peripheral vascular diseases), body mass index (BMI), alcohol consumption (g/day), and cognitive functioning (Mini-Mental State Examination; MMSE; Folstein et al. Reference Folstein, Folstein and McHugh1975).
Statistical analyses
In preliminary analyses, we investigated the bivariate relationships between each of the covariates and baseline HcV, annualized percentage change in HcV, and baseline CES-D scores, using separate linear regression models adjusted for age and gender. These analyses helped identify the primary covariates (described above) that were included in all final multivariable models.
The main analyses of associations between depression-related measures and hippocampal outcomes were divided into three parts that differed with respect to timing of the depression measurements and/or the HcV outcome and were based on multivariable linear regression models adjusted for primary covariates. We estimated separate models for each depression variable to avoid multi-collinearity between different measures of similar constructs.
The first part of the analyses focused on HcV and investigated: (i) relationships between each indicator of previous depression (history of depression, age at first depression, recurrence of depression, previous hospitalization for depression, and the severity index) and baseline HcV; and (ii) cross-sectional associations between baseline HcV and concurrent CES-D scores and antidepressant use.
The second part of the analyses assessed the association between indicators of previous depression and the annualized percentage change in HcV.
The third part focused on the relationships between recent depressive symptoms and change in HcV. We first estimated the associations between baseline CES-D scores, as well as baseline antidepressant use, and HcV changes over the following 4 years. Then, we estimated two models that focused on the associations of post-baseline changes in CES-D scores with change in HcV, while adjusting for baseline CES-D. The first model assessed the relationship between changes in depressive symptoms observed early during follow-up, between baseline (T0) and 2 years later (T1), and changes in HcV measured 2 years after T1 (i.e. HcV change measured over 4 years, from T0 to T2). The second model included, in addition to the early change (T0 to T1), the later change in CES-D score (T1 to T2) and aimed to assess the roles of shorter-term changes in CES-D, observed over different time intervals, and compare their relative importance in explaining the longer-term (T0 to T2) changes in HcV.
Since cognitive functioning has been frequently associated with both HcV (Jack et al. Reference Jack, Petersen, Xu, O'Brien, Smith, Ivnik, Boeve, Tangalos and Kokmen2000; Tisserand et al. Reference Tisserand, van Boxtel, Pruessner, Hofman, Evans and Jolles2004; Kaup et al. Reference Kaup, Mirzakhanian, Jeste and Eyler2011) and depressive symptoms (Chen et al. Reference Chen, Ganguli, Mulsant and DeKosky1999; Schweitzer et al. Reference Schweitzer, Tuckwell, O'Brien and Ames2002), we assessed whether the relationships between changes in depressive symptoms and changes in HcV were independent of concurrent changes in cognitive functioning, by adjusting for changes in MMSE scores.
In all analyses involving CES-D scores, we tested for potential non-linearity of the association between CES-D scores or their changes and HcV or change in HcV, using flexible fractional polynomial analyses, which permit identifying different patterns of non-linear associations. Because we a priori expected these relationships to be monotonic, we restricted these analyses to first-order fractional polynomials (FP1) (Royston & Altman, Reference Royston and Altman1994).
In all analyses, we tested if the association between depression-related variables and hippocampal outcomes varied by gender, by including two-way interaction terms between the corresponding depression measure and gender. In most of the analyses of HcV atrophy, the interactions were statistically significant (p < 0.05 for the model-based F test) or close to statistical significance; therefore, we performed separate analyses for women and men.
In sensitivity analyses, we repeated the analyses of change in HcV, described in parts two and three (see above), while redefining the outcome as the annualized absolute change in HcV (not dividing the change by baseline HcV).
We restricted our analyses to complete observations for each model (missing data < 4%). Two-tailed p value <0.05 for the linear regression model-based F test was used as the criterion for statistical significance. Statistical analyses were performed with SAS software (release 9.2; SAS Institute, USA).
Results
Sample characteristics and their associations with hippocampal outcomes
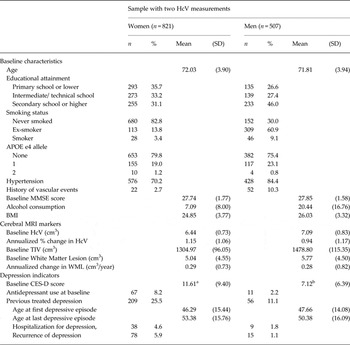
The sample's characteristics are presented in Table 1. Women constituted 62% of the sample; mean age at baseline was 72 years (s.d. = 3.92 years). Baseline HcV was normally distributed, with means of 6.44 cm3 (s.d. = 0.73 cm3) in women and 7.09 cm3 (s.d. = 0.83 cm3) in men. The annualized percentage change in HcV was also normally distributed around means of 1.15% (s.d. = 1.06%) volume loss per year for women and 0.94% (s.d. = 1.17%) for men. There were 265 subjects (20%) with a history of treated depression (209 women). Women had higher baseline CES-D scores than men [11.6 (s.d. = 9.4) v. 7.1 (s.d. = 6.4), p < 0.0001].
Descriptive statistics of the total 3C-Dijon-MRI sample (n = 1328)

3C, Three Cities; APOE, apolipoprotein E; BMI, body mass index; CES-D, Center for Epidemiologic Studies-Depression scale; HcV, hippocampal volume; MMSE, Mini-Mental State Examination; MRI, magnetic resonance imaging; TIV, total intracranial volume; WML, white matter lesions.
a CES-D scores in women: range = 0 to 52; median = 9; interquartile range (IQR) = 4 to 16.
b CES-D scores in men: range = 0 to 41; median = 6; interquartile range (IQR) = 2.5 to 10.
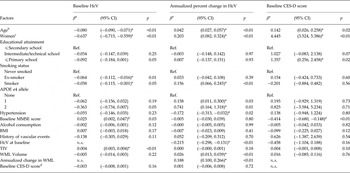
Table 2 summarizes the associations between the sample's characteristics and baseline HcV, annualized percentage change in HcV, and baseline CES-D scores. Smaller baseline HcV was significantly associated with older age, lower cognitive functioning, ex-smoker status, APOE-ε4 allele, and smaller TIV at baseline. Women had significantly smaller HcV, but when TIV was taken into account, the gender difference was no longer significant (p = 0.96). Older subjects, women, smokers, and carriers of the APOE-ε4 allele had significantly faster HcV atrophy. Smaller baseline HcV, larger baseline WML volumes, and faster WML progression were associated with faster HcV loss. Hypertension was associated with significantly slower hippocampal atrophy. Women, older subjects, and those with lower baseline MMSE scores had significantly higher baseline CES-D scores. Baseline CES-D scores were not associated with baseline HcV or HcV atrophy in age- and gender-adjusted analyses in the total sample.
Subjects’ characteristics and their associations with baseline HcV, annualized percentage change in HcV, and baseline CES-D scores (n = 1328)

APOE, apolipoprotein E; BMI, body mass index; CES-D, Center for Epidemiologic Studies-Depression scale; CI, confidence interval; HcV, Hippocampal volume; MMSE, Mini-Mental State Examination; NA, not applicable; Ref., reference; TIV, total intracranial volume; WML, white matter lesion.
a β Coefficients are age- and gender-adjusted, unless otherwise specified.
b β Coefficient adjusted for gender.
c β Coefficient adjusted for age.
d β Coefficient for a one-unit increase in baseline CES-D score.
* p < 0.05
Baseline HcV and previous and concurrent depression-related measures
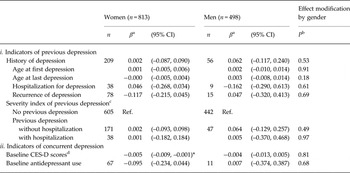
The associations between depression-related measures and baseline HcV were not different for men or women (for interaction terms, see Table 3). History of depression was not associated with baseline HcV (Table 3); we found a cross-sectional association between more baseline depressive symptoms and smaller HcV in women [0.05 cm3, 95% confidence interval (CI) −0.09 to −0.01 cm3 reduction per 10-unit increase in CES-D scores]. In men, this association was of similar magnitude but did not reach statistical significance (p = 0.34). Antidepressant use was not associated with HcV. When baseline CES-D scores and antidepressant use were adjusted for each other, the results did not change (data not shown). Results remained similar with additional adjustment for vascular events, alcohol consumption, BMI, and cognitive functioning.
Association between hippocampal volume at baseline and i) previous and ii) concurrent depression-related measures

CES-D, Center for Epidemiologic Studies-Depression scale; CI, confidence interval; Ref., reference.
a β Coefficients estimated in models adjusted for age, education, total intracranial volume, hypertension, smoking status, white matter lesion progression, and ApolipoproteinE-ε4 genotype.
b p Values for the interaction terms of each of the depression-related variables and a binary indicator for gender, using a multivariable model to estimate the association of the depression-related variable with baseline hippocampal volume in the total sample. F tests for interactions with gender used 1 degree of freedom in the numerator and 1297 in the denominator; the interaction terms of the severity index level binary indicators had 1295 degrees of freedom in the denominator.
c Three-level generated severity score based on history of treated depression (Ref: No previous treated depression; previous depression without hospitalization; previous depression with hospitalization for depression); the levels were modeled using dummy variables.
d β Coefficients for baseline CES-D score correspond to the change in hippocampal volume associated with a one-unit increase in baseline CES-D score.
* p < 0.05.
History of depression and change in HcV
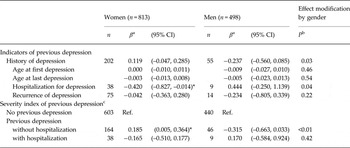
The relationships between change in HcV and history of depression and previous hospitalization for depression differed by gender (Table 4). Among women with previous depression, hospitalization for depression was associated with a 0.4% slower annual HcV atrophy (95% CI −0.83, −0.01%) (Table 4). Recurrence and age at first and last depression were not associated with hippocampal atrophy in men or women. The bottom of Table 4 compares subjects with (a) history of depression without hospitalization, and (b) history of both depression and hospitalization for depression, with the reference group without previous depression. Women with a history of depression without hospitalization had a 0.2% faster annual hippocampal atrophy (95% CI 0.01, 0.36%) than women who were never depressed. In men, previous depression without hospitalization was not statistically significantly associated with hippocampal atrophy (p = 0.08). When compared with those without previous depression, we did not observe an association for either men or women between hospitalization and atrophy.
Association between annualized percent change in hippocampal volume and indicators of previous depression

CI, Confidence interval; Ref., reference.
a β Coefficients estimated in models adjusted for age, education, total intracranial volume, hypertension, smoking status, white matter lesion progression, and ApolipoproteinE-ε4 genotype.
b p Values for the interaction terms of each of the depression-related variables and a binary indicator for gender, using a multivariable model to estimate the association of the depression-related variable with the annualized percentage change in hippocampal volume in the total sample. F tests for interactions with gender used 1 degree of freedom in the numerator and 1286 in the denominator; the interaction terms of the severity index levels binary indicators had 1284 degrees of freedom in the denominator.
c Three-level generated severity score of severity of previous treated depression (Ref: No previous treated depression; previous depression without hospitalization, previous depression with hospitalization for depression); the levels were modeled using dummy variables.
* p < 0.05.
Proximal depressive symptoms and change in HcV
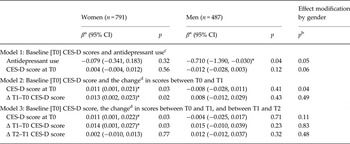
Antidepressant use at baseline was significantly associated with slower hippocampal atrophy in men (β = −0.71, p = 0.04) (Table 5). In models using baseline CES-D and CES-D trajectories as predictors, we found that in women, higher baseline CES-D scores and early increases in scores (worsening symptoms from T0 to T1) were associated with faster HcV atrophy over the 4-year follow-up (0.1% faster atrophy per 10-unit increases in each of baseline and early changes in CES-D). T1-to-T2 changes in scores were not associated with HcV change in women (Model 3; Table 5). Depressive symptoms were not associated with HcV changes in men. Results were not altered when we accounted for baseline and changes in MMSE scores (data not shown).
Annualized percent change in hippocampal volume and proximal depression-related measures

CES-D, Center for Epidemiologic Studies-Depression scale; CI, confidence interval.
a β Coefficients estimated in models adjusted for age, education, total intracranial volume, hypertension, smoking status, white matter lesion progression and ApolipoproteinE-ε4 genotype.
b p Values for the interaction terms of CES-D scores and a binary indicator for gender, using a multivariable model to estimate the association of the depression-related variable with the annualized percentage change in hippocampal volume in the total sample. F tests for interactions with gender used 1 degree of freedom in the numerator and 1264 in model 1, 1262 in model 2 and 1260 in model 3 in the denominator, respectively.
c CES-D scores and antidepressant use were modeled separately. β Coefficients for baseline CES-D score correspond to the change in the annualized percent change in hippocampal volume associated with a one-unit increase in baseline CES-D score.
d Positive values for CES-D score changes (Δ) indicate worsening of depressive symptoms between the time points. β Coefficients for the changes in CES-D score correspond to the change in the annualized percent change in hippocampal volume associated with a one-unit worsening of CES-D scores between two time points.
* p < 0.05.
In additional analyses, we restricted our sample to subjects with above-threshold baseline CES-D scores (using cut-offs to identify risk for depression validated in the French population) (Fuhrer & Rouillon, Reference Fuhrer and Rouillon1989). Results confirmed an association between early worsening of depressive symptoms (but not later changes in symptoms) and faster atrophy in women (data not shown), whereas baseline CES-D scores were no longer related to atrophy in the subsample restricted to women with above-threshold baseline scores. Similar to the main analyses, no associations between CES-D scores and changes in scores and HcV measures were found in men.
Additional analyses
In sensitivity analyses, we re-ran the analysis of change in HcV while (i) redefining the outcome as absolute change in HcV and (ii) adjusting for further covariates (BMI, alcohol consumption, history of vascular events, and cognitive functioning). Neither of these analyses substantially changed the results. Fractional polynomial analyses confirmed the linearity of the relationships between CES-D scores and both HcV and change in HcV (data not shown); this allowed us to generalize the results to more meaningful changes in scores, such as a 10-point change (corresponding to a 1 s.d. change in score in women).
We repeated our analyses by examining left and right HcV (see online Supplementary Tables S1, S2 and S3). Overall, both lateral HcVs were linked to depression-related measures; one noticeable pattern was the pronounced associations between proximal depressive symptoms and left HcV atrophy, which is in agreement with prior studies (den Heijer et al. Reference den Heijer, Tiemeier, Luijendijk, van der Lijn, Koudstaal, Hofman and Breteler2011; Steffens et al. Reference Steffens, McQuoid, Payne and Potter2011).
Discussion
In community-dwelling older adults, we found relationships between depression-related measures and hippocampal outcomes in women, but not in men. Among women, only concurrent depressive symptoms were associated with smaller baseline HcV, while both previous depression and proximal depressive symptoms were associated with faster hippocampal atrophy. To our knowledge, this is the first report that differentiates between previous depression and proximal depressive symptoms and their relationships with HcV changes; our findings suggest that both are related to hippocampal atrophy in women. In contrast, women with previous hospitalization for depression and men with recent antidepressant use had slower hippocampal atrophy, highlighting that depression and its treatment have different patterns of association with hippocampal atrophy.
A major strength of our results lies in the use of the 3C-Dijon MRI sample that includes a population-based design, serial MRI measurements, and information on several potential confounders. The large sample size increased the precision and the power to detect associations of smaller magnitude and effect modification; it allowed us to conduct gender-stratified analyses and to identify gender differences and similarities. Moreover, we were able to investigate several aspects of depression (history of depression, recurrence, age of onset, antidepressant use, more proximal depressive symptoms and their trajectories).
Our results on baseline HcV replicate, in a population-based setting and using depressive symptoms, the cross-sectional association between clinical depression and smaller HcV (Campbell et al. Reference Campbell, Marriott, Nahmias and MacQueen2004; Koolschijn et al. Reference Koolschijn, van Haren, Lensvelt-Mulders, Pol and Kahn2009). The results also concur with two population-based studies that reported that history of depression was not associated with HcV at older age (Geerlings et al. Reference Geerlings, den Heijer, Koudstaal, Hofman and Breteler2008; Geerlings et al. Reference Geerlings, Sigurdsson, Eiriksdottir, Garcia, Harris, Sigurdsson, Gudnason and Launer2013). However, one of these studies found that subjects with concomitant depression had smaller HcV (Geerlings et al. Reference Geerlings, Sigurdsson, Eiriksdottir, Garcia, Harris, Sigurdsson, Gudnason and Launer2013).
While history of depression was not associated with HcV at baseline, it was associated with a faster rate of HcV atrophy in women. To our knowledge this is the first report on characteristics of previous depression and change in HcV and it suggests that both history of depression, and treatment are related to HcV changes at older age in women. Information on history of depression in our sample refers to self-reported history of treated depression, which could be an indicator of more severe depression or a reflection of the treatment. The only available indicator of type of treatment was hospitalization for depression, which could be a proxy for the most severe depressions, non-responsiveness to ambulatory treatment, or for intense treatment modalities. Using this information, we refined our subgroup analyses in an attempt to separate the effects of history of depression and history of hospitalization for depression. Our results show that (i) among women with a history of depression, those who were hospitalized for depression had slower HcV atrophy and that (ii) women with history of depression but without previous hospitalization for depression had accelerated HcV atrophy compared with women with no history of depression. These results are in line with studies reporting that pharmacological and non-pharmacological treatments of depression boost hippocampal neurogenesis and are associated with larger HcV (Boldrini et al. Reference Boldrini, Underwood, Lau, Mann and Arango2008, Reference Boldrini, Underwood, Hen, Rosoklija, Dwork, Mann and Arango2009, 2012; Nordanskog et al. Reference Nordanskog, Dahlstrand, Larsson, Larsson, Knutsson and Johanson2010; Eisch & Petrik, Reference Eisch and Petrik2012). The results also suggest that history of depression is a heterogeneous construct and further information on history of depression treatment might distinguish the combined versus separate effects of depression and its treatment on cerebral outcomes.
Parallel to these results, baseline antidepressant use was associated with slower hippocampal atrophy in men, indicating a link between both past and more recent treatment for depression and slower hippocampal atrophy. Proximal depressive symptoms were associated with faster HcV atrophy in women, with a 0.1% faster atrophy for 10-point increases in each of baseline and early-changes in CES-D scores. To further understand the magnitude of these associations, we compared them with those of identified predictors of hippocampal atrophy (Table 2) and noted that they are double the risk of aging 1 year and comparable to the risk of being a heterozygote carrier of the APOE-ε4 allele on HcV atrophy. One epidemiological study (den Heijer et al. Reference den Heijer, Tiemeier, Luijendijk, van der Lijn, Koudstaal, Hofman and Breteler2011) found that concurrent above-threshold depressive symptoms were associated with faster HcV decline in older adults. One clinical study also documented faster HcV atrophy in depressed older adults compared with controls (Steffens et al. Reference Steffens, McQuoid, Payne and Potter2011). These studies had smaller sample sizes, used categorical classification of depression, and did not investigate gender differences. Our results complement these studies and indicate that more depressive symptoms (rather than diagnostic categories) and early-occurring, but not late-occurring, worsening of symptoms are associated with faster hippocampal atrophy in women, but not in men. These associations were independent of concurrent changes in cognitive function, history of depression, and antidepressant use, and were not modified by history of depression (data not shown).
We note that the association between baseline depressive symptoms and change in HcV was significant once we accounted for post-baseline symptoms. This could be partly explained by a regression-to-the-mean scenario, as baseline CES-D scores were positively correlated with scores at T1 and negatively correlated with T1–T0 changes which were associated with HcV changes.
Although our study did not include measures of cortisol or other indicators of depression-induced neurotoxicity, the results are concordant with the proposed neurotoxicity hypothesis. Clinical studies exploring this hypothesis have found that remitted depression patients had larger HcV than depressed patients without remission (Hsieh et al. Reference Hsieh, McQuoid, Levy, Payne, MacFall and Steffens2002; Caetano et al. Reference Caetano, Hatch, Brambilla, Sassi, Nicoletti, Mallinger, Frank, Kupfer, Keshavan and Soares2004; Geerlings et al. Reference Geerlings, Sigurdsson, Eiriksdottir, Garcia, Harris, Sigurdsson, Gudnason and Launer2013) and others reported a role for treatment for depression in reversing volume loss (Shimizu et al. Reference Shimizu, Hashimoto, Okamura, Koike, Komatsu, Kumakiri, Nakazato, Watanabe, Shinoda, Okada and Iyo2003; Caetano et al. Reference Caetano, Hatch, Brambilla, Sassi, Nicoletti, Mallinger, Frank, Kupfer, Keshavan and Soares2004). Such findings suggest that the hippocampus is a dynamic structure and that the potential neurotoxicity caused by depressive episodes, such as cortisol and brain-derived neurotrophic factor deregulation, can be restored to normal levels in remission (Shimizu et al. Reference Shimizu, Hashimoto, Okamura, Koike, Komatsu, Kumakiri, Nakazato, Watanabe, Shinoda, Okada and Iyo2003; Caetano et al. Reference Caetano, Hatch, Brambilla, Sassi, Nicoletti, Mallinger, Frank, Kupfer, Keshavan and Soares2004). Other clinical studies have reported smaller HcV in patients with severe and repeated depression that persisted after remission, and argue that the effects of depression on HcV are not acute, but rather cumulative and long lasting (Sheline et al. Reference Sheline, Wang, Gado, Csernansky and Vannier1996, Reference Sheline, Sanghavi, Mintun and Gado1999; Bremner et al. Reference Bremner, Narayan, Anderson, Staib, Miller and Charney2000; Sapolsky, Reference Sapolsky2000). However, these conclusions are based on HcV at one point in time. Our results suggest that both short-term and long-term associations between depression experiences and HcV atrophy may be present and highlight the importance of studying change in HcV. Indeed, repeated measures of HcV can differentiate between a pre-existing small volume and rate of change (stable versus accelerated), which is a more informative outcome to investigate the neurotoxicity hypothesis.
For HcV atrophy, results were different for men and women. While the higher prevalence of depression in women is widely recognized (Holden, Reference Holden2005; Marcus et al. Reference Marcus, Young, Kerber, Kornstein, Farabaugh, Mitchell, Wisniewski, Balasubramani, Trivedi and Rush2005), gender differences in the relationship between cerebral volumes and depression have not been studied directly. Hastings et al. (Reference Hastings, Parsey, Oquendo, Arango and Mann2004) argue that support for gender differences in the HcV–depression relationship stems from the observation that studies based on women only always found an association between depression and HcV reduction, while samples including both men and women showed heterogeneous results. Other indications for gender differences in the neurobiology of depression come from behavioral, pharmacological, and genetic studies, which suggest that gender plays a role in the manifestation, treatment response, and in various biological networks linked to depression (Keers & Aitchison, Reference Keers and Aitchison2010; Pitychoutis et al. Reference Pitychoutis, Dalla, Sideris, Tsonis and Papadopoulou-Daifoti2012). Proposed mechanisms for these gender differences include sex-hormone pathways, mainly involving estrogen, which have been linked to neuroprotective processes and hippocampal neurogenesis (Hajszan et al. Reference Hajszan, Milner and Leranth2007; Galea, Reference Galea2008). Furthermore, and in line with our results, hormonal changes in older women have been linked to depression, poorer response to treatment, and deregulation of neural circuits highly present in the hippocampus and involved in depression, such as serotonergic networks (Garcia-Segura et al. Reference Garcia-Segura, Azcoitia and DonCarlos2001; Keers & Aitchison, Reference Keers and Aitchison2010; Everaerd et al. Reference Everaerd, Gerritsen, Rijpkema, Frodl, van Oostrom, Franke, Fernandez and Tendolkar2012).
Limitations
Subjects with two MRIs were younger, had larger HcV, fewer depressive symptoms, and better cognitive functioning, and used less antidepressant medication, compared with subjects with one MRI, resulting in a healthier sample, which could potentially attenuate the results. Another issue concerns the subgroup analyses. Despite a lifetime prevalence of self-reported treated depression of 20% in our sample, which is comparable with other reported findings (Kessler et al. Reference Kessler, Berglund, Demler, Jin, Merikangas and Walters2005), our study and other studies on history of depression and HcV have the common limitation of small numbers of subjects with specific characteristics (recurrent, early-onset, etc.) and might have been underpowered to detect associations in these subgroups, if they were present. Furthermore, we did not have information on the duration of previous depression, type of treatment, or on the timing of hospitalization, which might have provided insight into the temporal delay between depression and hospitalization and observed changes in the HcV. Despite these limitations, we identified subgroups that have significantly different patterns of HcV changes: women with previous hospitalization for depression and men with recent antidepressant use.
Another potential limitation is the use of the CES-D scale, which measures symptoms experienced in the preceding week; therefore, some depressive symptoms and episodes occurring throughout follow-up may have been missed, which could have decreased the precision of the results. The continuous nature of CES-D scores allowed us to generate trajectories of changes in symptoms and to verify that the associations between CES-D scores and hippocampal outcomes were linear and that there were no thresholds or ranges of depressive symptoms at which the effects are different.
Another issue concerns the HcV measurements, which were based on fully automated procedures of volume estimation. While optimal for large population-based studies, these procedures could be influenced by residual inter-subject variability (through partial volume effects due to adjacent structures). Nonetheless, we note that the average HcV and the coefficient of variability in HcV in the 3C-Dijon MRI cohort were comparable to other studies (den Heijer et al. Reference den Heijer, Oudkerk, Launer, van Duijn, Hofman and Breteler2002; Bis et al. Reference Bis, DeCarli, Smith, van der Lijn, Crivello, Fornage, Debette, Shulman, Schmidt, Srikanth, Schuur, Yu, Choi, Sigurdsson, Verhaaren, DeStefano, Lambert, Jack, Struchalin, Stankovich, Ibrahim-Verbaas, Fleischman, Zijdenbos, den Heijer, Mazoyer, Coker, Enzinger, Danoy, Amin, Arfanakis, van Buchem, de Bruijn, Beiser, Dufouil, Huang, Cavalieri, Thomson, Niessen, Chibnik, Gislason, Hofman, Pikula, Amouyel, Freeman, Phan, Oostra, Stein, Medland, Vasquez, Hibar, Wright, Franke, Martin, Thompson, Nalls, Uitterlinden, Au, Elbaz, Beare, van Swieten, Lopez, Harris, Chouraki, Breteler, De Jager, Becker, Vernooij, Knopman, Fazekas, Wolf, van der Lugt, Gudnason, Longstreth, Brown, Bennett, van Duijn, Mosley, Schmidt, Tzourio, Launer, Ikram and Seshadri2012).
Our study accounted for several covariates (e.g. alcohol use, smoking status, and several medical conditions); and, in additional analyses we adjusted for the total number of prescribed medications and for psychotropic medication use, and the conclusions remained unchanged. However, the covariates were measured at baseline and might not reflect prior exposure to these factors; therefore, our analyses might be limited by potential residual confounding and by other potential confounders (e.g. history of substance use and history of hormonal medications).
Finally, our study included several analyses to test multiple hypotheses, and hence our overall type I error rate is higher than α = 0.05 used for individual tests. We note, however, the high frequency of significant interaction terms in the HcV change analyses. Four interactions tested between gender and separate depression measures (history of depression, hospitalization for depression, baseline CES-D scores, and antidepressant use) were below p = 0.06 (Tables 4 and 5), compared with no more than one interaction with p value <0.06 expected by chance alone. This implies that several associations with HcV atrophy differ systematically between women and men, and that at least in one group (in our case, women), there must be systematic associations between the corresponding depression-related variables and atrophy (Abrahamowicz et al. Reference Abrahamowicz, Beauchamp, Fournier and Dumont2013).
Conclusions
Our results suggest several links between depression and its treatment and both HcV and change in HcV. Concurrent depressive symptoms are associated with smaller HcV in women. Both history of depression and more proximal depressive symptoms are associated with faster HcV decline in women. Furthermore, women with a history of hospitalization for depression and men with recent antidepressant use had slower hippocampal atrophy. Additional longitudinal studies that focus on change in HcV, and that combine information on both prior and current depression and treatment for depression, will help disentangle the temporality and mechanisms behind cerebral and behavioral changes associated with depression.
Supplementary material
For supplementary material accompanying this paper visit http://dx.doi.org/10.1017/S0033291714003055
Acknowledgements
The 3-City Study is conducted under a partnership agreement among the Institut National de la Santé et de la Recherche Médicale (INSERM), the Victor Segalen–Bordeaux II University, and Sanofi-Aventis. The Fondation pour la Recherche Médicale funded the preparation and initiation of the study. The 3C Study is supported by the Caisse Nationale Maladie des Travailleurs Salariés, Direction Générale de la Santé, Mutuel General d'Education Nationale, Institut de la Longévité, Conseils Régionaux of Aquitaine and Bourgogne, Fondation de France, Ministry of Research–INSERM Programme ‘Cohortes et collections de données biologiques’, and Fondation Plan Alzheimer. R.F. holds the Canadian Institutes of Health Research (CIHR) Canada Research Chair (CRC) in Psychosocial Epidemiology (grant no: 950-202268). M.E. is supported by the CRC in Psychosocial Epidemiology (grant no: 950-202268) and the CIHR Interdisciplinary Capacity Enhancement Grant in Health Disparities (HOA-80072). Sponsors were involved neither in the design of the study nor in the data analyses or manuscript elaboration. C.T. has received investigator-initiated research funding from the French National Research Agency (ANR) and the Fondation Plan Alzheimer for the 3C Study. He has also received fees from the Fondation Plan Alzheimer for participating in its steering committee. The other authors have nothing to disclose. The authors thank the staff and participants of the 3C-Dijon cohort for their important contributions.