Introduction
Schizophrenia (SZ) and bipolar disorder (BD) are complex mental illnesses with elusive etiologies. Although nosologically distinct, these disorders are recognized to exist on a spectrum with substantial genetic, biological and phenomenological similarities (Craddock et al. Reference Craddock, O'Donovan and Owen2006; International Schizophrenia Consortium et al. Reference Purcell, Wray, Stone, Visscher, O'Donovan, Sullivan and Sklar2009; Rossell & Van Rheenen, Reference Rossell and Van Rheenen2013; Tamminga et al. Reference Tamminga, Ivleva, Keshavan, Pearlson, Clementz, Witte, Morris, Bishop, Thaker and Sweeney2013; Ruocco et al. Reference Ruocco, Reilly, Rubin, Daros, Gershon, Tamminga, Pearlson, Hill, Keshavan, Gur and Sweeney2014; Pearlson et al. Reference Pearlson, Clementz, Sweeney, Keshavan and Tamminga2016). Qualitative overlap is clearly evident in cognitive performance; patients of both disorders tend to show similar patterns of neuropsychological impairments compared with controls, and the same underlying cognitive factor structure (Schretlen et al. Reference Schretlen, Peña, Aretouli, Orue, Cascella, Pearlson and Ojeda2013; Harvey et al. Reference Harvey, Siever, Huang, Muralidhar, Zhao, Miller, Aslan, Mane, McNamara, Gleason, Brophy, Przygodszki, O'Leary, Gaziano and Concato2014). While the magnitude of impairments tends to be larger in SZ compared with BD, recent work suggests that these effects lack diagnostic specificity (Bora et al. Reference Bora, Yucel and Pantelis2009b ; Hill et al. Reference Hill, Reilly, Keefe, Gold, Bishop, Gershon, Tamminga, Pearlson, Keshavan and Sweeney2013; Tamminga et al. Reference Tamminga, Pearlson, Keshavan, Sweeney, Clementz and Thaker2014; Bora & Pantelis, Reference Bora and Pantelis2015; Van Rheenen et al. Reference Van Rheenen, Bryce, Tan, Neill, Gurvich, Louise and Rossell2016). Nonetheless, quantitative cognitive differences but qualitative similarities blur understandings of the extent to which the factors that contribute to cognitive impairments in SZ and BD are similar.
Traditional studies of cognition in BD and SZ have used group averages to study cognitive differences between these disorders. Although variance is considered to some extent, this approach does not fully account for systematic inter-individual differences within diagnostic categories of SZ or BD, ignoring the considerable cognitive heterogeneity that exists within them (Bora et al. Reference Bora, Yücel and Pantelis2010). Studies clustering patients into subgroups on the basis of cognition increasingly show that some individuals with SZ have severely compromised cognition, whilst others appear to have mild to moderate impairments, and others, still, appear to be spared almost completely (Weickert et al. Reference Weickert, Goldberg, Gold, Bigelow, Egan and Weinberger2000; Lewandowski et al. Reference Lewandowski, Sperry, Cohen and Öngür2014; Reser et al. Reference Reser, Allott, Killackey, Farhall and Cotton2015; Wells et al. Reference Wells, Swaminathan, Sundram, Weinberg, Bruggemann, Jacomb, Cropley, Lenroot, Pereira, Zalesky, Bousman, Pantelis, Weickert and Weickert2015; TE Van Rheenen et al. unpublished observations). The few studies addressing cognitive heterogeneity in BD parallel these observations, suggesting that cognitive variability may be anchored by subgroups of relatively intact and significantly impaired BD patients (Green et al. Reference Green, Cairns, Wu, Dragovic, Jablensky, Tooney, Scott and Carr2013; Burdick et al. Reference Burdick, Russo, Frangou, Mahon, Braga, Shanahan and Malhotra2014; Bora et al. Reference Bora, Hıdıroğlu, Özerdem, Kaçar, Sarısoy, Civil Arslan, Aydemir, Cubukcuoglu Tas, Vahip, Atalay, Atasoy, Ateşci and Tümkaya2016; Jensen et al. Reference Jensen, Knorr, Vinberg, Kessing and Miskowiak2016; Solé et al. Reference Solé, Jiménez, Torrent, Mar Bonnin, Torres, Reinares, Priego, Salamero, Colom, Varo, Vieta and Martínez-Arán2016). Nonetheless, differences in the number of emergent subgroups and the extent of impairment across studies and diagnoses suggest that further replication is necessary.
Recently, the Bipolar–Schizophrenia Network for Intermediate Phenotypes Study has shown that differing cognitive outcomes in a cross-diagnostic sample of SZ and psychotic BD patients map onto ‘cross-diagnostic biotypes’ that were derived from several brain-based biomarkers (Clementz et al. Reference Clementz, Sweeney, Hamm, Ivleva, Ethridge, Pearlson, Keshavan and Tamminga2016). Psychosis studies focused on cognition as the clustering variable specifically have provided preliminary evidence that membership of disparate cognitive clusters predicts different psychosocial outcomes (Burdick et al. Reference Burdick, Russo, Frangou, Mahon, Braga, Shanahan and Malhotra2014; Lewandowski et al. Reference Lewandowski, Sperry, Cohen and Öngür2014; Wells et al. Reference Wells, Swaminathan, Sundram, Weinberg, Bruggemann, Jacomb, Cropley, Lenroot, Pereira, Zalesky, Bousman, Pantelis, Weickert and Weickert2015). Together, these findings suggest diversity in the cognitive processes involved in disease phenotypes in SZ and BD, some of which are cross-diagnostic.
Empirical characterization of the structure of cognitive heterogeneity in SZ and BD is critical to our understanding of this key symptom dimension. Applying statistical clustering techniques in a large sample of patients with these disorders assessed with the same cognitive battery can facilitate our understanding of how clustering outcomes correspond between these nosologically differentiated groups. This can overcome limitations inherent in the group-average approach by addressing heterogeneity across patients explicitly. This is important given that whole-group comparisons of SZ and BD generally indicate quantitative differences in cognition that may represent manifestations of different underlying mechanisms. It is unknown whether these quantitative differences hold when cognitive heterogeneity within each disorder is explicitly considered.
Such an empirical refinement of disease phenotypes on the basis of cognition may make overlaps or disparities between SZ and BD more apparent, which could expedite the search for factors that influence different cognitive outcomes within these disorders. Such knowledge may also be informative to the formulation and refinement of approaches to treatment for BD, where cognitive remediation research is lacking but may benefit by drawing on approaches being trialed in SZ (Douglas & Van Rheenen, Reference Douglas and Van Rheenen2016). Cognitively speaking, the extent to which cognitive remediation approaches used in SZ can be applied to BD depends on the extent to which cognition in the disorders overlaps both qualitatively and quantitatively. For such approaches to be successful, both within- and between-group heterogeneity should be taken into account.
Here, we adopt a clustering approach in the interests of reducing variability in the broader psychiatric diagnoses of SZ and BD, by analysing the structure of cognitive heterogeneity using a transdiagnostic framework to further understand cognitive overlap between the disorders. Our study objectives were threefold and aimed to: (1) examine cognitive characteristics of emergent subgroups through cognitive cluster analysis in SZ and BD independently; (2) determine the extent of any overlaps in the profiles of the newly emergent clusters across diagnoses; and (3) examine how a cross-diagnostic approach to understanding cognitive variability was more meaningful than considering variability in BD and SZ patients separately. The degree to which emergent subgroups could be differentiated on demographic and symptom measures, and estimations of decline in cognitive functioning or accelerated aging was also explored.
Method
All procedures contributing to this work comply with the ethical standards of the relevant national and institutional committees on human experimentation and with the Helsinki Declaration of 1975, as revised in 2008.
Participants
The data of 564 SZ patients, 402 BD patients and 575 healthy controls (HCs) were drawn from several independent research studies examining cognition in psychiatric illness at four sites; (1) Monash Alfred Psychiatry Research Centre, Melbourne Australia (n = 288); (2) Zucker Hillside Hospital, NY, USA (n = 874); (3) Icahn School of Medicine at Mount Sinai, NY, USA (n = 221); (4) McLean Hospital, Belmont, MA, USA (n = 158; see also online Supplementary material). Relevant hospital and university ethical review boards approved each study. Written informed consent was obtained from each participant. Psychiatric diagnoses were confirmed by either the Mini-International Neuropsychiatric Interview (Sheehan et al. Reference Sheehan, Lecrubier, Harnett-Sheehan, Amorim, Janavs, Weiller, Hergueta, Baker and Dunbar1998) or the Structured Clinical Interview for DSM-IV (First et al. Reference First, Spitzer, Gibbon and Williams1996), depending on the study through which participants were originally enrolled. Positive and negative symptomatology was assessed in all patients with either the Brief Psychiatric Rating Scale (BPRS; Overall & Gorham, Reference Overall and Gorham1962) or the Positive and Negative Syndrome Scale (PANSS; Kay et al. Reference Kay, Flszbein and Opfer1987). In the BD sample, depressive symptomatology was assessed with either the Montgomery–Åsberg Depression Rating Scale (MADRS; Montgomery & Åsberg, Reference Montgomery and Åsberg1979) or the Hamilton Depression Rating Scale (HAMD; Hamilton, Reference Hamilton1960). Manic symptomatology was assessed with either the Young Mania Rating Scale (YMRS; Young et al. Reference Young, Biggs, Ziegler and Meyer1978) or the Clinician Administered Rating Scale for Mania (CARS-M; Altman et al. Reference Altman, Hedeker, Janicak, Peterson and Davis1994) in the BD patientsFootnote 1 Footnote †. All participants were fluent in English, were between the ages of 18 and 65 years, and had an estimated pre-morbid intelligence quotient (IQ) > 70 as scored by either the Wechsler Test of Adult Reading (Holdnack, Reference Holdnack2001), the North American Adult Reading Test (Blair & Spreen, Reference Blair and Spreen1989) or the word reading subtest from the Wide Range Achievement Test (WRAT; Jastak & Wilkinson, Reference Jastak and Wilkinson1984). Participants with significant visual or verbal impairments, a known neurological disorder, and current substance/alcohol abuse or dependence were excluded.
Measures
The US normed age- and gender-corrected T scores of the MATRICS Consensus Cognitive Battery (MCCB; Kern et al. Reference Kern, Nuechterlein, Green, Baade, Fenton, Gold, Keefe, Mesholam-Gately, Mintz, Seidman, Stover and Marder2008) were available for all participants for the following domains of cognition: speed of processing (SOP); attention/vigilance (AV); working memory (WM); visual learning (VisL); reasoning and problem solving (RPS); and social cognition (SC). The Hopkins Verbal Learning Test Revised (HVLT-R) T scores were available for a majority of participants; however, a subset of BD participants had only California Verbal Learning Test II (CVLT-II) scores available. To avoid having to exclude these participants and lose data, we merged the age- and gender-corrected T scores of HVLTR trials 1–3 and CVLT-II trials 1–5 into a single verbal learning (VerL) domain.
Statistical analysis
Subsets of the current data have been published previously (Burdick et al. Reference Burdick, Russo, Frangou, Mahon, Braga, Shanahan and Malhotra2014; Lewandowski et al. Reference Lewandowski, Sperry, Cohen and Öngür2014; Tan & Rossell, Reference Tan and Rossell2014; Van Rheenen & Rossell, Reference Van Rheenen and Rossell2014; Sperry et al. Reference Sperry, O'Connor, Öngür, Cohen, Keshavan and Lewandowski2015; Van Rheenen et al. Reference Van Rheenen, Bryce, Tan, Neill, Gurvich, Louise and Rossell2016). The online Supplementary material provides a detailed overview of the statistical analysis (including online Supplementary Table S1 and Fig. S1). Briefly, several hierarchical clustering analyses (HCA; Ward's method, squared Euclidean distance) were conducted using the cognitive domains scores, regressing out the effect of site. Analyses were conducted independently in the HC, SZ and BD groups first, then cross-diagnostically (i.e. combined SZ and BD)Footnote 2 . Once final clustering solutions were ascertained, differences in the descriptive and cognitive profiles of the newly emergent clusters were assessed. To determine if cross-diagnostic clustering was more meaningful in reducing cognitive variability than clustering within each diagnosis separately, comparisons were made between the quotient of the adjusted mean square errors for the separate BD and SZ clusters and for the cross-diagnostic sample from each cluster comparison. Next, estimated pre-morbid IQFootnote 3 was assessed against a global estimate of current cognitive functioning (measured by a cognitive composite score) in a discrepancy analysis, to provide a proxy measure of stability or decline in cognition in HCs v. the clusters generated by the most meaningful clustering method (i.e. clustering BD or SZ independently or cross-diagnostically). The intra-individual standard deviation (is.d.) of variance on each cognitive domain (i.e. subtest dispersion) was also calculated, and the subgroup is.d. averages were compared between clusters as an indirect estimate of cognitive aging. Finally, to determine whether the cross-diagnostic cluster solution was uni- or multidimensional in its factorial structure, an exploratory factor analysis was conducted. This analysis used the maximum likelihood extraction method with a Varimax (orthogonal) rotation. The scree plot was examined and eigenvalues above 1 were considered to reference valid factors. All analyses were conducted in SPSS version 22, with post-hoc tests corrected at p < 0.05 using the Games–Howell method for unequal variance and unequal sample size.
Results
Descriptive statistics and cognitive domain comparisons between SZ and BD participants prior to clustering are given in online Supplementary Table S2 and Fig. S2. Separate group analyses resulted in a two-cluster solution for HCs and three-cluster solutions for the patient groups.
HC analysis
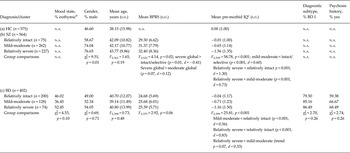
HC data were normally distributed. Two clusters were observed: cluster 1 (between 0.2 and 0.4 s.d.s above the group mean) and cluster 2 (between 0.4 and 0.7 s.d.s below the group mean). While these clusters indicated groups with differential performance, both groups were within 1 s.d. of each other and their distinction is irrelevant in the current context. Thus, these clusters were collapsed and used as a single group comparator for the patient group analyses (Table 1).
Descriptive summary for the HC group and clustering outcomes in BD and SZ groups a

HC, Healthy control; BD, bipolar disorder; SZ, schizophrenia; s.d., standard deviation; BPRS, Brief Psychiatric Rating Scale; IQ, intelligence quotient; n.a., not applicable.
a Post-hoc p values are Games–Howell corrected for unequal samples sizes/unequal variances.
b Euthymic criteria = ⩽ 8 mania and depression rating scale (see online Supplementary material for further details).
c Pre-morbid IQ values represent residual scores (from which site differences have been regressed out) that are standardized against HC values (mean = 0, s.d. = 1) (see online Supplementary material for further details).
SZ analysis
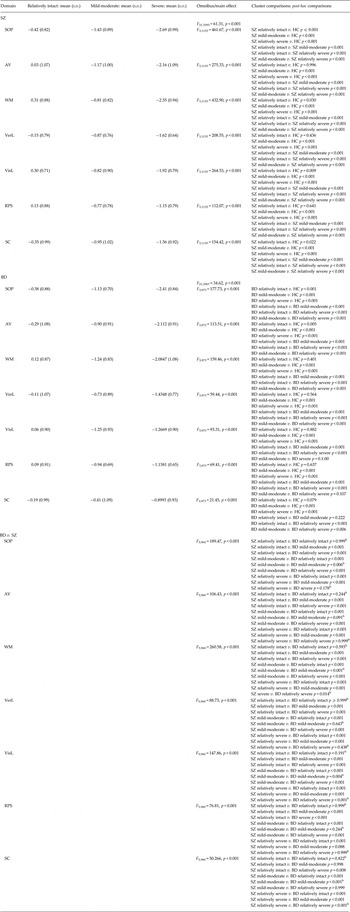
There was substantial variability in cognitive profile severity of the three emergent SZ clusters, all differing from each other on all cognitive domains (Table 2). One cluster, labeled relatively intact, performed at an equivalent level to HCs on AV, VerL and RPS, with slight impairments in SOP and SC (range ±0.31 to −0.42 v. HCs). This cluster outperformed HCs in VisL and WM. A second cluster, labeled mild-moderate, was significantly impaired across all domains of cognition in comparison with HCs, but with effects ranging from 0.8 to 1.5 s.d.s below the HC means. The third cluster, labeled relatively severe, was also impaired across all domains relative to HCs, but with more severe performance deficits ranging from 1.2 to 2.7 s.d.s below HCs.
Cognitive domain comparisons between HC and BD/SZ clusters a

HC, Healthy control; BD, bipolar disorder; SZ, schizophrenia; s.d., standard deviation; SOP, speed of processing; AV, attention/vigilance; WM, working memory; VerL, verbal learning; VisL, visual learning; RPS, reasoning and problem solving; SC, social cognition.
a All SZ and BD patient scores were standardized (Z scores) against HC group means and standard deviations for all domains. All HC means = 0 and standard deviations = 1. Post-hoc comparisons were corrected using the Games–Howell test for unequal variances/unequal sample sizes.
b Post-hoc comparisons between corresponding SZ and BD clusters.
SZ cluster distributions are shown in Fig. 2a . There were no significant age differences between SZ clusters. However, the relatively intact cluster had a more even gender distributionFootnote 4 , as well as lower BPRS scores compared with the relatively severe clusterFootnote 5 . The relatively intact cluster also had significantly higher pre-morbid IQ scores compared with the relatively severe and the mild-moderate clusters, which also differed from each other in terms of pre-morbid IQ (Table 1). Only scores for the latter two clusters were significantly lower than that of HCs.
BD analysis
There were significant differences in cognitive profile severity of the three emergent BD clustersFootnote 6 . One cluster, labeled relatively intact, performed equivalently to HCs on the domains of WM, VerL, VisL, RPS and SC, with slightly worse performance in SOP and AV (range ±0.12 to −0.38 v. HCs). The second cluster, labeled mild-moderate, was significantly impaired across all cognitive domains in comparison with HCs, but with effects ranging from 0.4 to 1.3 s.d.s below the HC means. The third cluster, labeled relatively severe, showed widespread impairment across all domains relative to HCs, but with more severe performance deficits ranging from 0.9 to 2.4 s.d.s below HCs. Although there was differentiation between the BD clusters on most domains, the mild-moderate and relatively severe clusters were equivalent in performance on VisL and RPS domains and the relatively intact and mild-moderate clusters were equivalent in terms of SC.
BD cluster distributions are shown in Fig. 2a . No significant differences manifested between the clusters for age, gender distribution, BPRS scores, mood state, diagnostic subtype or psychosis history (Table 1). Across all cognitive domains, there were no differences between symptomatic or euthymic patients in any of the clusters (e.g. relatively intact euthymic v. symptomatic; mild-moderate euthymic v. symptomatic and relatively severe euthymic v. symptomatic; all p’s > 0.5). The relatively intact cluster had significantly higher pre-morbid IQ scores than the relatively severe and the mild-moderate clusters, who showed trending differences between themselves (Table 1). Only scores for the latter clusters were significantly reduced compared with HCs.
Comparison of clustered profiles between SZ and BD
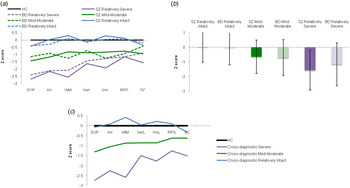
Although frequency of assignment to each cluster was significantly different by diagnosis (see online Supplementary Table S3), visual inspection of the emergent cluster profiles in SZ and BD indicated similarity in the clustering outcomes between them; similar patterns across domains and similar magnitude effects compared with HCs were evident (Fig. 1a ). The relatively intact SZ and BD clusters did not significantly differ on any cognitive domains (all p's > 0.05). The mild-moderate SZ and BD clusters did not differ on three domains (AV, VerL and RPS), with effect size differences on the other domains in the small to medium range (0.2–0.5). The relatively severe clusters had similarly sized performance deficits on four (SOP, AV, VerL and RPS) domains, with large effect size differences evident only for WM and SC. Pre-morbid IQ scores between corresponding SZ and BD clusters did not differ (e.g. SZ relatively intact v. BD relatively intact etc.; all p's > 0.5) (Fig. 1b ). Discriminant functions analyses (DFAs) predicting corresponding cluster membership based on diagnosis (e.g. relatively intact BD v. relatively intact SZ) indicated poor classification accuracy in all three analyses; BD participants were misclassified into the corresponding SZ cluster at a rate of more than 64% in analyses of both relatively severe and mild-moderate SZ/BD clusters. Only 2.7% of SZ participants were correctly classified in the relatively intact DFA (see online Supplementary Table S4).
Cognitive profile and pre-morbid intelligence quotient (IQ) comparisons of newly derived schizophrenia (SZ), bipolar disorder (BD) and cross-diagnostic clusters standardized against healthy control (HC) values (mean = 0, s.d. = 1). (a) Cognitive domain scores comparing SZ clusters with BD clusters. Mild-moderate SZ/BD significant differences: speed of processing (SOP) d = 0.37, working memory (WM) d = 0.52, visual learning (VisL) d = 0.20, social cognition (SC) d = 0.50. Relatively severely SZ/BD significant differences: WM d = 0.46, VisL d = 0.77, SC d = 0.71. (b) Pre-morbid IQ scores. (c) Cross-diagnostic clustering. AV, Attention/vigilance; VerL, verbal learning; RPS, reasoning and problem solving. Error bars represent standard deviations. For a color figure, see the online version of the paper.

Cross-diagnostic analyses
Cross-diagnostic reanalysis of all clinical participants replicated the three-cluster solution found in the diagnostic groups independently, both in quantitative magnitude of effects and qualitative patterns across domains. A relatively intact cluster performed equivalently to HCs on all domains except WM and VisL, where performance was slightly superior (p < 0.05); and SC, where performance was slightly worse (p < 0.05). A mild-moderate cluster was significantly impaired across all domains of cognition in comparison with HCs, but with effects ranging from 0.6 to 1.3 s.d.s below the HC means. A relatively severe cluster also showed impairment across all domains relative to HCs, with more severe performance deficits ranging from 1.2 to 2.7 s.d.s below HCs (Fig. 1c ).
Of the cases that fell into each of the clusters in the independent BD or SZ analyses, 81.3% fell into the corresponding cluster in the overall cross-diagnostic analysis (see online Supplementary Table S5). There was also significantly less error variation for the cross-diagnostic method than the separate BD/SZ clustering methods in the case of SOP, AV, WM and the composite score (all p's =/< 0.05). There were no differences in error variation between clustering methods for the remaining cognitive domains.
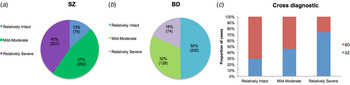
The cross-diagnostic clusters differed significantly in terms of the distribution of the proportion of SZ/BD participants comprised within each cluster (χ2 2 = 92.59, p < 0.001); the relatively intact cluster contained a greater proportion of BD relative to SZ participants, whilst the mild-moderate and relatively severe clusters contained a greater proportion of SZ relative to BD participants (Fig. 2c ). A step-down pattern was evident in terms of pre-morbid IQ: the relatively severe cluster had the lowest scores (1.5 s.d.s below HCs); the mild-moderate cluster had scores 0.6 s.d.s below HCs; and the relatively intact cluster did not differ from HCs. All pre-morbid IQ scores significantly differed between the emergent cross-diagnostic clusters.
Percentage distribution of cases falling into each cluster when classified within categorical diagnoses and a cross-diagnostic approach. (a) Schizophrenia (SZ) clusters. (b) Bipolar disorder (BD) clusters. Numbers in parentheses in (a) and (b) represent the sample number per cluster. (c) Cross-diagnostic clusters: the proportion of BD or SZ participants (relative to the total sample number for each cohort) falling into each cluster. For a color figure, see the online version of the paper.

Discrepancy and dispersion analysis in emergent cross-diagnostic clusters
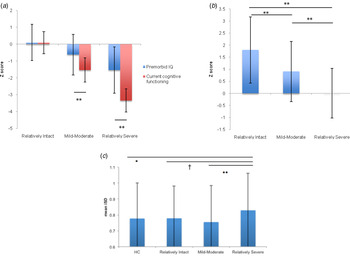
Given that performance variation for some domains was significantly reduced for the cross-diagnostic clustering method compared with independent diagnostic clustering, discrepancy and dispersion analysis was conducted on the emergent cross-diagnostic clusters only. The HCs and relatively intact cross-diagnostic cluster showed ‘stable’ performance in pre-morbid IQ v. current cognitive functioning (t 574 = 0.00, p < 0.999 and t 192 = 0.063, p < 0.95), whilst the mild-moderate and relatively severe clusters showed a ‘decline’, with current cognitive functioning lower than pre-morbid IQ scores (t 500 = 16.27, p < 0.001 and t 269 = 21.64, p < 0.001, respectively) (Fig. 3a ). Discrepancy effects (the difference between pre-morbid IQ and current cognitive functioning) differed between cross-diagnostic clusters (F 3,1535 = 93.50, p < 0.001); they were larger in the relatively severe compared with the mild-moderate clusters (p < 0.001), but scores in both groups significantly differed from the relatively intact cluster and HC group (p < 0.001). These latter two clusters, in turn, did not differ from each other (p > 0.99) (Fig. 3b ).
Analysis of estimated cognitive course in the cross-diagnostic clusters. (a) Estimated pre-morbid intelligence quotient (IQ) v. current cognitive functioning [Z scores are standardized against healthy control (HC) mean/s.d.]. (b) Discrepancy score indicating estimated improvement or decline in cognition (Z scores are standardized against HC mean/s.d.). Larger scores indicate greater discrepancy between pre-morbid IQ and current cognitive functioning. (c) Dispersion (mean individual standard deviation; is.d.) of cognitive domain scores. * p = 0.01, ** p = 0.000, † p = 0.06. Error bars represent standard deviations. For a color figure, see the online version of the paper.

Differences were also observed in the dispersion of variance on cognitive tests between groups (F 3,1537 = 6.42, p < 0.001). Dispersion, a measure of intra-individual variability, was increased in the relatively severe cross-diagnostic cluster compared with HCs (p = 0.012), the mild-moderate cross-diagnostic cluster (p < 0.001) and the relatively intact cross-diagnostic cluster (trend level p = 0.063). Dispersion scores did not differ between the relatively intact or mild-moderate cross-diagnostic clusters (p = 0.549) and neither of these clusters differed from HCs (p = 0.375 and p > 0.999, respectively) (Fig. 3c ).
Exploratory cross-diagnostic factor analysis and reclassification
Given the possibility that severity differences in the cross-diagnostic clusters could be accounted for by differences in an underlying general cognitive factor ‘g’ (Fig. 1c ), we explored whether the three-cluster cross-diagnostic solution would hold if the factorial structure of the combined patient sample was actually unidimensional. An exploratory factor analysis indicated a single-factor solution in the combined patient data explaining 40.5% of the variance and comprising all of the cognitive domains employed as the clustering variables in the previous HCAs. When the unidimensional factor score was used as a clustering variable in a subsequent HCA, the three-cluster solution was replicated with the three new clusters showing good correspondence (cross-over = 89%) to the original cross-diagnostic subgroups (see online Supplementary Figs S3 and S4, and Tables S6 and S7)Footnote 7 .
Discussion
This study examined the structure of cognitive heterogeneity on the SZ–BD spectrum in a large sample, demonstrating evidence of correspondence between the cognitive clustering outcomes across disorders. A data-driven hierarchical clustering approach indicated the presence of three cognitive subgroups in the SZ and BD groups, and in the combined patient sample. In SZ and BD patients, the three emergent clusters were differentiated in the extent to which they were impaired relative to HCs, such that each disorder encompassed three impairment subgroups: relatively severe, mild to moderate, and relatively intact. These findings align with previous work indicating that cognitive variability is anchored by spared and severely impaired subgroups of SZ or BD patients (Burdick et al. Reference Burdick, Russo, Frangou, Mahon, Braga, Shanahan and Malhotra2014; Lewandowski et al. Reference Lewandowski, Sperry, Cohen and Öngür2014; Bora et al. Reference Bora, Hıdıroğlu, Özerdem, Kaçar, Sarısoy, Civil Arslan, Aydemir, Cubukcuoglu Tas, Vahip, Atalay, Atasoy, Ateşci and Tümkaya2016). Aside from lower symptom scores and more females in the relatively intact SZ subgroup, no other demographic factors predicted subgroup membership in either disorder. Pre-morbid IQ scores, however, were always lowest in the most impaired cognitive subgroups.
Although the numbers of subgroups for SZ and BD were identical, the frequency of assignment into each subgroup differed by diagnosis. BD patients were over-represented in the relatively intact subgroup and SZ patients over-represented in the relatively severe subgroup. This important point of differentiation between the disorders may help to explain why diagnostic comparisons using measures of central tendency are weighted toward greater magnitude deficits in SZ than BD. Nonetheless, the mere presence of some BD patients in a more severely impaired subgroup and some SZ patients in a relatively intact subgroup suggests that the traditional method of mean-level disorder comparisons is inadequate; critically, some BD patients do appear to have similar magnitudes of severe impairment as those commonly seen in SZ.
Indeed, the corresponding SZ and BD subgroups were very similar in the magnitudes of their cognitive performance for a number of domains assessed, despite differences in their sample numbers; and each paired group was poorly statistically differentiated from each other. Thus, with the exception of social cognition, the common observation of quantitative performance differences in group-wise comparisons of SZ and BD did not generally hold when cognitive heterogeneity was factored into our sampleFootnote 8 . The overlap between the more homogeneous BD and SZ subgroups seen here, both qualitative and quantitative, may index common disease processes that contribute to different cognitive outcomes irrespective of differences in overt disease presentation.
Critically, our cross-diagnostic clustering analysis produced less error variance than the independent diagnostic clustering, suggesting that this method may be a useful means of studying factors contributing to differing cognitive phenotypes in these disorders. That the cross-diagnostic cluster solution was replicated using only a general cognitive factor as a clustering variable suggests that a ‘g’ factor can be examined with some confidence in empirical clustering studies in even larger, ‘messier’ datasets that comprise different cognitive batteries. This has obvious implications for the genomic analyses of large-scale datasets focused on intra-individual differences in cognition in BD and SZ (Harvey et al. Reference Harvey, Siever, Huang, Muralidhar, Zhao, Miller, Aslan, Mane, McNamara, Gleason, Brophy, Przygodszki, O'Leary, Gaziano and Concato2014, Reference Harvey, Aslan, Du, Zhao, Siever, Pulver, Gaziano and Concato2016), and studies measuring the overlap between cognition and risk for psychiatric disease more broadly (Gale et al. Reference Gale, Deary, Boyle, Barefoot, Mortensen and Batty2008; Lencz et al. Reference Lencz, Knowles, Davies, Guha, Liewald, Starr, Djurovic, Melle, Sundet, Christoforou, Reinvang, Mukherjee, DeRosse, Lundervold, Steen, John, Espeseth, Räikkönen, Widen, Palotie, Eriksson, Giegling, Konte, Ikeda, Roussos, Giakoumaki, Burdick, Payton, Ollier, Horan, Donohoe, Morris, Corvin, Gill, Pendleton, Iwata, Darvasi, Bitsios, Rujescu, Lahti, Hellard, Keller, Andreassen, Deary, Glahn and Malhotra2014; Hatzimanolis et al. Reference Hatzimanolis, Bhatnagar, Moes, Wang, Roussos, Bitsios, Stefanis, Pulver, Arking, Smyrnis, Stefanis and Avramopoulos2015; Hill et al. Reference Hill, Davies, Liewald, McIntosh and Deary2016).
Both relatively severe and mild-moderate cross-diagnostic subgroups had lower estimated pre-morbid IQ scores than HCs here. The step-down pattern between the two subgroups, however, suggests a potentially stronger influence of neurodevelopmental factors in the disease course of patients with a more severe cognitive burden. Both subgroups also showed significant discrepancies in estimated pre-morbid IQ v. current cognitive performance, possibly reflecting a ‘decline’ in the course of intellectual functioning and, subsequently, neuroprogression. Although speculative, this more pronounced pattern in the relatively severe subgroup is consistent with the concept of reduced cognitive reserve (Barnett et al. Reference Barnett, Salmond, Jones and Sahakian2006; Stern, Reference Stern2009), whereby greater neurobiological liability or poorer pre-morbid intellectual neurodevelopment is thought to be associated with greater cognitive degeneration.
The intra-individual dispersion of variance across subtests was more pronounced in the relatively severe cross-diagnostic subgroup – the only one to differ significantly from HCs. Increased intra-individual variation in cognitive subtest performance is increasingly recognized as a measure of accelerated aging (MacDonald et al. Reference MacDonald, Nyberg and Bäckman2006; Morgan et al. Reference Morgan, Woods, Delano-Wood, Bondi and Grant2011; Kälin et al. Reference Kälin, Pflüger, Gietl, Riese, Jäncke, Nitsch and Hock2014). Converging evidence suggests a link between such increased variation and various markers of neural integrity (MacDonald et al. Reference MacDonald, Li and Bäckman2009; Garrett et al. Reference Garrett, Kovacevic, McIntosh and Grady2011). These neural factors may be genetically influenced (Lacritz & Cullum, Reference Lacritz and Cullum1998; Barnett et al. Reference Barnett, Salmond, Jones and Sahakian2006; MacDonald et al. Reference MacDonald, Li and Bäckman2009), suggesting that the cognitive outcomes of the emergent subgroups may represent the manifestation of partially divergent etiologies that affect the neural processing systems mediating cognition. This remains speculative and future confirmatory work is necessary.
To our knowledge this is the largest clustering analysis using a validated cognitive battery in both BD and SZ individuals, and the first to explicitly examine heterogeneity when comparing these disorders on the basis of cognition. However, there are some caveats. First, we were unable to account for the effects of medication in the sample, given limited data. Second, different scales were used to assess mania/depression symptoms in the BD patients, which limited our ability to compare continuous symptom scores across subgroups. However, attempts were made to determine the influence of these variables by categorizing patients as symptomatic v. euthymic. Although we found no differences in the distribution of these symptom subgroups per cluster and no differences in cognitive performance between symptomatic and euthymic patients within each cluster, we cannot discount that this may have had an effect on the results. Third, it can be argued that some of the MCCB subtests may not be sufficiently sensitive to detect cognitive deficits in BD. For example, the MCCB contains only one measure of executive functioning that assesses reasoning and problem solving [Neuropsychological Assessment Battery (NAB)-Mazes]. This measure has not been widely assessed in BD and elicits smaller effects than those seen for measures of set shifting and response inhibition (Bora et al. Reference Bora, Yucel and Pantelis2009a ; Burdick et al. Reference Burdick, Goldberg, Cornblatt, Keefe, Gopin, Derosse, Braga and Malhotra2011; Van Rheenen & Rossell, Reference Van Rheenen and Rossell2014). Although it is possible that this may have influenced our findings, the results of the factor analysis indicating that our subgroups are reflective of differences in an underlying ‘g’ factor suggest that any potential influence is unlikely to have been substantial. Fourth, there were some VerL test scores derived from the CVLT-II. Although this had a possible influence on the results, past work has shown the total recall of words on the CVLT-II and HVLT-R to be highly correlated (Lacritz et al. Reference Lacritz, Cullum, Weiner and Rosenberg2001). Although this does not suggest that these tests have similar efficacy in these patient groups, our BD clustering solution was replicated when we excluded the patients without HVLT-R scores. Further, our results indicated that three clusters still emerge when using a general cognitive factor as the clustering variable. Thus, combining the CVLT-II and the HVLT-R into a single domain is likely to have had a minimal effect on the clustering outcomes in these data. Fifth, the cross-sectional design of this study limited our ability to directly assess differences between subgroups in terms of estimated decline or stability in intellectual functioning; therefore proxy measures were derived. Finally, due to limitations in the availability of clinical/demographic data across sites, we could not compare confounders such as treatment history, socio-economic status, race/ethnicity, years of education, age of onset or hospitalization and episode history, the latter of which may contribute to identifying neurodevelopmental or neuroprogressive factors that influence outcome in each of the subgroups.
One further point warrants discussion. This relates to the argument that these cognitive subgroups are not necessarily reflective of distinct ‘subtypes’, but rather a simple reflection of a spectrum of cognitive ability that crosses diagnostic boundaries. This argument cannot be fully addressed with the present data. However, our findings of differences in pre-morbid IQ, estimated cognitive decline and intra-individual variability do indicate that the underlying pathways leading to the different cognitive outcomes seen here are not likely to be wholly overlapping between subgroups. In more comprehensive SZ and BD datasets with biological or neuroimaging data available, the classification of individuals into more homogeneous subgroups – even within a spectrum – may therefore prove a useful means by which to determine if there are biological or clinical differences amongst individuals with these disorders. This will guide future targeted enquiries into the influential factors that lead some individuals with SZ or BD to experience severe cognitive impairment, whilst others remain cognitively spared (Clementz et al. Reference Clementz, Sweeney, Hamm, Ivleva, Ethridge, Pearlson, Keshavan and Tamminga2016). It will also probably have implications for the formulation of preventative strategies or treatment, where a one-size-fits-all approach is not effective for all patients.
In sum, our work supports previous findings of qualitative overlaps in the cognitive profiles of SZ and BD. However, it goes further by demonstrating the utility of considering cognitive heterogeneity when characterizing these overlaps, such that quantitative similarities also become apparent. Indeed, the current findings indicate correspondence in the profiles of more homogeneous subgroups of BD and SZ patients; while there are clear differences in the number of patients with either disorder who fall into each subgroup, the pattern and extent of cognitive ability within those subgroups is similar for most domains of general cognition. In fact in these data, the structure of heterogeneity is best portrayed cross-diagnostically, by classifying three subgroups with similar cognitive profiles that differ from each other in terms of the severity of their general cognitive performance. Such findings may assist in the search for influences on different cognitive outcomes in SZ and BD, and may help to target cognitive remediation treatments at differing levels of impairment severity irrespective of diagnosis.
Supplementary material
The supplementary material for this article can be found at https://doi.org/10.1017/S0033291717000307
Acknowledgements
This research was supported by the Australian National Health and Medical Research Council [fellowships to T.E.V.R. (APP1088785) and C.G. (APP546262) and project grant to S.L.R. (APP1060664)], the Helen McPherson Smith Trust (to T.E.V.R., S.L.R.), the Australian Rotary Health/Bipolar Expedition (to T.E.V.R., S.L.R.), the National Institute of Mental Health (MH101267; R01 MH102257, R03MH079995; K23MH077807; R01MH100125 to K.E.B.; K23MH091210 to K.E.L.; K24MH104449 to D.O.) and the Veterans Health Administration (I01CX000995 to K.E.B.).
The authors would like to thank Daniela Calafiore and Lesley Norris for their assistance with data entry.
Declaration of Interest
K.E.B. has served on advisory boards for Sumitomo Dainippon Pharma, Takeda-Lundbeck and NeuralStem, which had no impact upon the work presented in this paper.