1 Introduction
Bypass transition to turbulence in boundary-layer flows is known to proceed via the appearance of localised turbulent spots on a background of streamwise streaks (Kendall Reference Kendall1998; Matsubara & Alfredsson Reference Matsubara and Alfredsson2001; Brandt, Schlatter & Henningson Reference Brandt, Schlatter and Henningson2004; Zaki & Durbin Reference Zaki and Durbin2005). These spots expand aggressively and fill the plate with turbulent motion further downstream (Emmons Reference Emmons1951). Bypass transition is usually described as a two-step process. During the receptivity phase (Saric, Reed & Kerschen Reference Saric, Reed and Kerschen2002), ambient perturbations (e.g. free-stream turbulence or delocalised noise) enter the boundary layer and are converted into streamwise streaks, while in the second phase these streaks become unstable and break down to form turbulent spots. The receptivity phase is usually associated with linear mechanisms, while the secondary instability has traditionally been investigated by linearising around a saturated streaky base flow (Andersson et al.
Reference Andersson, Brandt, Bottaro and Henningson2001). On a fundamental level, this picture of transition is not entirely satisfying because (i) it is essentially based on disconnected linear steps, (ii) the streaks do not form a regular pattern and their stability must be investigated case by case, and (iii) secondary stability analysis uses spatially extended modes and therefore fails to explain the localised nature of the ensuing spots. Despite years of effort to understand the nucleation of a turbulent spot using secondary instability concepts, there has been no accepted consensus to distinguish the perturbations leading to turbulence from those experiencing viscous decay. In wall-bounded flows such as plane Couette or Poiseuille flows, turbulent structures can also emerge from localised disturbances, even when the laminar base flow is linearly stable. This has led recently to the abstract nonlinear concept of a laminar–turbulent boundary in state space. According to this picture, a manifold of codimension one separates initial perturbations that rapidly decay from those experiencing turbulent evolution (Itano & Toh Reference Itano and Toh2001; Skufca, Yorke & Eckhardt Reference Skufca, Yorke and Eckhardt2006; Schneider, Eckhardt & Yorke Reference Schneider, Eckhardt and Yorke2007). States on this manifold, i.e. time evolutions that neither become turbulent nor return to laminar, are attracted towards a particular state in this manifold, the edge state. This picture carries over to extended systems where the edge state displays robust spatial localisation (Duguet, Schlatter & Henningson Reference Duguet, Schlatter and Henningson2009; Mellibovsky et al.
Reference Mellibovsky, Meseguer, Schneider and Eckhardt2009; Willis & Kerswell Reference Willis and Kerswell2009; Schneider, Marinc & Eckhardt Reference Schneider, Marinc and Eckhardt2010; Zammert & Eckhardt Reference Zammert and Eckhardt2014). The perturbation energy of such edge states is notoriously low, but not as low as the minimal seed considered in recent studies, itself also a point on the laminar–turbulent boundary (Duguet et al.
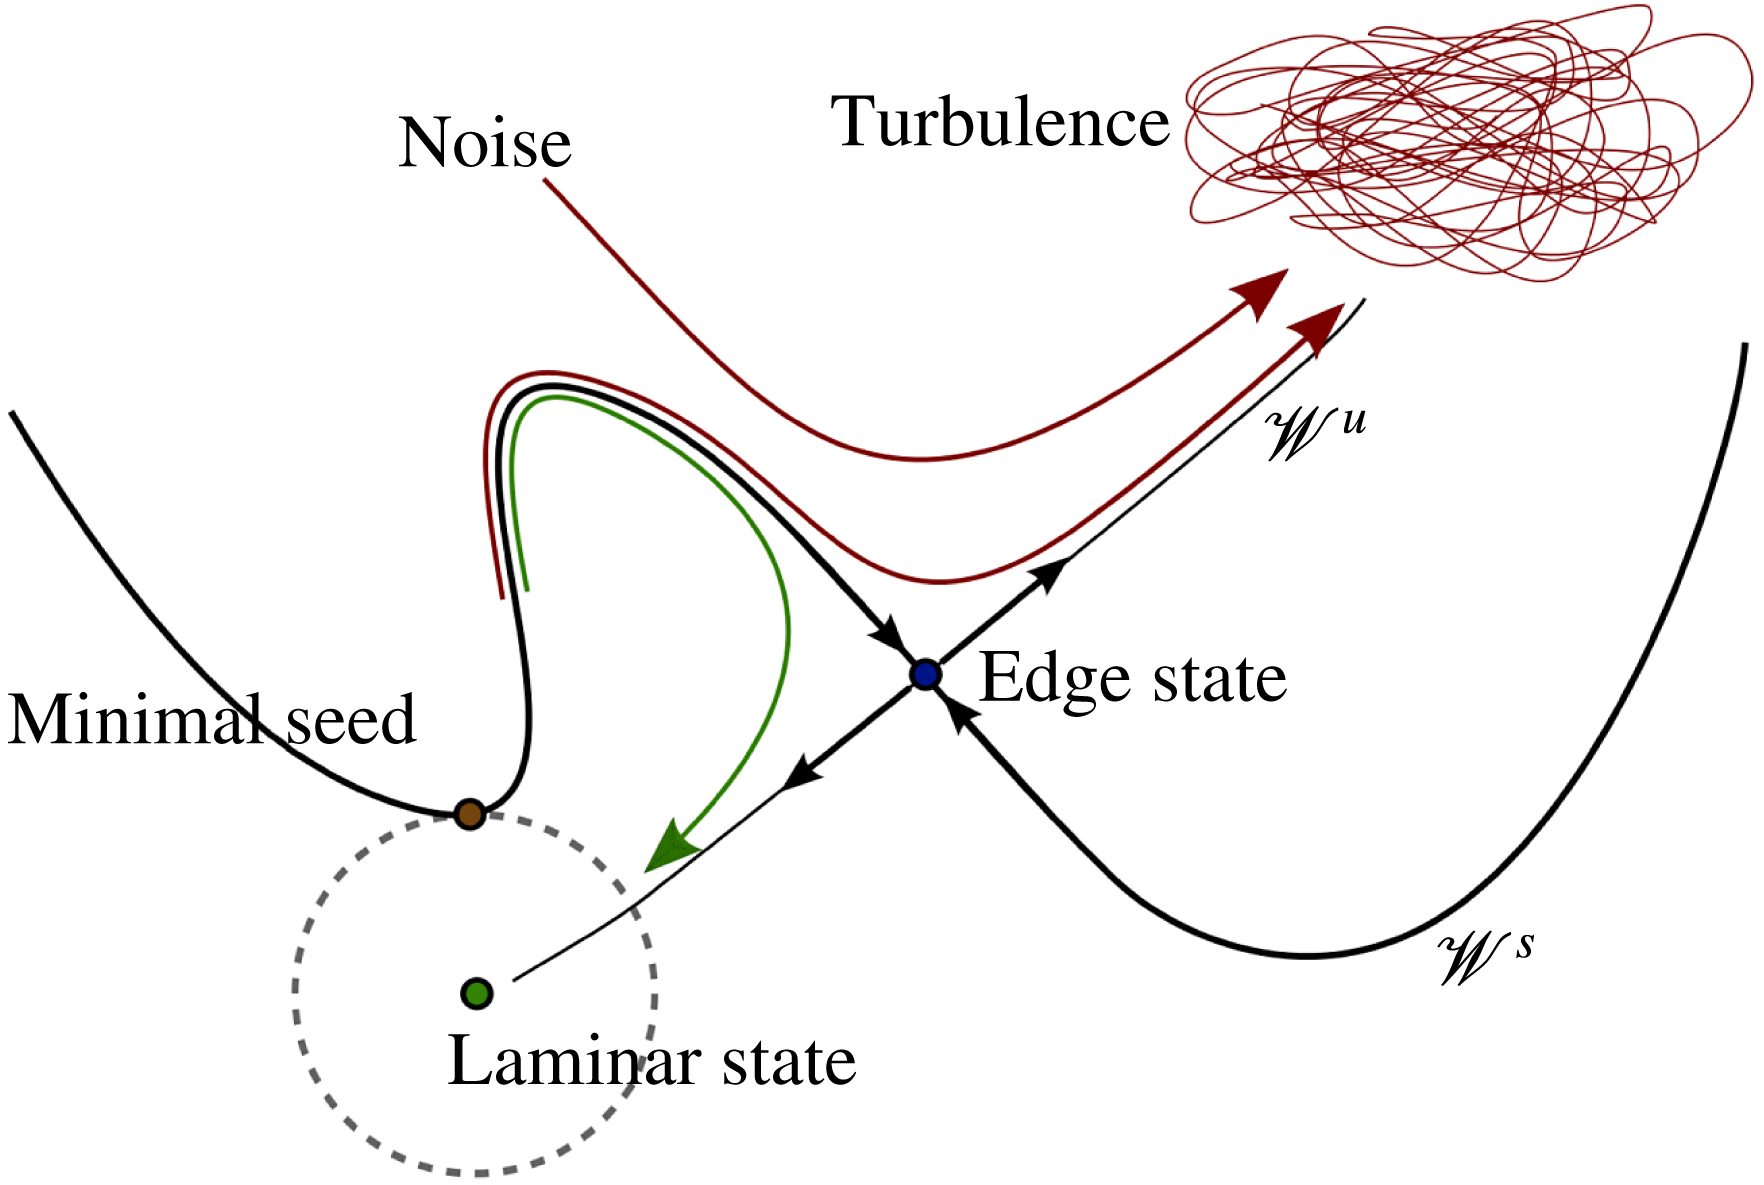
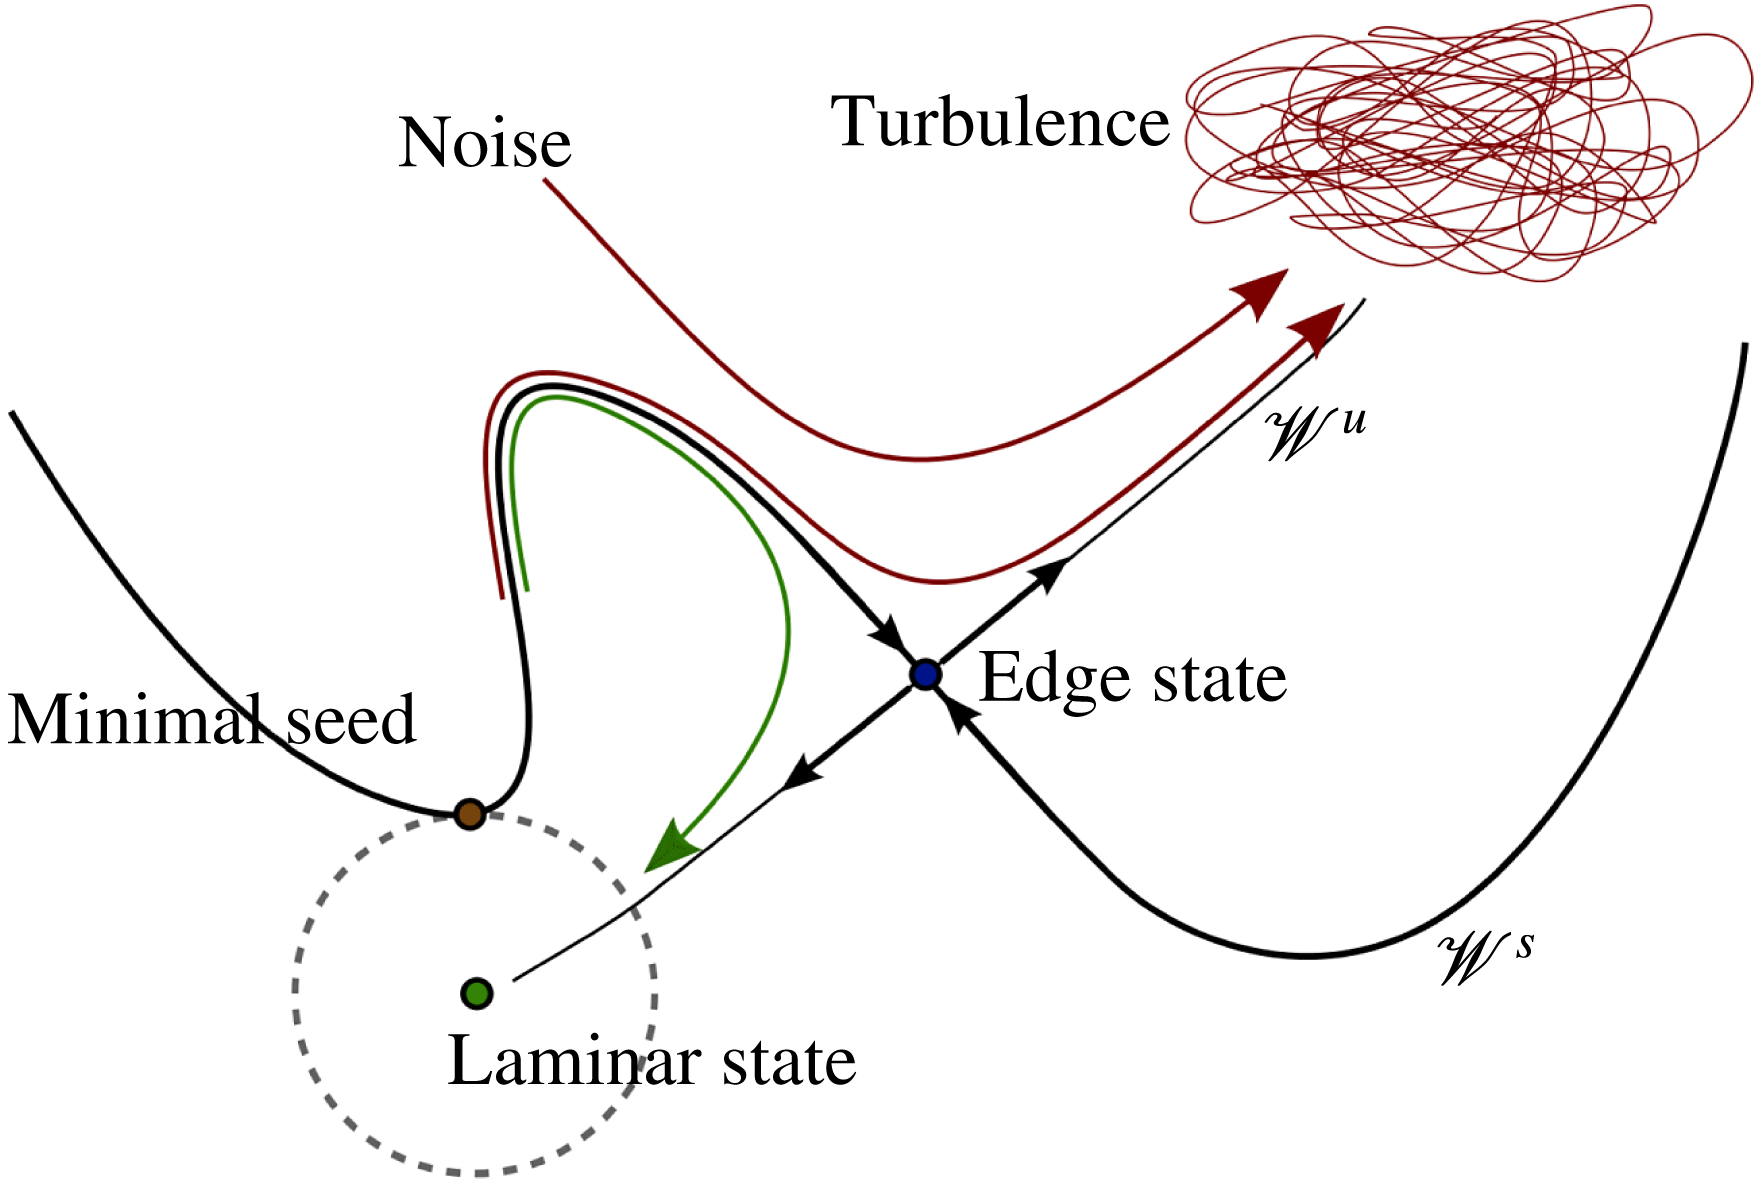
Reference Duguet, Monokrousos, Brandt and Henningson2013; Kerswell, Pringle & Willis Reference Kerswell, Pringle and Willis2014). Independently of its temporal dynamics (steady, periodic or even chaotic), the edge state represents a saddle in the global state space of the system (see figure 1). Trajectories initiated arbitrarily close to its stable manifold
 $\mathscr{W}^{s}$
approach the neighbourhood of the edge state for a short time, before being flung away along its unstable manifold
 $\mathscr{W}^{u}$
. Non-localised initial perturbations are no exception (Duguet, Willis & Kerswell Reference Duguet, Willis and Kerswell2010b
; Schneider et al.
Reference Schneider, Marinc and Eckhardt2010). As a consequence, even initial noise with a carefully selected amplitude evolves into a localised seed that later spreads like a turbulent spot. It is noteworthy that finite-amplitude noise (with a less constraint amplitude) also dissipates and leaves a streaky background from which isolated turbulent spots emerge (see, e.g., Duguet, Schlatter & Henningson (Reference Duguet, Schlatter and Henningson2010a
) in plane Couette flow). The visual resemblance between localised edge states and incipient turbulent spots has also been noted, but never quantified. This leads to the following questions. Can the spot nucleation process be described efficiently using this geometric state-space picture involving the edge state? How far can this concept also be extended to realistic bypass transition in boundary-layer flows?
Sketch of the state space. The basin boundary coincides with the stable manifold
 $\mathscr{W}^{s}$
of the edge state;
 $\mathscr{W}^{u}$
is its unstable manifold and points either towards the laminar state or to the turbulent attractor. The minimal seed is the point on the edge closest to the laminar state in energy norm. The edge state is shown as a point in this representation independent of its temporal dynamics (regular or chaotic).
Edge states have also recently been identified in linearly stable boundary-layer flows, by considering localised initial disturbances to the laminar base flow, and varying their amplitude, until the dynamics reaches an unstable equilibrium regime, characterised by robust spatial localisation (Cherubini et al. Reference Cherubini, De Palma, Robinet and Bottaro2011; Duguet et al. Reference Duguet, Schlatter, Henningson and Eckhardt2012). Spatially developing boundary layers, despite their ubiquitous importance in nature and industry, are only poorly adapted to edge-state computations, because the slow spatial growth complicates the search for an asymptotically defined flow regime. The asymptotic boundary layer (ASBL) is another boundary-layer flow, where suction at the wall equilibrates the growth of the boundary layer. The laminar flow solution, as well as the corresponding turbulent mean profile, is hence streamwise- and time-independent. The ASBL appears better suited to long-time edge-state computations, because it can be simulated using periodic boundary conditions (Kreilos et al. Reference Kreilos, Veble, Schneider and Eckhardt2013; Khapko et al. Reference Khapko, Kreilos, Schlatter, Duguet, Eckhardt and Henningson2013, Reference Khapko, Duguet, Kreilos, Schlatter, Eckhardt and Henningson2014).
The present investigation consists of two parts. In the first part, the edge state of the ASBL is computed in a numerical domain sufficiently large to allow for three-dimensional localisation. Its chaotic dynamics is investigated and compared with former computations in more constrained geometries. In a second part, a set of numerical simulations of the ASBL are analysed, initiated using different realisations of random noise. The current emphasis is on identifying the signature of the edge state during spot nucleation. In an effort to match realistic operating conditions, no special discrete symmetry has been imposed in the computations, and the amplitude of the initial noise in the second part has been chosen arbitrarily (no bisection performed). The results indicate that localised edge states act as state-space mediators during the process of spot nucleation.
2 Flow case and numerical methodology
An asymptotic suction boundary layer forms when fluid flows above a porous flat plate subject to constant uniform suction (Griffith & Meredith Reference Griffith and Meredith1936). Suction balances the natural spatial growth of the boundary layer, eventually leading to a streamwise-independent flow. The laminar flow solution reads
 $u(y)=U_{\infty }(1-\text{e}^{-yV_{S}/{\it\nu}}),v=-V_{S}$
, with
 $u$
and
 $v$
the streamwise and wall-normal velocity components,
 $y$
the distance from the wall,
 $U_{\infty }$
the free-stream velocity and
 ${\it\nu}$
the kinematic viscosity of the fluid. The streamwise and spanwise coordinates are denoted
 $x$
and
 $z$
. The flow is realisable in experiments (Antonia et al.
Reference Antonia, Fulachier, Krishnamoorthy, Benabid and Anselmet1988; Fransson & Alfredsson Reference Fransson and Alfredsson2003). The Reynolds number is defined classically as the ratio
 $Re=U_{\infty }/V_{S}$
, with
 $V_{S}>0$
the suction velocity. Non-dimensionalisation is based on
 $U_{\infty }$
and on the displacement thickness
 ${\it\delta}^{\ast }={\it\nu}/V_{S}$
. From this point onwards, all quantities are non-dimensional. The flow is linearly stable up to
 $Re\approx 54\,370$
(Hocking Reference Hocking1975), but finite-amplitude perturbations can sustain turbulence for
 $Re\geqslant 270$
(Khapko et al.
Reference Khapko, Schlatter, Duguet and Henningson2016). Temporal simulations are performed using the spectral code SIMSON (Chevalier et al.
Reference Chevalier, Schlatter, Lundbladh and Henningson2007), which solves the incompressible Navier–Stokes equations using Fourier discretisation in the wall-parallel directions and Chebyshev expansion in the wall-normal direction. Periodic boundary conditions are used in the Fourier directions. At the wall the no-slip condition is imposed, whereas the laminar solution is set at the top boundary. The edge state is tracked iteratively using the standard bisection procedure of Skufca et al. (Reference Skufca, Yorke and Eckhardt2006). A new bisection is started once the separation between the last two diverging trajectories of a previous bisection exceeds in norm a predefined threshold. Following Khapko et al. (Reference Khapko, Kreilos, Schlatter, Duguet, Eckhardt and Henningson2013, Reference Khapko, Duguet, Kreilos, Schlatter, Eckhardt and Henningson2014), edge computations have been performed at
 $Re=500$
where turbulence is an attractor. Two numerical domains D1 and D2 have been considered, respectively for edge tracking and noise-induced transition: D1 has dimensions
 $[L_{x},L_{y},L_{z}]=[800,15,100]$
with spectral resolution
 $(N_{x},N_{y},N_{z})=(2048,121,384)$
, whereas D2 has
 $[L_{x},L_{y},L_{z}]=[300,20,150]$
with
 $(N_{x},N_{y},N_{z})=(384,97,384)$
. The large dimensions of D1 ensure full spatial localisation of the edge state, while the choice for D2 results from a trade-off between capturing localisation and restricting the transition to a single nucleation event. Resolution requirements for edge tracking have already been assessed in smaller numerical domains (Khapko et al.
Reference Khapko, Kreilos, Schlatter, Duguet, Eckhardt and Henningson2013). The slightly lower resolution used in D2 improves the nucleation statistics without affecting the initial stages of transition.
3 Localised edge state
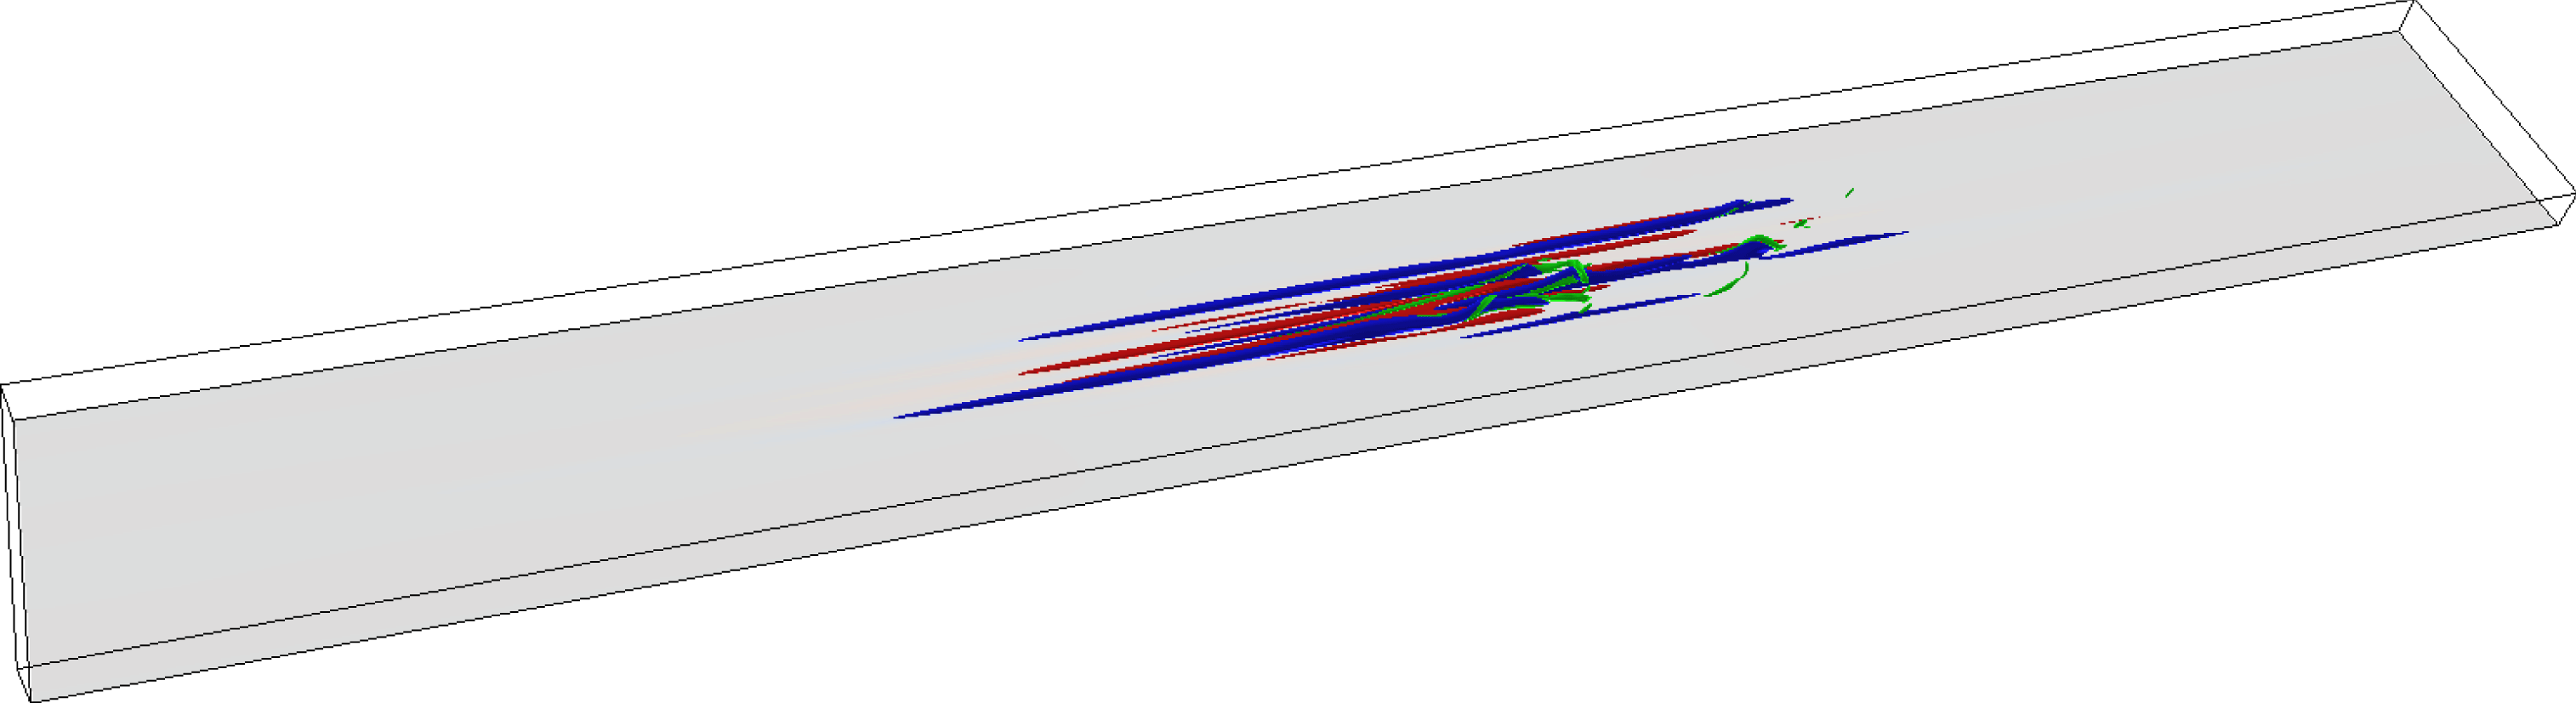
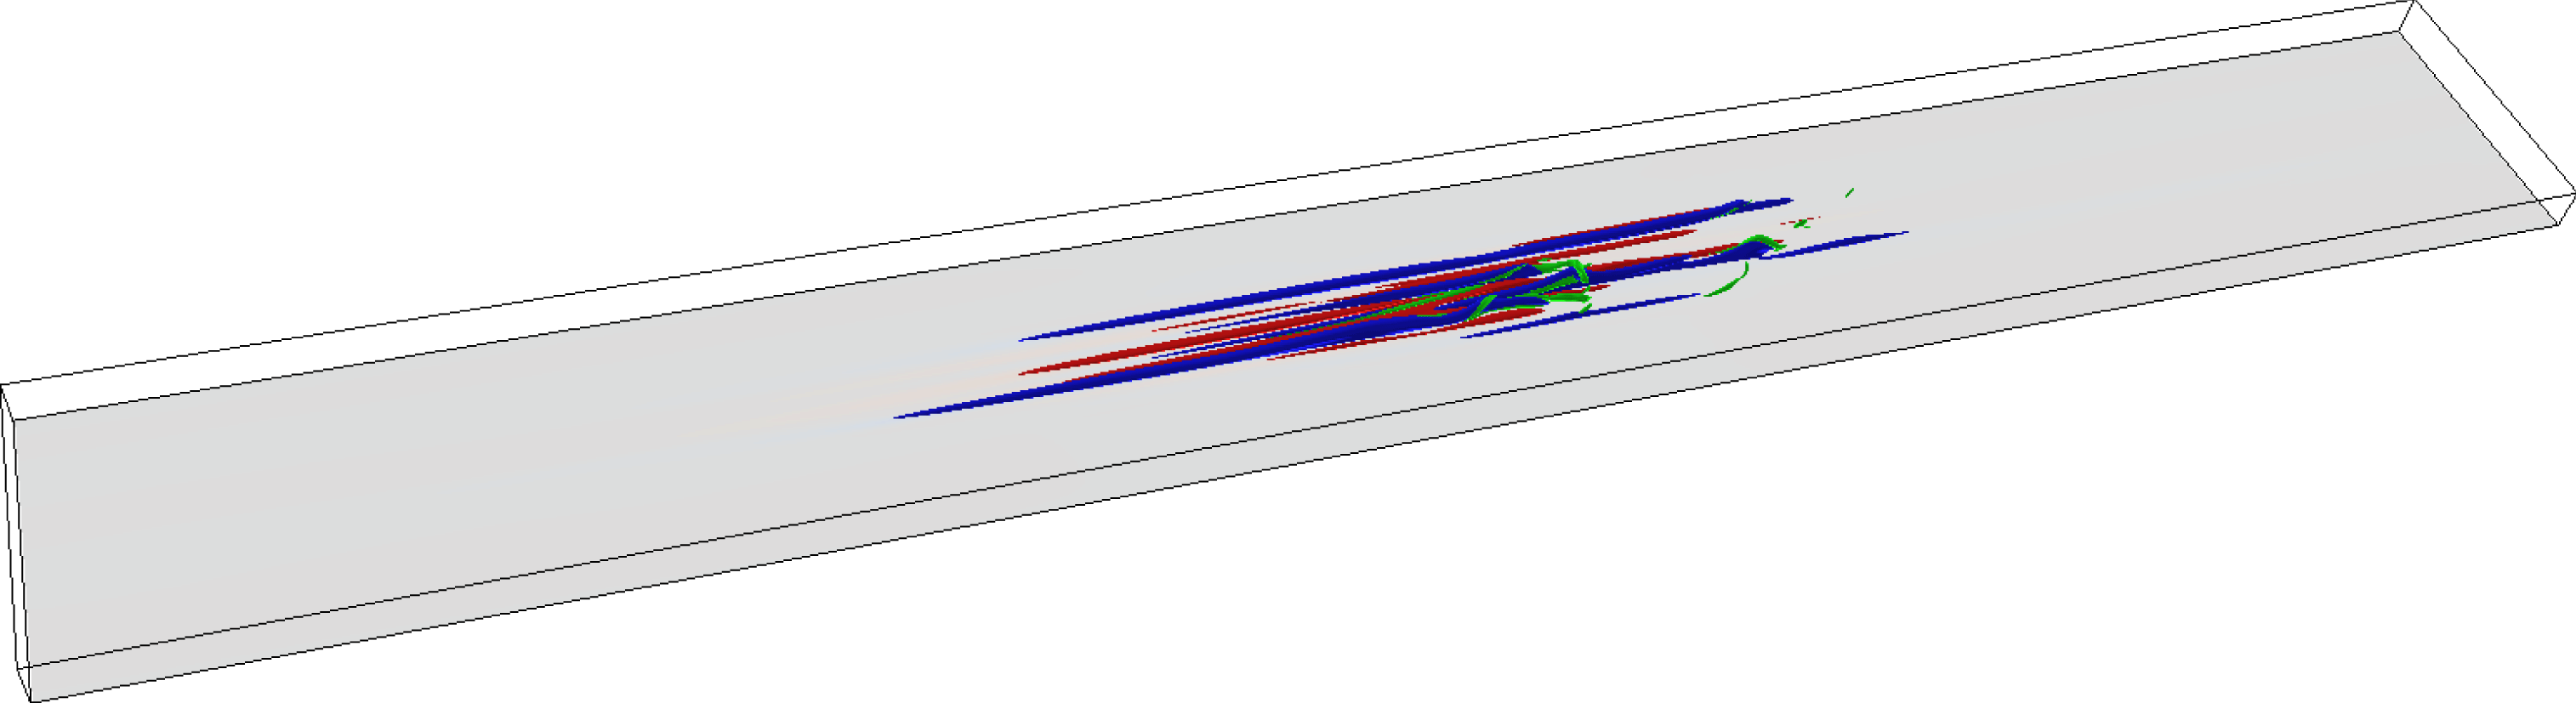
Three-dimensional snapshot of the edge state (
 $t=2.1\times 10^{4}$
, see the square in figure 4
a). Low- (blue) and high-speed (red) streaks are shown with isosurfaces of the streamwise velocity fluctuations
 $u^{\prime }=\pm 0.05$
, and vortices with
 ${\it\lambda}_{2}=-2\times 10^{-4}$
isosurfaces (green). Flow is from left to right. The whole computational domain is shown. A supplementary movie is available at http://dx.doi.org/10.1017/jfm.2016.434.
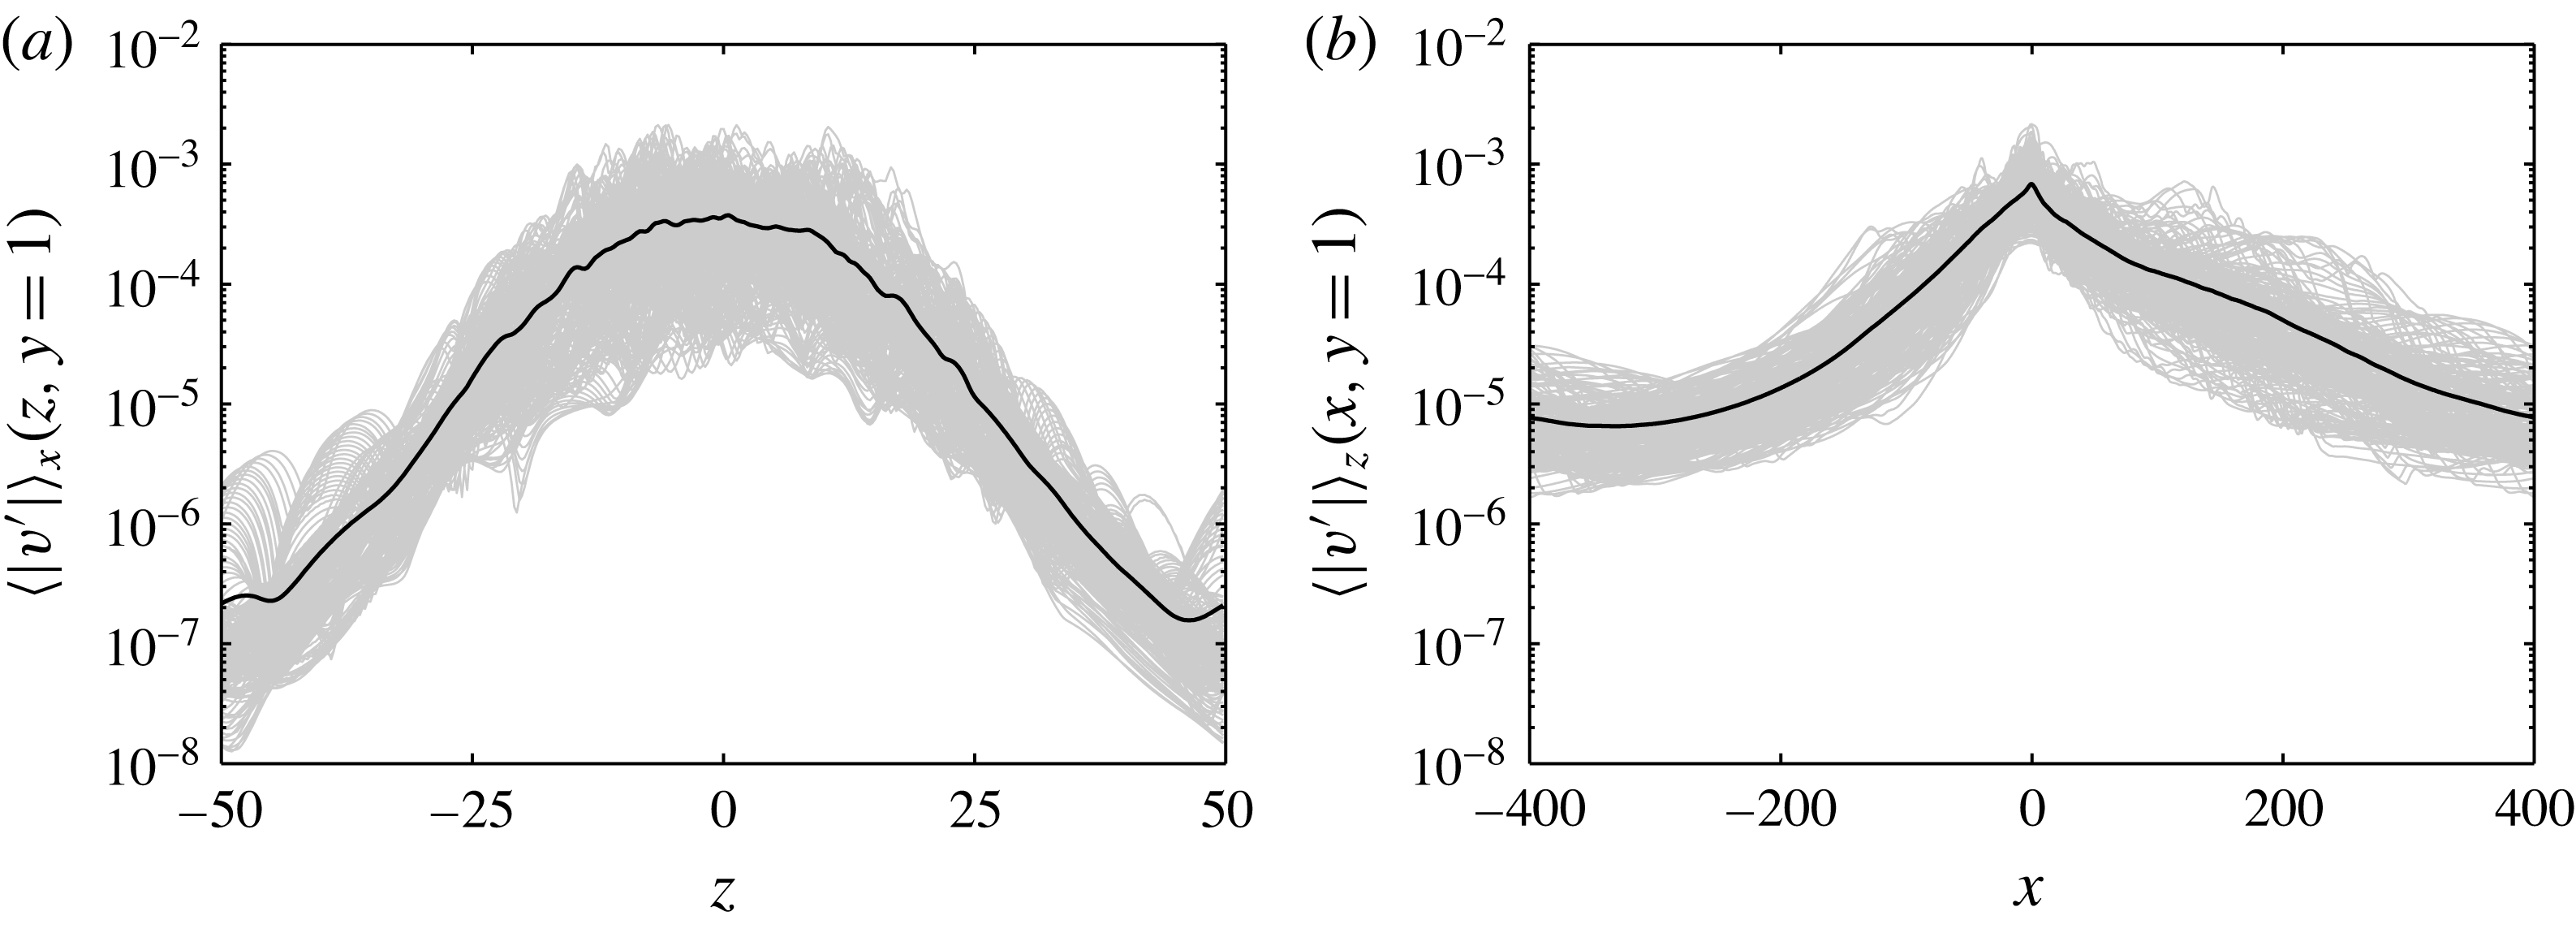
Wall-normal fluctuations
 $v^{\prime }(y=1)$
averaged in the streamwise (a) or spanwise direction (b). Instantaneous (grey) versus time-averaged (black) profiles.
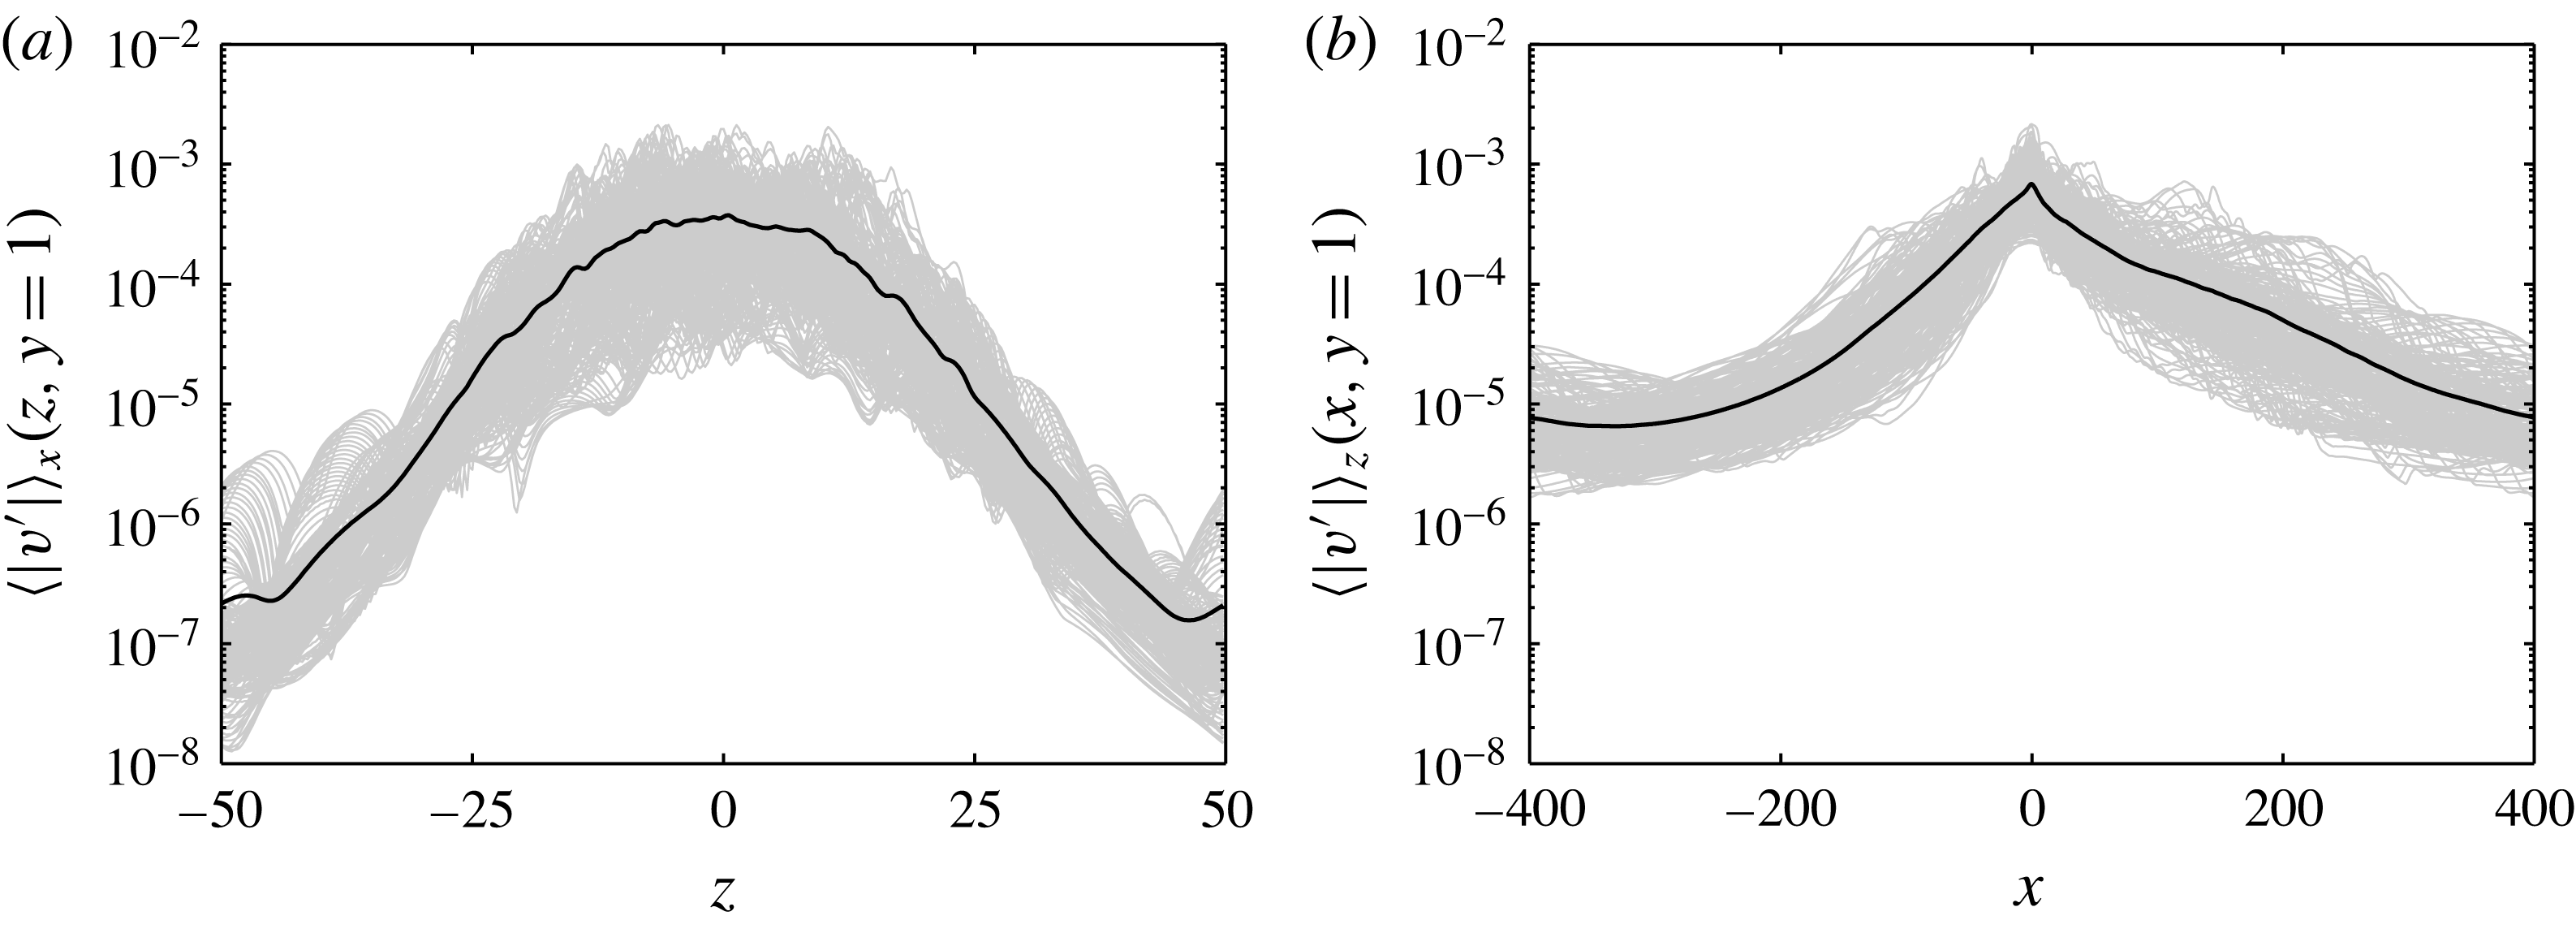
Edge tracking results asymptotically in a fully localised structure. A three-dimensional snapshot of the edge state is shown in figure 2. It consists of a few low- and high-speed streaks and streamwise vortices located mostly along one main low-speed streak. The structure resembles a turbulent spot in its early development stage, except that it neither decays nor grows in size. For slightly higher initial amplitudes, the same flow structure quickly breaks down into turbulence that spreads throughout the whole domain. Importantly, this edge state is localised in the three spatial dimensions. In the wall-normal direction it is contained within the boundary layer. Full localisation in the wall-parallel directions is demonstrated in figure 3 by considering the norm of the wall-normal fluctuations
 $|v^{\prime }|$
at
 $y=1$
. The averages of
 $|v^{\prime }|$
in the
 $x$
or
 $z$
direction, denoted with
 $\langle \cdot \rangle$
, are then computed to assess the spanwise and streamwise localisation (see figure 3). The drop in magnitude in
 $z$
by four decades is consistent with an exponential decay, whereas the decay by two decades in
 $x$
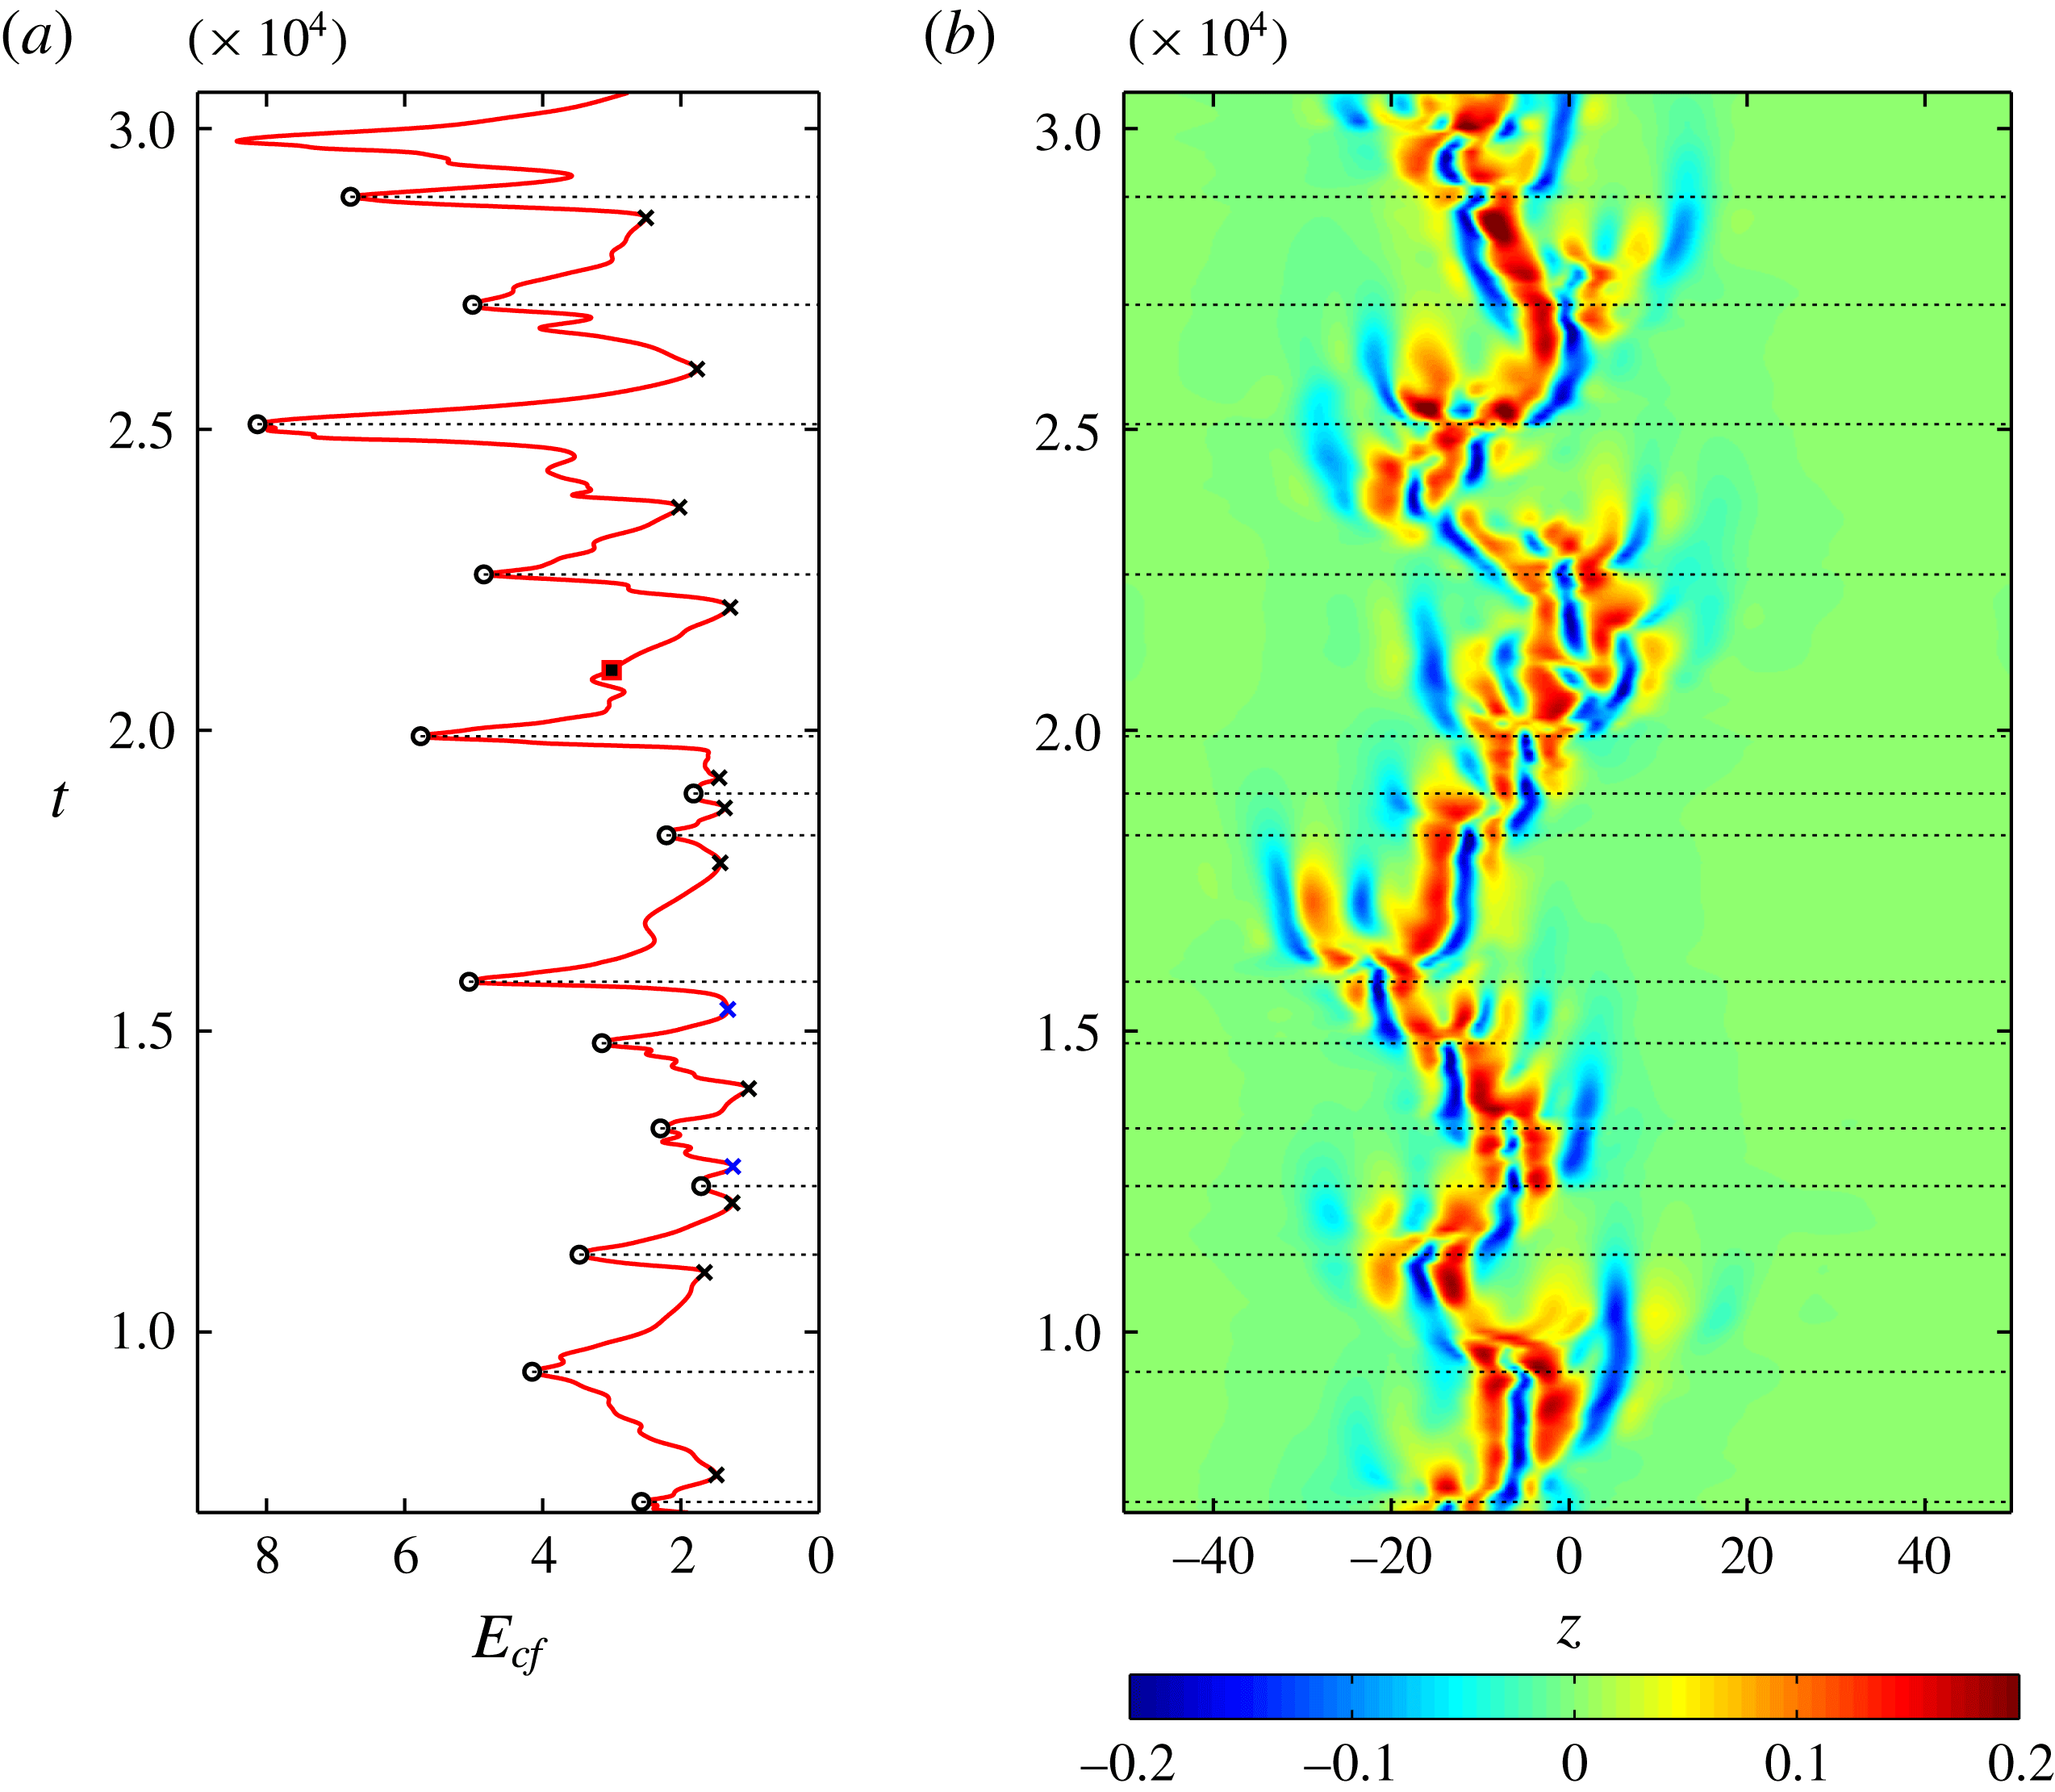
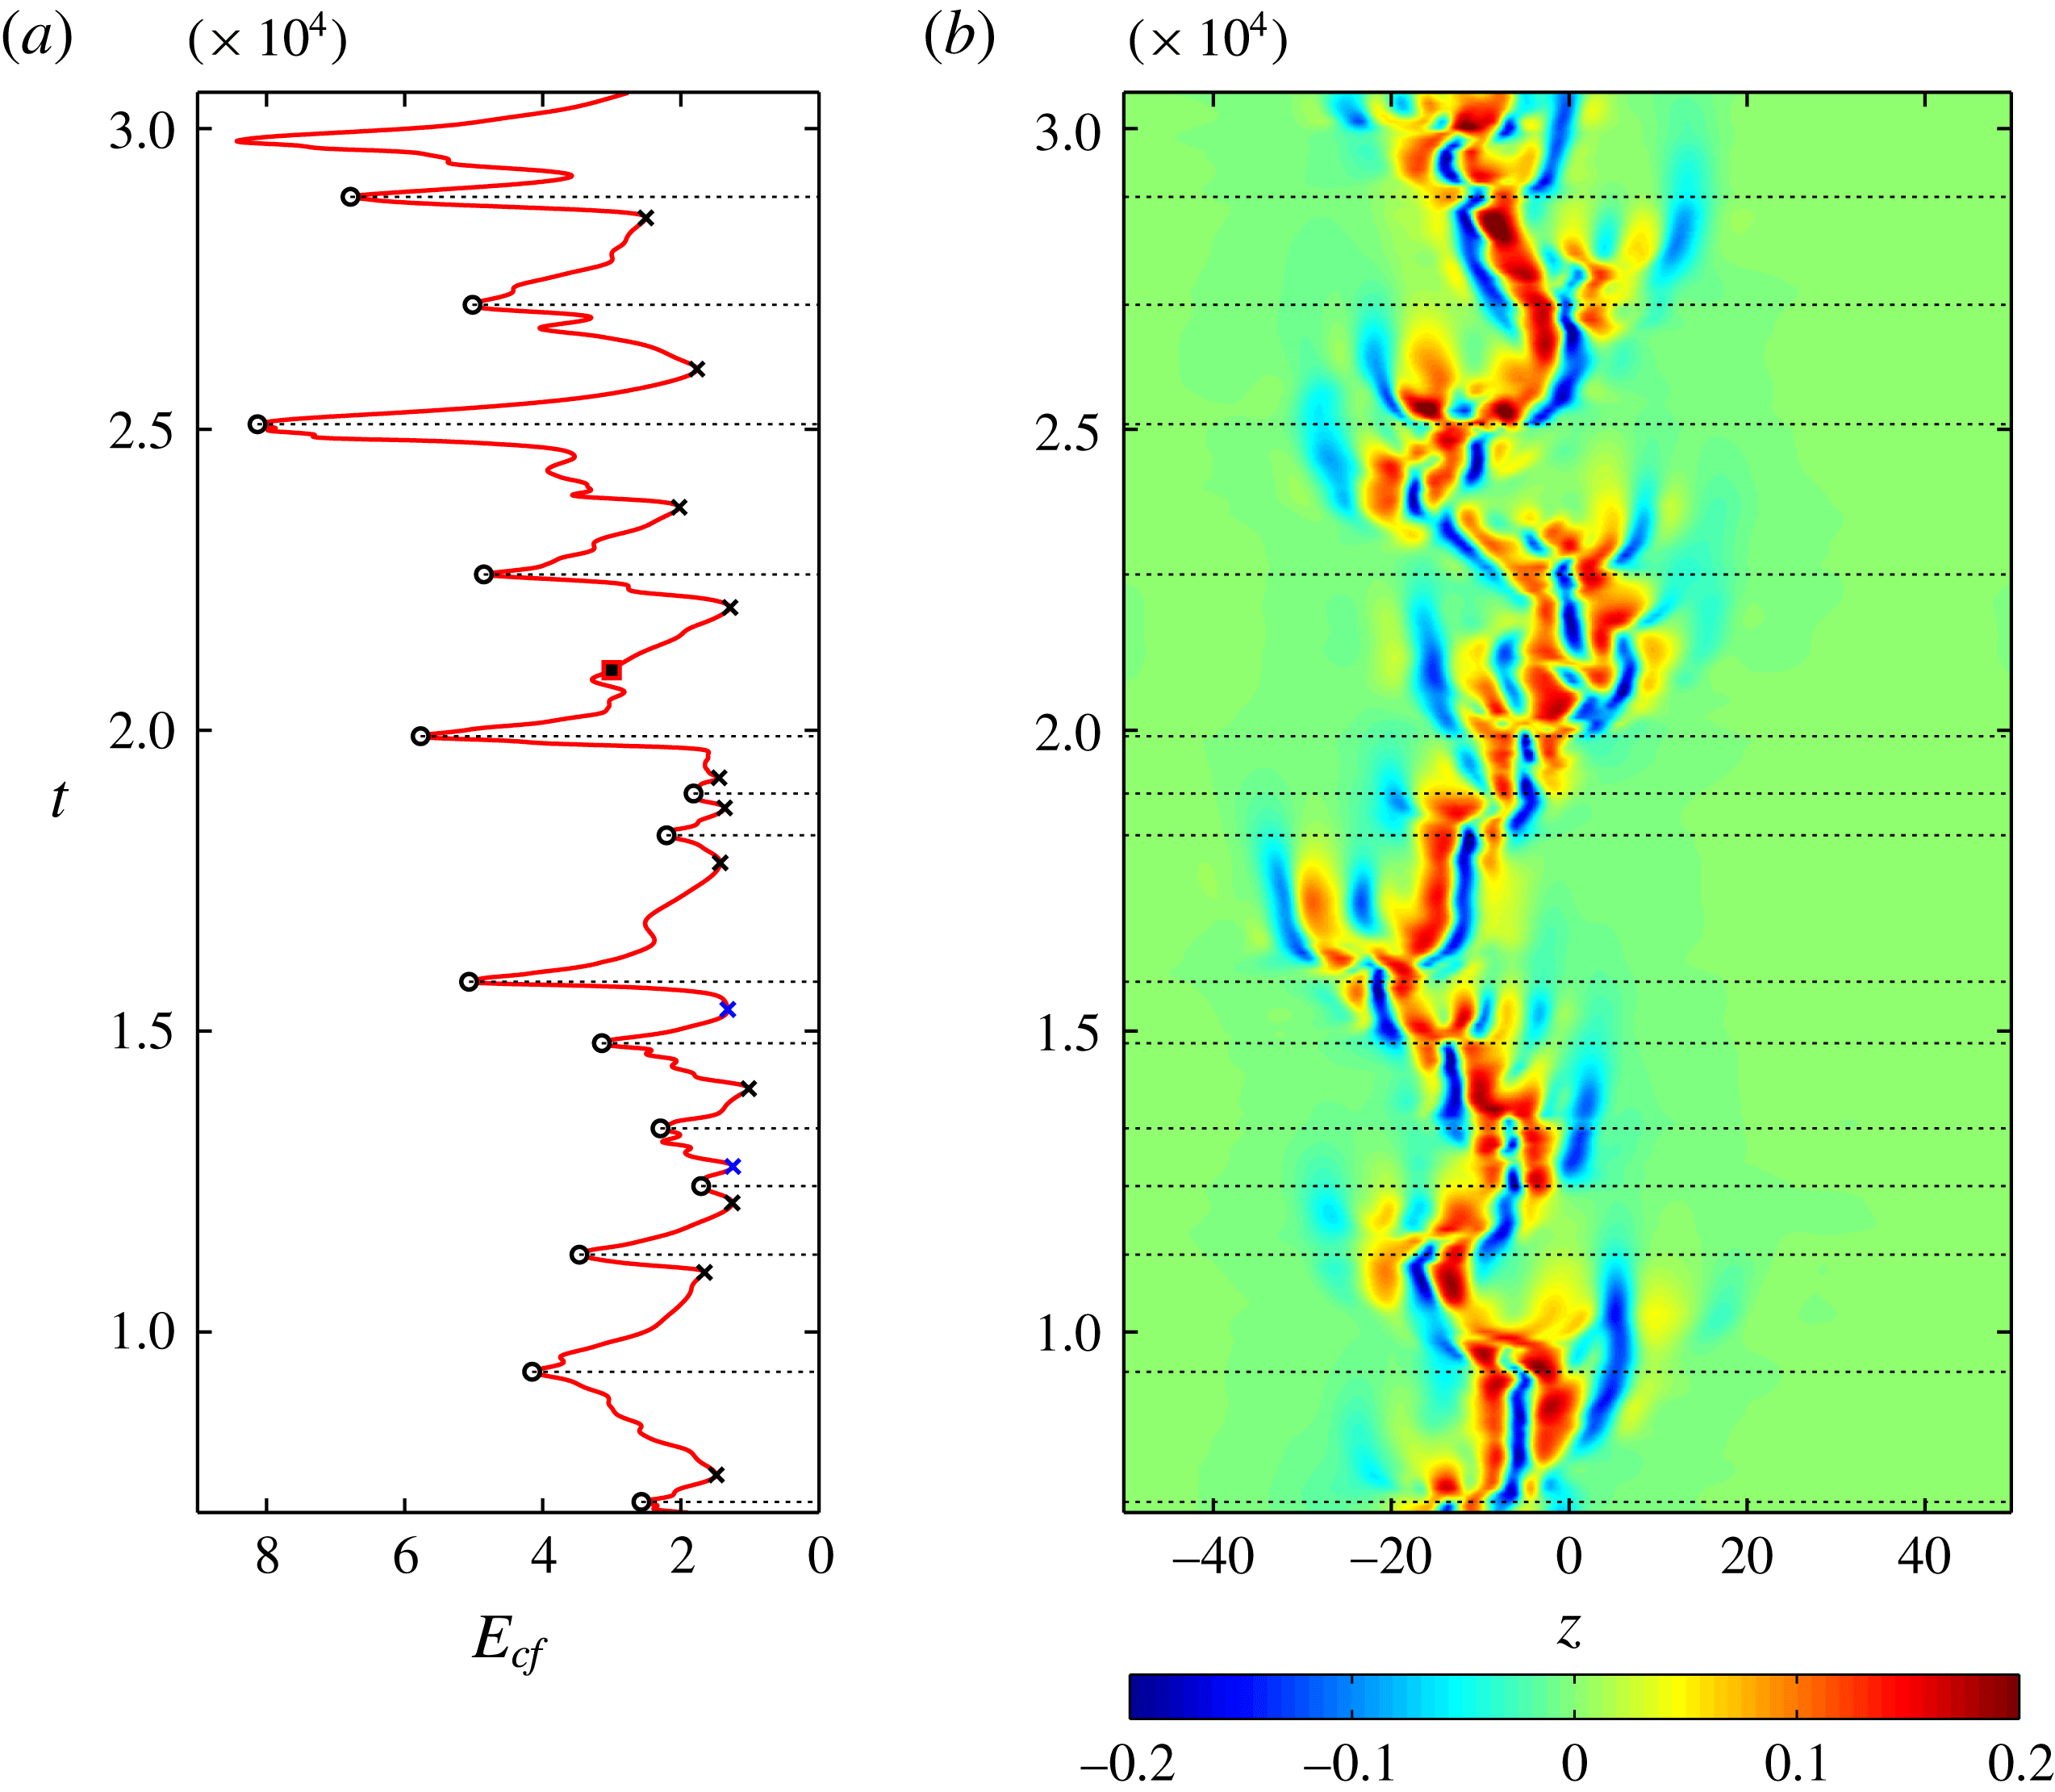
is compatible with both exponential and power-law decay (Zammert & Eckhardt Reference Zammert and Eckhardt2014). The temporal dynamics of the edge state is monitored in figure 4(a) using the cross-flow energy
 $$\begin{eqnarray}E_{\mathit{cf}}(t)=\int _{{\it\Omega}}({v^{\prime }}^{2}+{w^{\prime }}^{2})\,\text{d}x\,\text{d}y\,\text{d}z\equiv E_{v}+E_{w},\end{eqnarray}$$
based on the wall-normal and spanwise velocity fluctuations. This quantity leaves aside the fluctuations associated with the streamwise streaks, characterised by weak decay rates. Variations of
 $E_{\mathit{cf}}$
remain chaotic but display a clear alternation of calm phases with bursting phases. The spatio-temporal dynamics of the streaks is relatively simple once displayed in a space–time diagram as in figure 4(b). The quantity visualised here is the streamwise velocity fluctuation
 $u^{\prime }(y=1)$
averaged locally over
 $50$
streamwise units. When
 $E_{\mathit{cf}}$
is low, only one low-speed streak remains active, which defines the recurrent ‘active core’ of the edge state, with the other streaks constituting the state viscously decaying away. The active low-speed streak is flanked by staggered streamwise vortices. A sinuous mode develops and ultimately breaks down the streak (see figure 5
a), in association with a burst of
 $E_{\mathit{cf}}$
in figure 4(a). In the breakdown process new vortices are created around the active region, regenerating new streaks. As a result, the state is becoming wider after the bursts, as seen in figure 4(b). One of the streaks takes the role of the active core and the cycle is closed modulo a spanwise shift. This is confirmed in figure 4(b), which shows erratic shifts in
 $z$
over periods of
 ${\approx}10^{3}{-}10^{4}$
time units. The whole regeneration cycle is the localised counterpart of the dynamics described in shorter numerical domains of the ASBL (Kreilos et al.
Reference Kreilos, Veble, Schneider and Eckhardt2013; Khapko et al.
Reference Khapko, Kreilos, Schlatter, Duguet, Eckhardt and Henningson2013, Reference Khapko, Duguet, Kreilos, Schlatter, Eckhardt and Henningson2014), and bears many similarities to the self-sustaining cycle of near-wall turbulence (Hamilton, Kim & Waleffe Reference Hamilton, Kim and Waleffe1995). The fluctuations reaching higher up in the boundary layer are shed downstream from the active core, where the shear is not strong enough to sustain them. This mechanism, also reported in spatially developing boundary layers (Duguet et al.
Reference Duguet, Schlatter, Henningson and Eckhardt2012), maintains the
 $x$
-localisation of the edge state.
(a) Cross-flow energy
 $E_{\mathit{cf}}(t)$
. The open circles (respectively crosses) correspond to maxima (respectively minima) of
 $E_{\mathit{cf}}$
. The snapshot in figure 2 is marked with a square and those from figure 5 with blue crosses. (b) Space–time
 $(z,t)$
diagram of
 $\langle u^{\prime }\rangle _{x}(y=1)$
. Averaging in
 $x$
is performed here locally in a neighbourhood around the active core of the state.
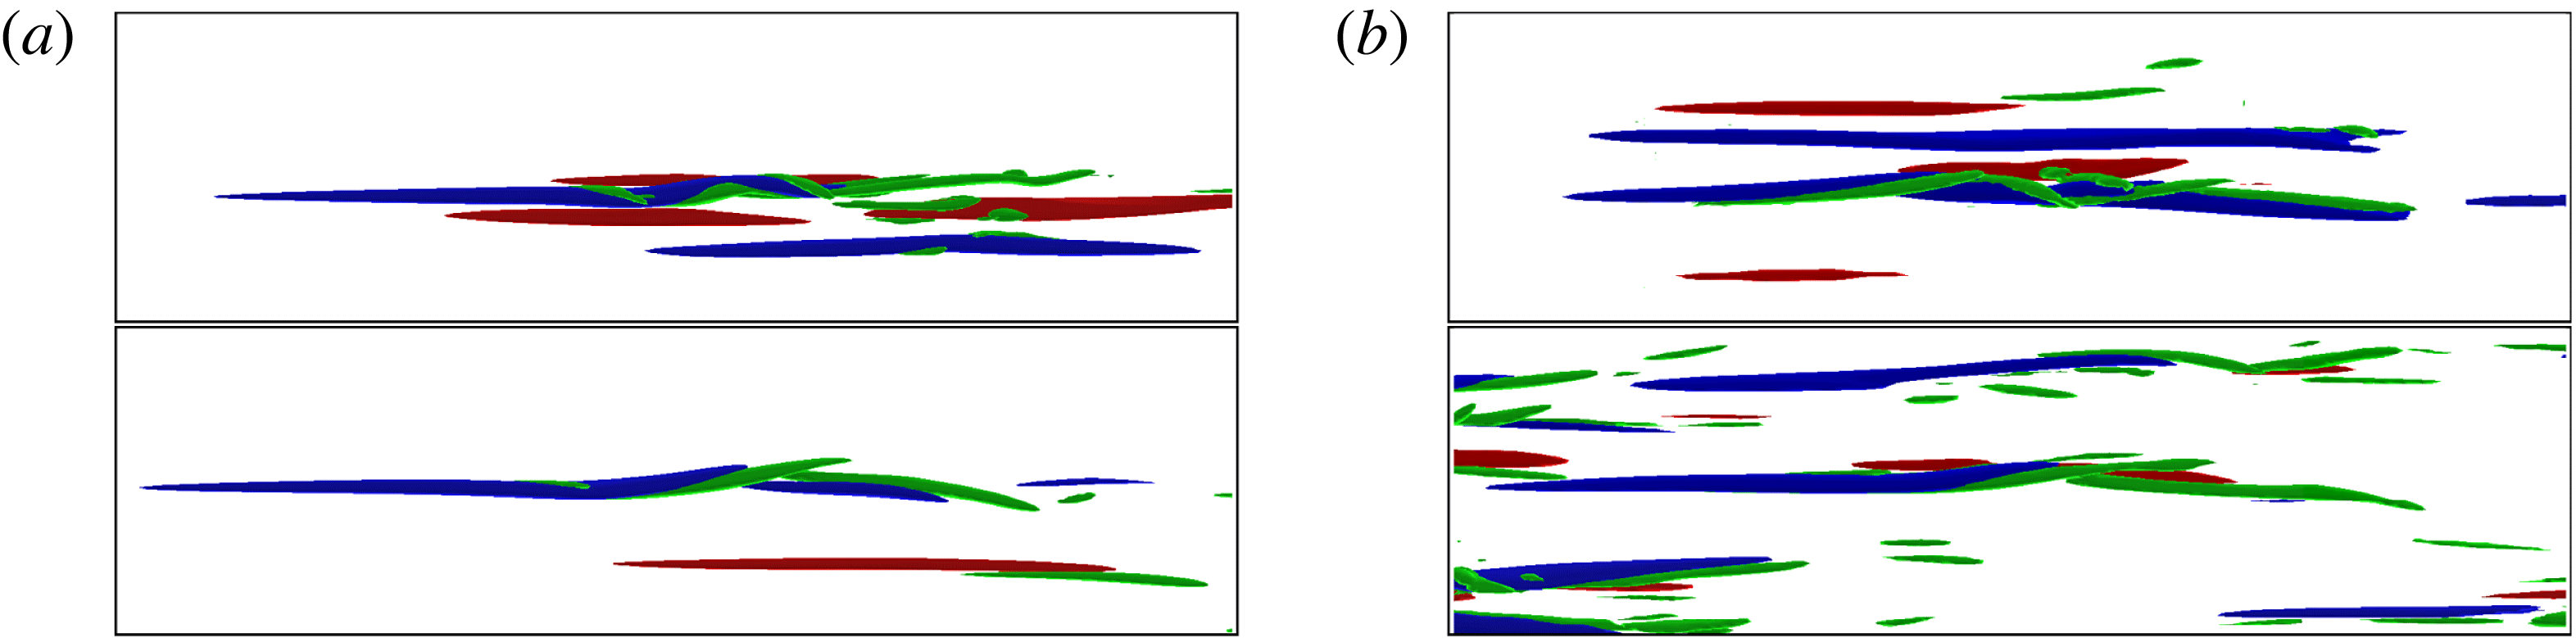
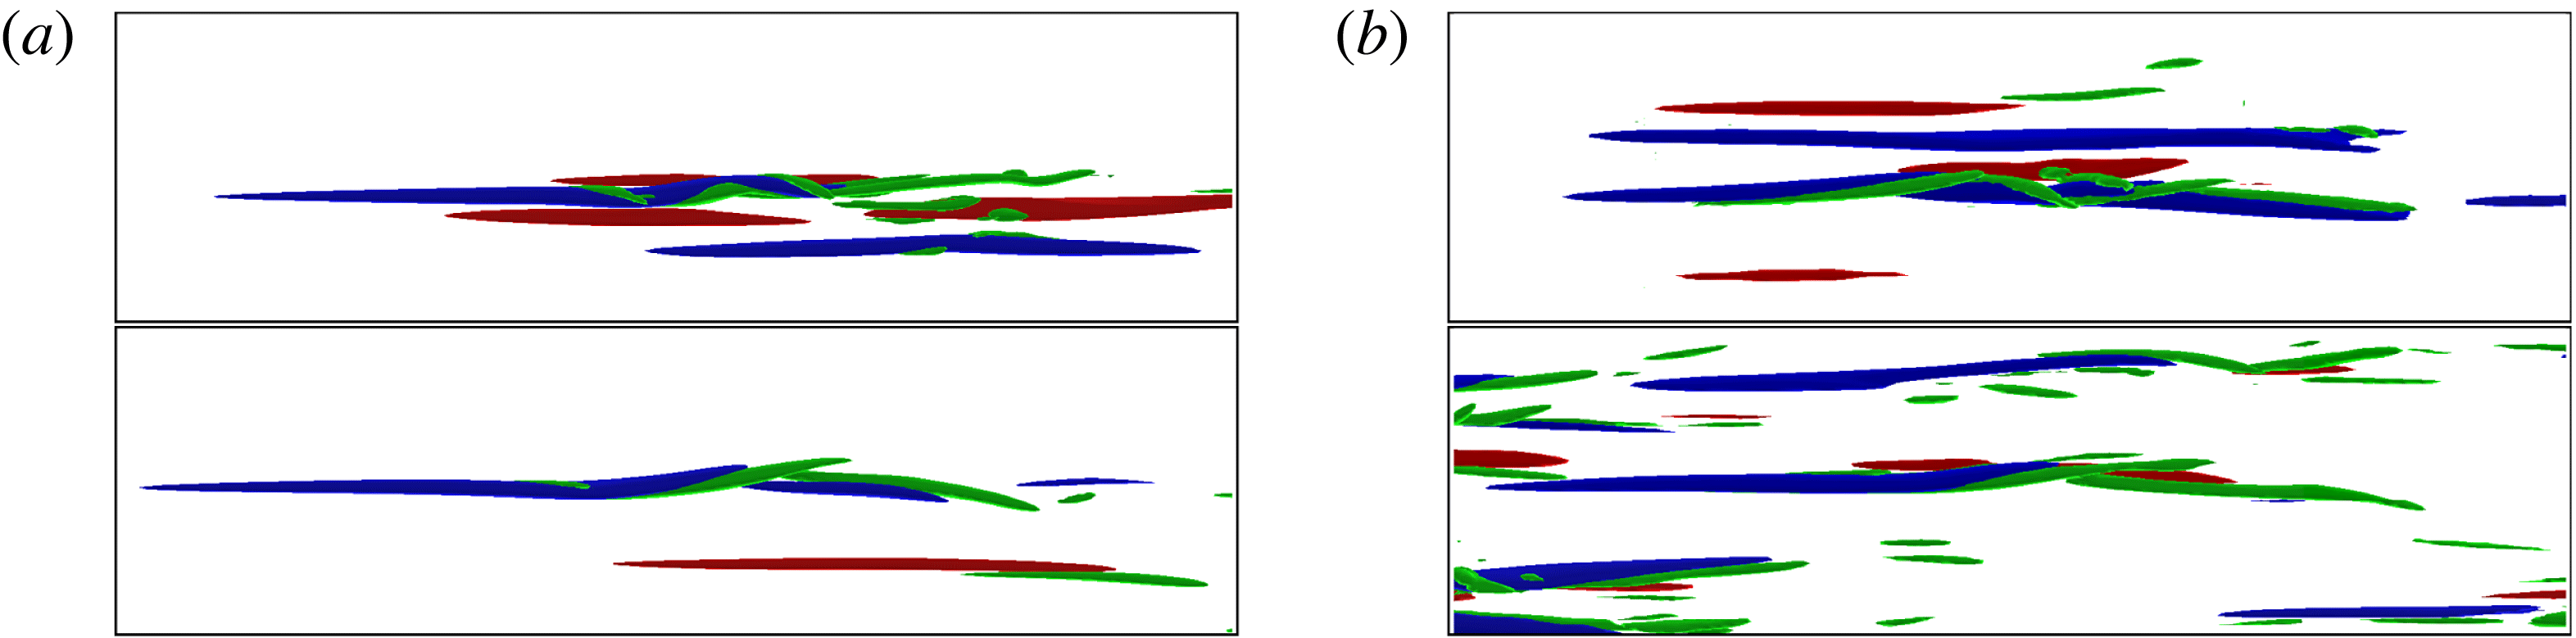
Comparison of the edge state during calm phases ((a),
 $t=12\,700,15\,400$
) and pre-nucleation events (b) in noise-induced transition. The visualisation is similar to figure 2, but with different isovalues (
 $u^{\prime }=\pm 0.13$
and
 ${\it\lambda}_{2}=-4\times 10^{-4}$
) and a top view. The shown framed boxes with the size
 $140\times 40$
in the
 $x$
and
 $z$
directions contain only parts of the computational domain. Flow is from left to right.
4 Nucleation process
Sinuous modes growing on low-speed streaks have often been reported in experiments and computations of bypass transition (Brandt et al.
Reference Brandt, Schlatter and Henningson2004; Yoshioka, Fransson & Alfredsson Reference Yoshioka, Fransson and Alfredsson2004). Varicose modes of instability have also been predicted and observed in boundary-layer flows but are outweighed statistically by the sinuous ones (Schlatter et al.
Reference Schlatter, Brandt, De Lange and Henningson2008). The visual similarities between the edge-state dynamics and pre-nucleation episodes in bypass transition suggest that the emergence of streaks may be regarded as the approach to
 $\mathscr{W}^{s}$
, the stable manifold of the edge state. A crucial difference lies in the treatment of the sinuous modes, traditionally interpreted as a growing departure from a streaky non-sinuous base flow. The current sinuous oscillations are inherently part of the dynamics of the edge state. Constraining the dynamics to remain on
 $\mathscr{W}^{s}$
, on the one hand, leads to breakup and later reformation of exactly one active streak. Unconstrained computations, on the other hand, do not lead to one active streak reforming after breakdown: either the streak does not reform and the flow relaminarises, or several low-speed streaks emerge which cascade into turbulent motion and finally lead to an aggressively expanding turbulent spot. Both scenarios take the flow away from the edge state, which is consistent with a state-space escape along either direction of
 $\mathscr{W}^{u}$
. In order to test this hypothesis, we consider a series of simulations of transition in the ASBL at
 $Re=500$
with non-localised noise as an initial condition, and investigate whether the edge state can be, even transiently, identified in these simulations. The noise consists of a random superposition of Stokes modes spanning the whole domain with length scale of the order of
 $10$
(Chevalier et al.
Reference Chevalier, Schlatter, Lundbladh and Henningson2007). The magnitude for the noise amplitude is chosen to ensure transition through nucleation and growth of turbulent spots, but it is not optimised to result in trajectories that spend a long time near the edge (as could be done using edge tracking), since we did not want to artificially force visits to the edge states. As noted in § 2, the numerical domain D2 is chosen sufficiently large for localised spots to emerge, but still small enough so that typically only one or two distinct localised spot events are observed. Similarly to the spatially developing boundary layer, the nucleation of the spots can typically be traced back to a growing sinuous instability of the low-speed streaks, with the varicose instability seen only in a few rare cases.
Quantitative comparison of edge state and noise-induced pre-nucleation events.

We begin with a qualitative comparison in figure 5 between well-chosen snapshots on the edge trajectory and local precursors of turbulent spots. Both instances involve one low-speed streak with sinuous instabilities with similar size and magnitude. More quantitative evidence that the edge state is actually embedded in the noise simulations is based on three-dimensional measurements (the statistics are based on
 $13$
instances corresponding to all local minima of
 $E_{\mathit{cf}}$
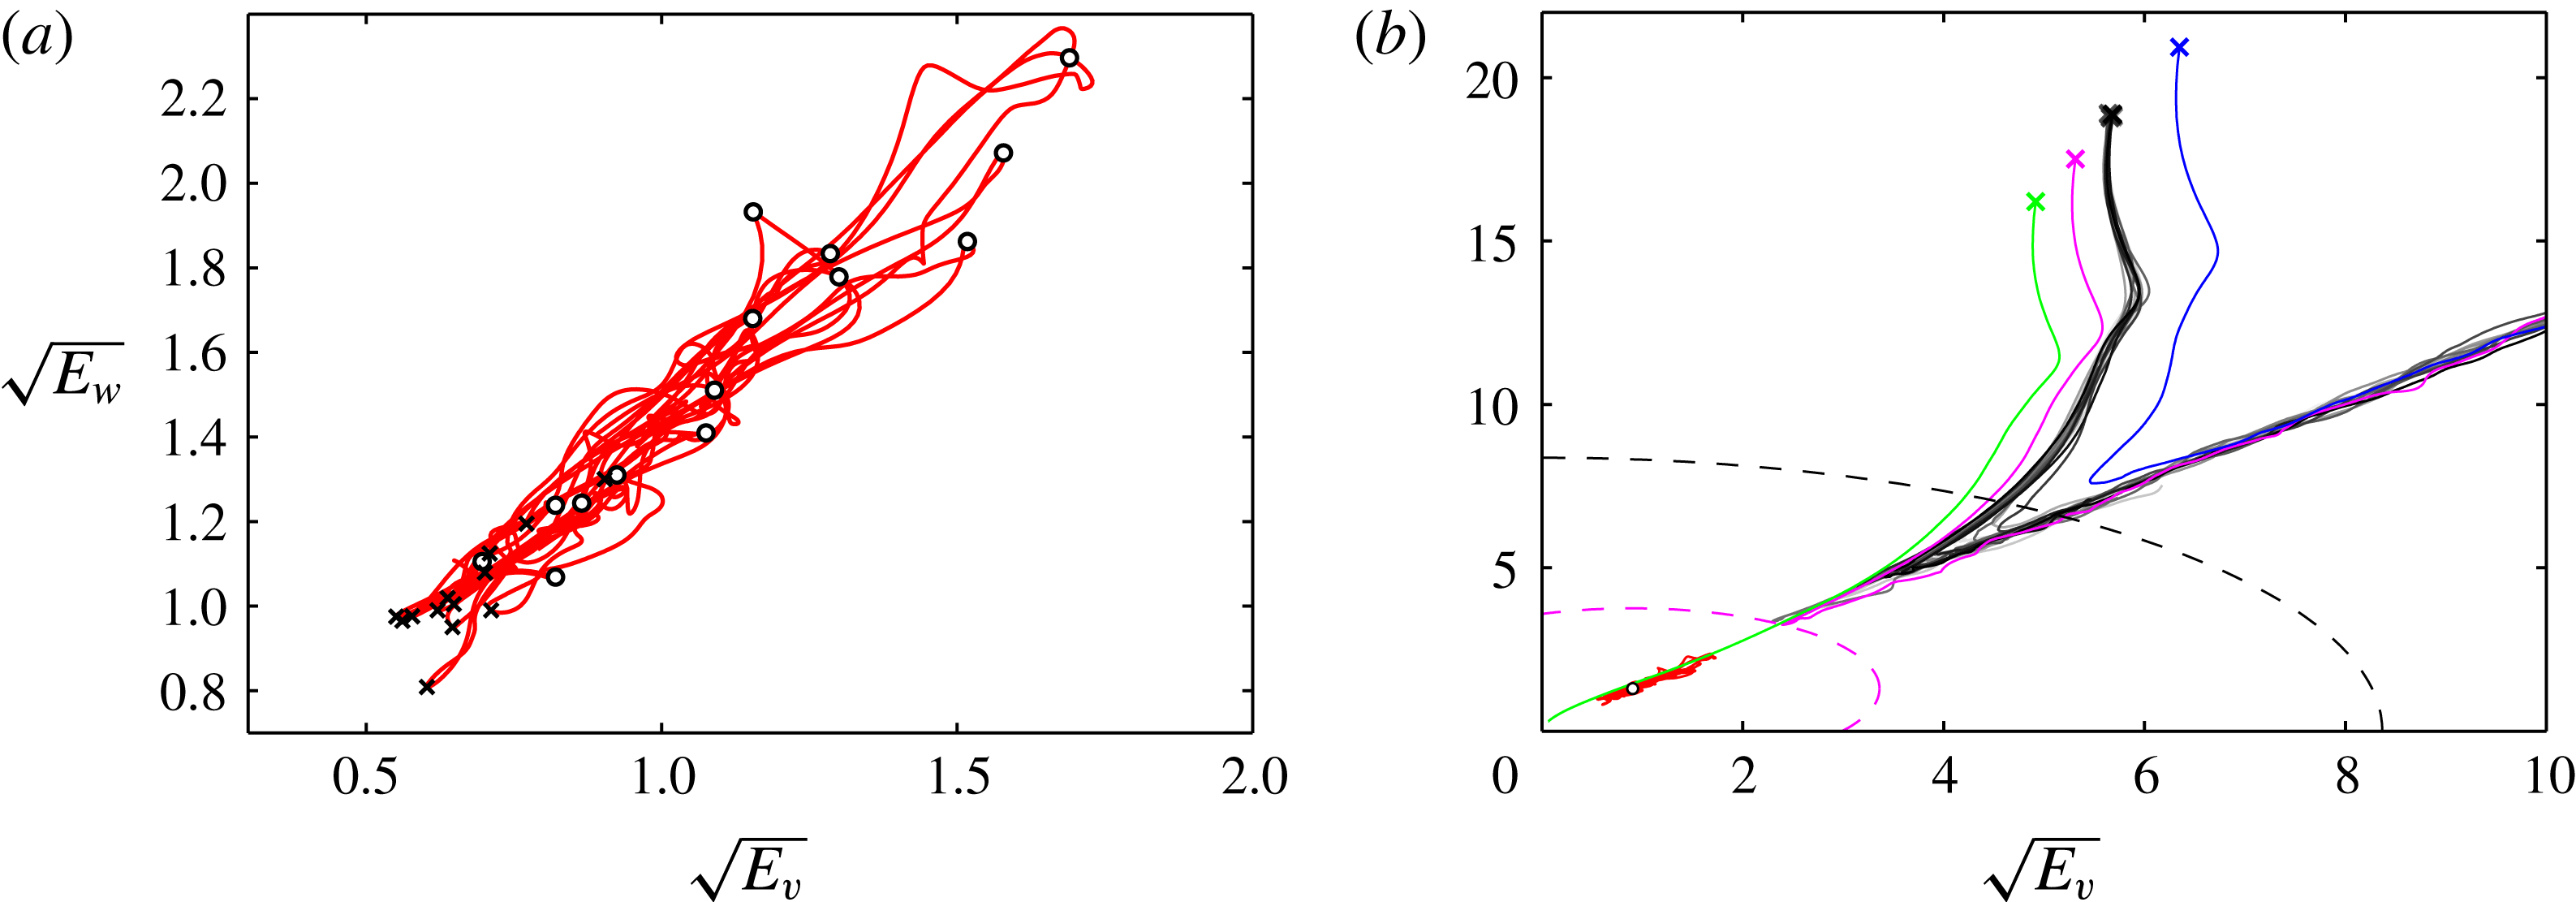
). We report in the two set-ups the spanwise width of the most intense low-speed streak, its intensity (deviation from the laminar flow) and the streamwise wavelength of the growing sinuous instability. The quantitative similarity between the statistical averages reported in table 1 is remarkable. Further quantitative evidence that noise-initiated trajectories do visit the neighbourhood of the edge state comes from the energetic view of the state space. In figure 6, the dynamics is depicted on the
 $(\sqrt{E_{v}},\sqrt{E_{w}})$
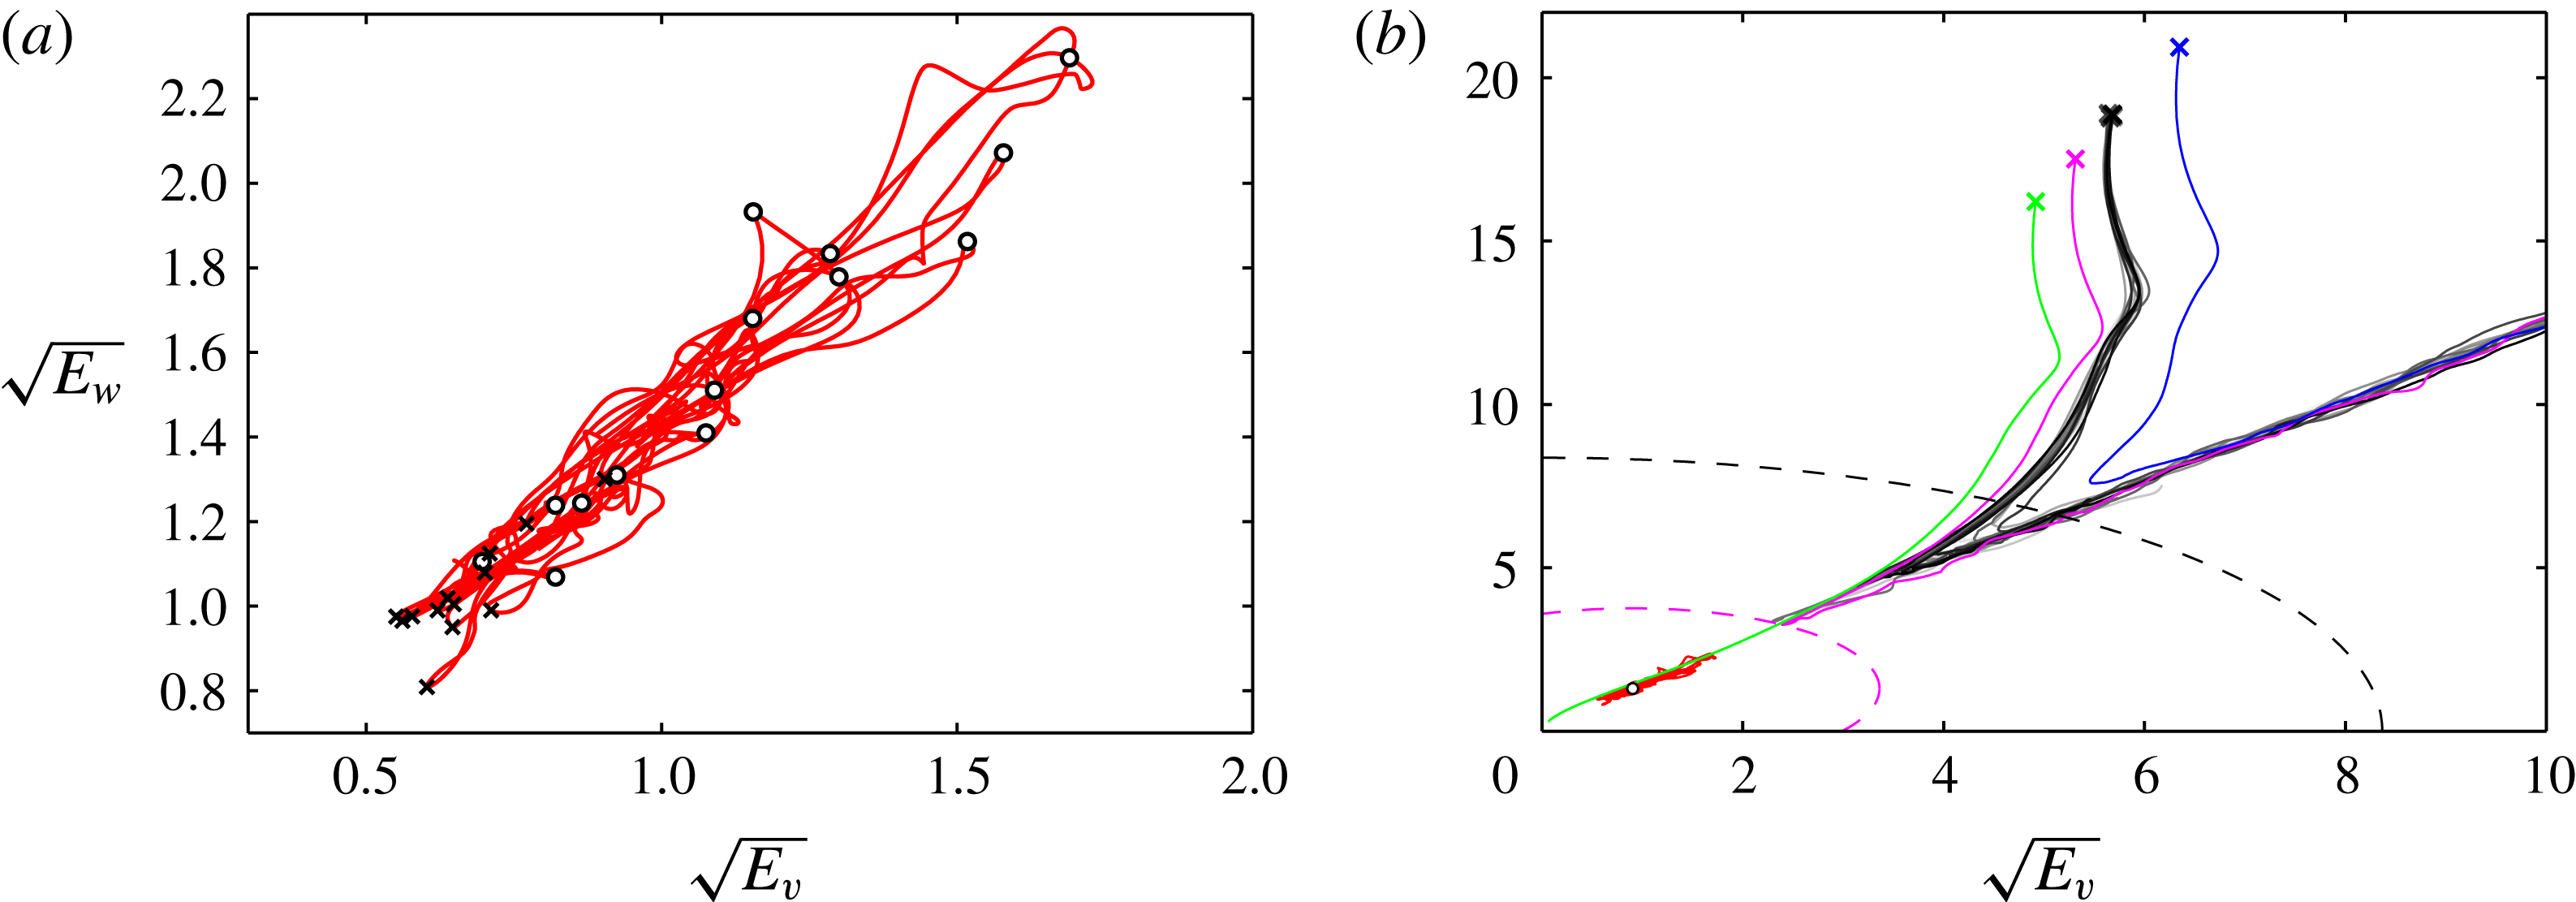
plane. In this representation, the chaotic edge state is a convoluted object residing in a small bounded region of the state space (see figure 6
a). Trajectories with the lowest levels of initial noise (green line in figure 6
b) continue towards the laminar state while the flow slowly laminarises, suggesting that the corresponding initial conditions are within the basin of attraction of the laminar state. For most initial conditions with higher amplitude, apparent approaches to the edge state in figure 6(b) are followed by an abrupt increase in energy; the corresponding initial conditions belong to the basin of attraction of the turbulent state. The cloud of initial conditions is hence staggered along
 $\mathscr{W}^{s}$
. Several simultaneous nucleations result in higher energies and, thus, in a larger distance from the edge in figure 6(b). Therefore, the distance of closest approach is smallest for the trajectories involving one single nucleation event. Once the spots appear, they grow in size, invading the domain, with the energy steadily growing in figure 6(b). In the current finite-size system the energy saturates when the entire volume has become turbulent. Since the latter is domain-dependent, we choose not to show it in figure 6(b). The geometric structure emerging from figure 6(b) is then directly comparable with figure 1. All trajectories in figure 6(b), despite starting from different parts of the state space (the variability of
 $E_{\mathit{cf}}(t=0)$
is here approximately
 $70\,\%$
), approach the location of the edge state and leave together along a single direction. This is consistent with an approach along
 $\mathscr{W}^{s}$
(characterised by a very large effective dimension) and an escape along the one-dimensional
 $\mathscr{W}^{u}$
.
State-space representation using
 $\sqrt{E_{v}}$
and
 $\sqrt{E_{w}}$
. (a) The fully localised chaotic edge state. The circles and crosses indicate extrema of
 $E_{\mathit{cf}}$
as in figure 4(a). (b) Transition from four different noise amplitudes (green, magenta, shades of grey and blue colours in the plot), with most of the trajectories corresponding to one of the noise levels (grey). Noisy initial conditions with crosses, the edge state in red, with the open circle being the reference point for measuring distances from the edge state, as exemplified with the magenta dashed circle. The outward crossing of the black dashed circle marks the nucleation of a turbulent spot for the grey trajectories. A supplementary movie is available at http://dx.doi.org/10.1017/jfm.2016.434.
The time it takes to nucleate a turbulent spot starting from noise is different for each individual state-space trajectory. For an intermediate noise level (indicated by the grey lines in figure 6
b) this nucleation time
 $t_{n}$
is defined as the time at which a predefined threshold
 $E_{\mathit{cf}}=70$
(black dashed circle in figure 6
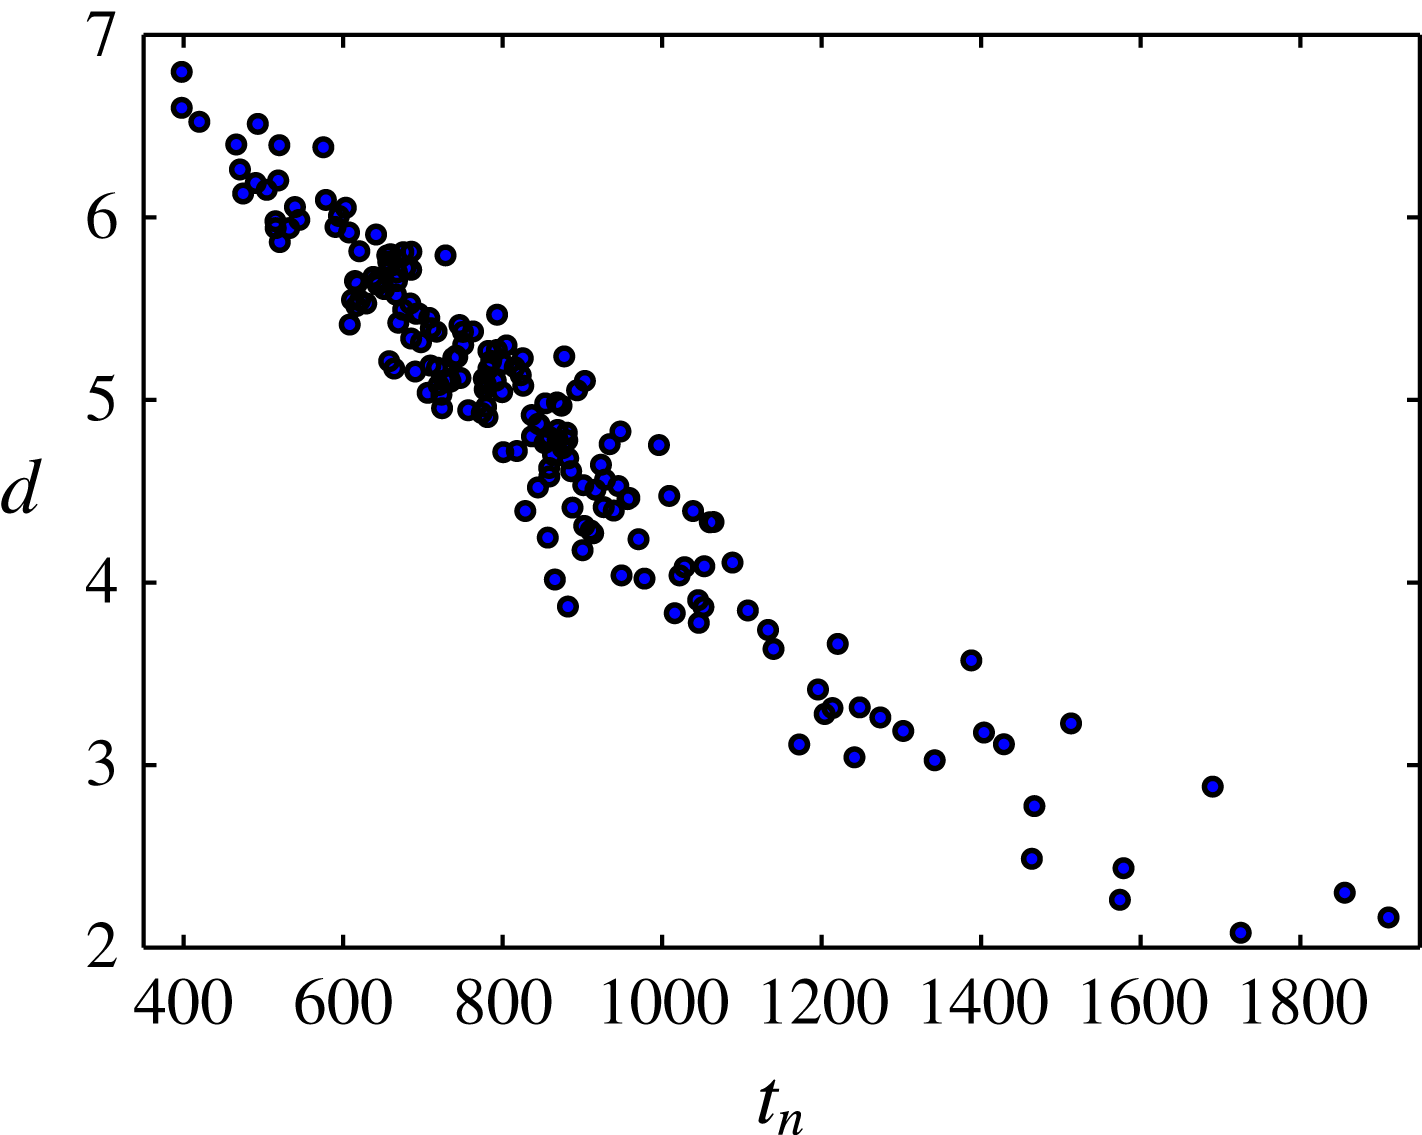
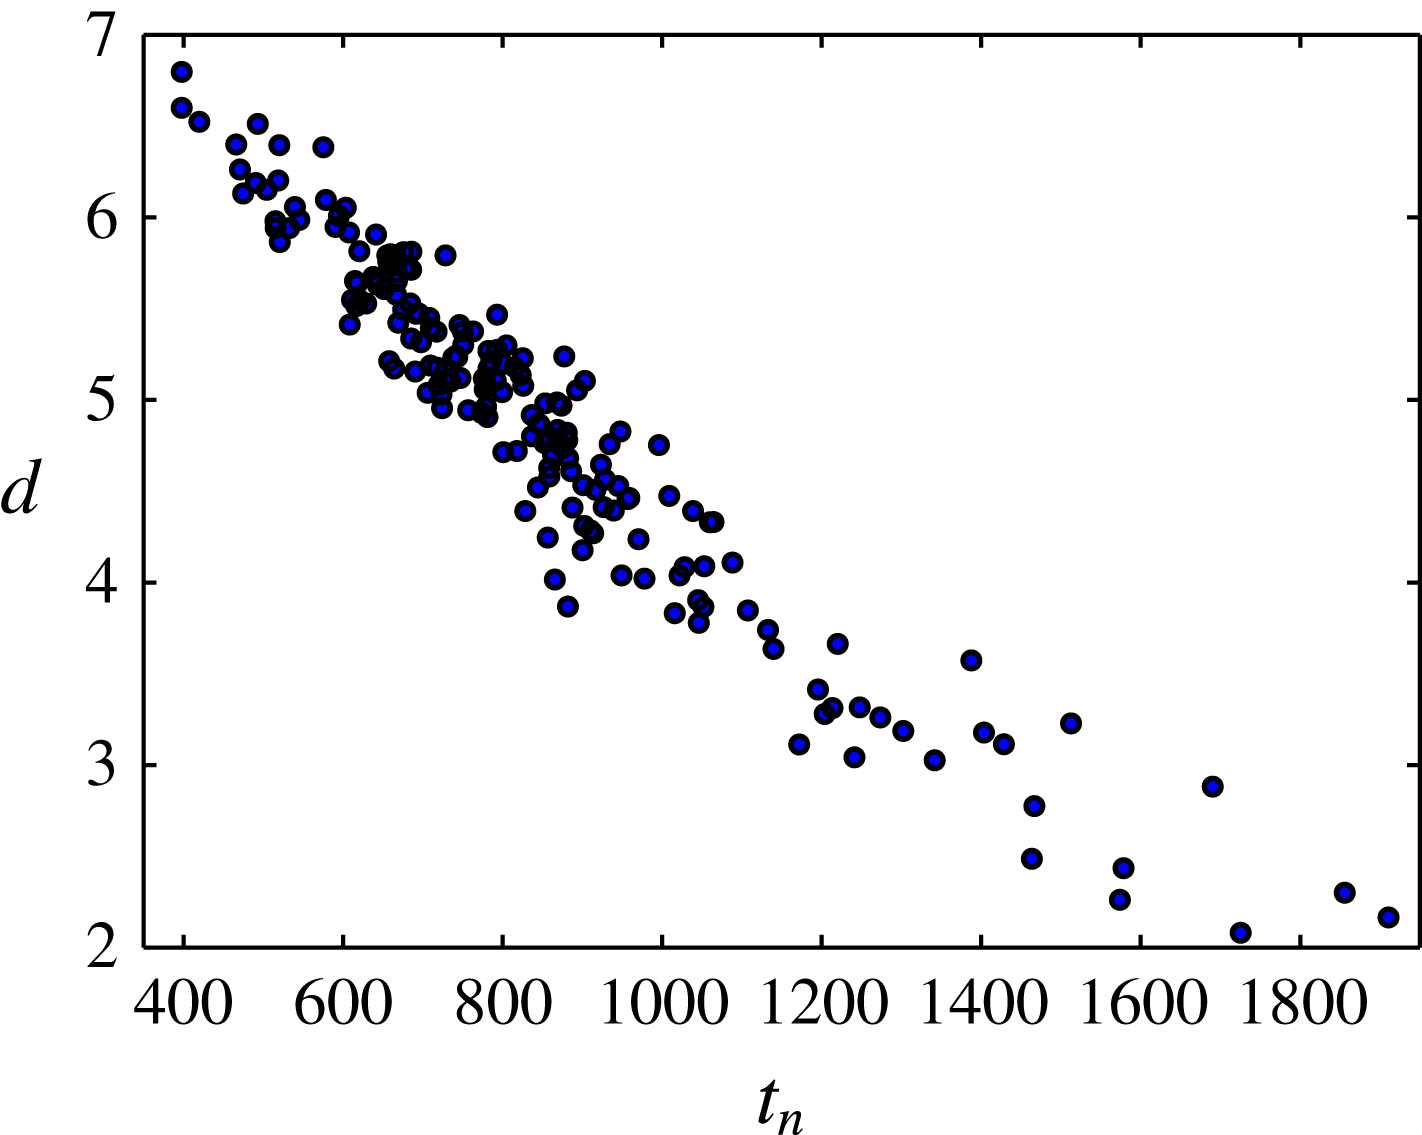
b) is reached. We infer from the data in figure 6(b) that closer approaches to the edge state lead to delayed transition. This is verified in figure 7 by plotting for each noise realisation the measured nucleation time versus the associated minimal distance
 $d$
from the edge state. The latter is measured using the Euclidean metric in the
 $(\sqrt{E_{v}},\sqrt{E_{w}})$
plane and represents the smallest distance between one of the
 $E_{\mathit{cf}}$
minima of the edge state (the open circle
 $(\sqrt{E_{v}^{edge}},\sqrt{E_{w}^{edge}})=(0.9,1.3)$
in the lower left corner in figure 6
b) and each individual noise trajectory,
 $$\begin{eqnarray}d=\min _{t}\left\Vert (\sqrt{E_{v}(t)},\sqrt{E_{w}(t)})-\left(\sqrt{E_{v}^{edge}},\sqrt{E_{w}^{edge}}\right)\right\Vert _{2}.\end{eqnarray}$$
The trend is clear and, despite the nonlinear context, fully consistent with the linear approach to a saddle point: the closer a trajectory comes to the edge state, the longer the time it spends in its vicinity, hence the later it reaches the turbulent attractor. This behaviour, expected in the direct (linearised) neighbourhood of a saddle point, is confirmed here at a finite distance from the saddle. It is evident from figure 7 that most of the nucleation events occur between
 $t=600$
and
 $1000$
. The distribution of
 $t_{n}$
is not presented here since its exact shape is not universal and depends on the statistical distribution of the chosen initial conditions and details of the dynamics. It should be noted that in an experimental set-up, a distribution of nucleation times translates into a distribution of nucleation positions because of the mean advection.
Nucleation time
 $t_{n}$
versus the distance of closest approach to the edge
 $d$
.
5 Discussion and conclusions
Computation of the edge state in the ASBL in an extended numerical domain has led to a flow state localised in the three spatial directions. Its dynamics is chaotic in time and involves recurrent visits to an active core consisting of one low-speed streak developing sinuous instabilities. The regeneration mechanism identified is strongly reminiscent of similar computations in constrained numerical domains (Kreilos et al. Reference Kreilos, Veble, Schneider and Eckhardt2013; Khapko et al. Reference Khapko, Kreilos, Schlatter, Duguet, Eckhardt and Henningson2013, Reference Khapko, Duguet, Kreilos, Schlatter, Eckhardt and Henningson2014), and thus appears to be generic for the ASBL. Besides, localised recurrent low-speed streaks subject to sinuous instabilities have also been reported as edge states in a spatially developing boundary layer (Duguet et al. Reference Duguet, Schlatter, Henningson and Eckhardt2012) with imposed spanwise symmetry, suggesting possible direct extensions to a wider class of boundary-layer flows.
The classical description of a nucleation event leading to a turbulent spot is based on the linear instability of some well-chosen streak state selected by the receptivity process. This can here be reformulated within a more global state-space picture where the central mediator is the edge state along with its stable and unstable manifolds
 $\mathscr{W}^{s}$
and
 $\mathscr{W}^{u}$
. The approach along
 $\mathscr{W}^{s}$
incorporates both the classical receptivity stage and also the emerging localisation, while the escape along
 $\mathscr{W}^{u}$
captures all of the mechanisms formerly described by secondary instability concepts now in a localised context. The concept of escape from the edge was used recently to model the nucleation process (Kreilos et al.
Reference Kreilos, Khapko, Schlatter, Duguet, Henningson and Eckhardt2016), without taking into account the receptivity phase encoded in the approach to
 $\mathscr{W}^{s}$
.
The present study demonstrates that this picture does not only hold for very carefully selected initial conditions designed to lie on
 $\mathscr{W}^{s}$
, but that it is robust enough for a much wider class of perturbations. A set of simulations initiated with non-localised noise has been scrutinised. In most cases, a robust localised coherent structure consisting of one sinuous low-speed streak is identified immediately after dissipation of the noise and prior to actual transition. This state is both qualitatively (see figure 5) and quantitatively (see table 1) analogous to the recurrent streak on the edge. Former evidence for the presence of a well-defined finite-amplitude streaky state as precursor to spot nucleation appeared in various shear flows studies, for trajectories starting either from a minimal seed (Duguet et al.
Reference Duguet, Monokrousos, Brandt and Henningson2013) or from free-stream turbulence (Schlatter et al.
Reference Schlatter, Brandt, De Lange and Henningson2008). A finer representation of the state-space geometry with proper metrics, taking into account the chaotic behaviour on the edge, its expanding Lyapunov directions and the translational invariance of the system, would improve our representation of the system and the measure of how closely the edge state is approached. The minimal seed is another well-defined point in this geometry, also connected to the edge state, and its dynamic role in a realistic transitional flow also deserves further study. This view on the bypass-transition process appears now to be generic to most wall-bounded shear flows, where transition can be considered as an initial value problem in a temporal set-up. The main challenge is to reconcile such a set-up with permanent excitations fluctuating in both time and space. The extension of an abstract state-space description to spatially developing boundary-layer flows still faces further open questions. While the concept of a localised edge state is useful to describe the formation of one individual turbulent spot, the case of truly extended systems (i.e. larger than the typical correlation distance) demands a paradigm shift: as multiple simultaneous nucleation events occur at remote (ideally uncorrelated) locations on the plate, the description of the system in terms of a unique dynamical system reaches its limits. The price to pay is to trade the deterministic picture for a statistical description of the nucleation process involving the definition of a probabilistic nucleation rate.
Acknowledgements
We acknowledge that the results of this research have been achieved using the PRACE-3IP project (FP7 RI-312763) resource ARCHER based in the UK at EPCC. Some additional runs were performed using the resources provided by SNIC (Swedish National Infrastructure for Computing).
Supplementary movies
Supplementary movies are available at http://dx.doi.org/10.1017/jfm.2016.434.