All observable behavior results from gene–environment interplay. In and of itself, this is a trivial assertion. Nevertheless, acknowledgement of the ubiquity of gene–environment interplay creates an uncomfortable complication in psychological research involving the genetic and environmental factors contributing to physical, psychological, or psychopathological development. It is common sense that genes and the environment do not operate independently of one another, yet their independence is often assumed, especially in statistical models of developmental processes over time (Plomin & Spinath, Reference Plomin and Spinath2004). Although this oversimplification is acknowledged among methodologists (Neale & Cardon, Reference Neale and Cardon1992), and the implications of nonindependence and nonadditivity have been examined in some detail in the classical twin literature (Jinks & Fulker, Reference Jinks and Fulker1970), most longitudinal behavior genetic models continue to rely on independent genetic and environmental components.
Without further specification, nonindependence of genes and environment, usually referred to as gene–environment correlation (rGE), is merely a statistical phenomenon; it is not a description of a developmental process. By developmental process, we are referring to causal relations between events located in time. An observation that children of depressed parents, at increased genetic risk for depression, are more likely to be exposed to environments conducive to the development of psychopathology does not explain how or why such a correlation arises. In this paper, we propose that reciprocal causal effects between individuals' phenotypes and their environments, especially as they operate within families, are a plausible source of rGE during development. The word phenotype refers to the observable state of an organism, as opposed to the latent genetic and environmental processes that constitute it. We denote the reciprocal causal effects between phenotype and environment as P ⇔ E. Using simulated longitudinal twin data, we demonstrate how P ⇔ E can contribute to increasing within-pair differences in the phenotypic expression of traits and discuss some of the unintended consequences of ignoring phenotype–environment effects in commonly used developmental models. In particular, we show how longitudinal models that do not account for P ⇔ E (or the rGE it produces) can lead to potentially misleading conclusions about changes in heritability across the life span.
Within-Family P ⇔ E and rGE
Partitioning of developmental effects into independent within-pair and between-pair components is a basic method of analysis of twin and sibling models. In a sample of twin and sibling pairs, individual differences in a trait can be partitioned into one component between pairs, representing differences among the means of the pairs, and a second component within pairs, representing differences between members of the same pair. For the present study, we focus specifically on within-pair rGE, which describes a tendency for the member of a pair with the more favorable genetic endowment to be exposed to more favorable environments.
Within-pair P ⇔ E processes induce systematic differences between the within-pair developmental courses of identical (monozygotic [MZ]) and fraternal (dizygotic [DZ]) twins (Scarr & McCartney, Reference Scarr and McCartney1983). For genetically identical MZ twins, by definition, the only within-family processes that can produce phenotypic differences are environmental, collectively referred to as the nonshared environment. Although nonshared environmental differences within MZ pairs might be related to future within-pair differences in environmental exposure, they cannot constitute within-pair rGE because they have no genetic variance. Phenotypic differences within DZ pairs, in contrast, can be genetic in origin, because DZ twins share only 50% of their genes. Within-pair genetic variation may produce phenotypic differences between members of a pair that predispose them to select, invoke, or respond to different environments, which would then serve to increase their within-family phenotypic variance more rapidly than in MZ twin families.
Classical Developmental Twin Studies
The usual goal of genetically informed developmental studies is to identify the independent genetic and environmental sources of variance that contribute to stability and change in the development of phenotypes over time (Bartels et al., Reference Bartels, van den Oord, Hudziak, Rietveld, van Beijsterveldt and Boomsma2004). The classical twin model focuses on three sources of variation, which are assumed to be independent: the additive effect of genes (A), environmental effects that are shared among twins or siblings raised together (C), and, as we have already discussed, environmental effects that are not shared among twins or siblings raised together, called the nonshared environment (E). Among the many published longitudinal twin studies, three main classes of findings can be outlined. First, genes and shared environments (when they can be detected at all) mostly contribute to the temporal stability of phenotypes. Second, nonshared environmental effects mostly account for occasion-specific variance, which means that nonshared environmental components, which are defined as uncorrelated between members of twin pairs, are also uncorrelated within a single individual over time. Third, the magnitude of the heritable component tends to increase over time, whereas the shared environmental component decreases.
Reciprocal Effects Models
The processes we propose for sibling differentiation are similar to reciprocal effects models proposed by Dickens and Flynn (Reference Dickens and Flynn2001) to resolve the Flynn effect, which refers to an increase of 1 to 2 SD in the average IQ score over 20 to 30 years. Dickens and Flynn observed that given the high heritability of individual differences in IQ, massive environmental effects would be required to produce even a 0.5 SD increase of IQ in the space of a generation. As an alternative, they proposed a reciprocal effects model in which changes produced by small initial differences in phenotype could lead to subsequent changes in the environment and in turn to large changes in phenotype. The reciprocal effect of the environment on individuals' ability (evocative rGE) and the tendency for individuals to seek out more favorable environments given their ability level (active rGE) leads to large phenotypic differences over time, even in the presence of substantial cross-sectional genetic effects.
Dickens and Flynn (Reference Dickens and Flynn2001) focused on population-level changes in the mean of IQ. Although the Dickens–Flynn model has not been applied to secular trends in the incidence of psychopathology, such trends do exist and are largely unexplained. Although this paper is not directed at any particular phenotype, we contend that reciprocal exchanges between people and their environments have the potential to effect the differential development of psychopathology among siblings as much as cognitive ability across generations. Consider how differences between siblings or DZ twins in depressive symptomatology might develop over time. Small initial differences in temperament, possibly arising from genetic differences, might cause a slightly moodier twin to gravitate toward moodier peers (active rGE) and elicit negative relationships with peers and parents (evocative rGE) compared to his or her slightly less moody sibling. The reciprocal exchange between the moodier sibling and the moodier peers could lead to increased social rejection, which in turn might exacerbate prodromal depression, leading to further worsening of personal relationships and eventually to diagnosable major depressive disorder. Meanwhile, the slightly less moody sibling, who at any single point in time differs only slightly from his or her sibling in genetic risk, would select into more favorable environments, initiating a cascade of reciprocal cause and effect leading to better mental health.
The benefit of the Dickens and Flynn approach is that it demonstrates the important effects transient phenotypic differences can have on subsequent selection for environmental differences against a constant genetic backdrop. Dickens, Turkheimer, and Beam (Reference Dickens, Turkheimer, Beam, Kendler, Jaffee and Romer2011) showed the time-limited persistence of transient nonshared environmental effects on IQ within twin pairs in adolescent and middle-aged participants. Here, we use the Dickens and Flynn reciprocal effects approach to address the question of how a gene–environment matching process can contribute to persistent twin or sibling differences over the course of the life span, in particular for differential development of psychopathology within twin pairs.
Present Paper
We present simulation studies to demonstrate processes that could cause siblings raised in the same family to differentiate over the course of development. Building on arguments developed elsewhere that suggest that phenotype, not genotype, generates changes in individuals' environments (Turkheimer, Reference Turkheimer and DiLalla2004; Turkheimer & Gottesman, Reference Turkheimer and Gottesman1996), we first show how the cumulative outcome of individuals' behavior, consisting of shared and unshared genotypes and environments, can affect the relative quality of their subsequent within-family environments, and in so doing produce within-pair differentiation over time. We then explore the consequences of analyzing data that include explicit within-pair P ⇔ E effects with classical developmental models that omit them. We will show that although classical developmental twin models that assume no rGE will fit data generated under conditions of rGE, they can lead to misleading results. Finally, we discuss the discuss implications of our simulations and models for research on the development of psychopathology.
Method
Data simulation
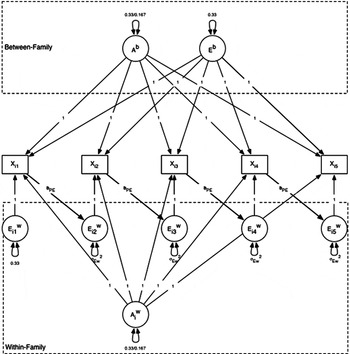
We simulated phenotypic scores for 1,000 MZ pairs and 1,000 DZ pairs according to the path diagram depicted in Figure 1. The path diagram consists of two main parts: a “between-pair” model on the top and a “within-pair” model on the bottom. As described previously, the between-pair model describes the composition of the pair means, and the within-pair model describes the deviations of the individual twins from their pair mean. The between- and within-pair portions are combined to create the observed scores X i in the center of Figure 1. We have simulated five measurement occasions, X 1–X 5.
Simulated within-family phenotype–environment effect model. X, simulated phenotypic twin score; A b, between-family genetic effect; E b, between-family environmental effect; A iw, within-family genetic effect; E iw, within-family environmental effect; b PE, phenotype–environmental effect of low (0.10) or moderate (0.40) value. A b and A iw variances on the left-hand side of the slash (/) specify MZ twin variances and DZ variances are on the right-hand side.

The simulation works as follows. At the between level, we created a normally distributed random variable A b, which represents a single stable between-pair genetic component that contributes equally to all measurement occasions. Similarly, we created a normally distributed random variable E b, which represents a single stable between-pair environmental component (equivalent to the shared environmental, or C, term in the classical twin model) and contributes equally to all measurement occasions. Within families, we created a normally distributed random variable A w, representing genetic differences within twin pairs. We then created five within-pair environmental variables, E wi1 to E wi5 (equivalent to the E terms of a classical twin model). These terms represent environmental variance that make twins and siblings raised together different from each other, and consistent with the literature, we included them as a unique independent contribution at each occasion.
The variances of the A b and A w terms depended on the zygosity of the simulated twin pair. Our goal was to assign the total of the A w and A b terms each with a third of the total variance of the observed scores, which had a standardized variance of 1.0. For MZ twins, all of the genetic variation is between pairs and none of it is within pairs, because the twins are assumed to be genetically identical. We therefore generated the A b term with a full variance of 0.33 and the A w term with 0 variance (all identical twins received a A w score of 0). In the DZ twins, half of the genetic variance is between pairs and half is within pairs, so A w and A b were each generated with a variance of 0.5 × 0.33 = 0.167. The E b terms had a variance of 0.33 in both the MZ and the DZ pairs.
The construction of the E wit terms was more complex, because this is where the P ⇔ E process took place. At Occasion 1, we could simply generate a normally distributed E wi1 term, one score for each twin in each pair. At subsequent occasions (i.e., Occasions 2–5), however, the E wit term was a linear function of the phenotypic score at the previous occasion. This part of the simulation may be clearer if expressed as an equation. For measurement occasions after the first t (t ≠ 1), the within-pair environment score of twin i in pair j at time t (E wijt) is a linear function of the within-family portion of the phenotype at the previous occasion:
 $$E^{\rm w}_{ijt} = b_{{\rm PE}}X_{ijt-1} + E^{{\rm w}^{\prime}}_{ijt}.$$
We simulated two different phenotype–environment (P ⇔ E) values, denoted as b PE in Equation 1: one in which the regression coefficient predicting Occasion 2 within-pair environmental score (e.g., predicting a pair of twins' age 11 differences in environmental liability from their differences in age 10 depressed mood) was set at a low value of 0.10 and a second in which the regression coefficient was set at a moderate value equal to 0.40. The variance of the residual E w′ijt was selected in order to keep the phenotypic variance constant at Occasions 1 and 2, and remained at that value thereafter. The genetic, shared environmental, and nonshared environmental effects were set to account for one-third of the total unit variance at time 1 (A + C + E = 0.333 + 0.333 + 0.333 = 1.0). Although this choice was arbitrary, we decided to make them equivalent to demonstrate how apparent heritability and nonshared environmental variation change as the within-pair P ⇔ E process unfolds. All simulations and models were conducted using the Monte Carlo simulation function in Mplus 6.11 (Muthén & Muthén, Reference Muthén and Muthén2011).
Refitting and model misspecification
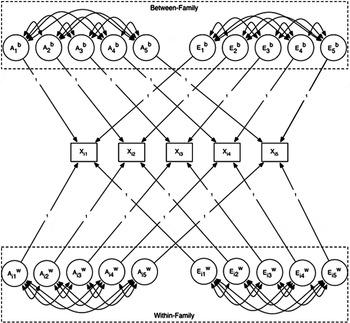
We first fit a model that recovered the parameters of the simulation, to ensure that the model was correctly specified and to calculate the covariance matrix among the longitudinal parameters implied by the P ⇔ E process. We then fit a classical correlated genetic (A), shared environmental (C), and nonshared environmental (E) values (ACE) factor model to the simulated twin data, as illustrated in Figure 2. We refer to this as a “misspecified” model because we intentionally fit a model to data that we know to have been generated by a different model. Specifically, we fit a model without rGE to data that were explicitly generated with rGE. In the misspecified model, each of the five measurement occasions was decomposed into independent ACE components, with no rGE. The misspecified model estimated the genetic, shared environmental, and nonshared environmental variances at each measurement occasion, and the ACE covariances across measurement occasions, under the assumption of no underlying P ⇔ E and rGE. Our goal in this analysis is to show that although traditional developmental models without rGE can be fit to data explicitly generated with rGE, the results may be misleading in a number of ways.
Misspecified correlated classical genetic (A), shared environmental (C), and nonshared environmental (E) values (ACE) factor model fit to the simulated five occasion data sets. X i, simulated phenotypic twin score across five measurement occasions; A b, between-family genetic effect; E b, between-family environmental effect; A iw, within-family genetic effect; E iw, within-family environmental effect. Although not shown, A b and A w variance estimates in the dizygotic (DZ) twins equal one-half the A b variance of the monozygotic (MZ) twins. E b and E iw variance estimates were equal between MZ and DZ twins. The covariance matrix for the A b components and the A iw components are equivalent. A iw is estimated only in the DZ twins (no within-family genetic variation in the MZ twins).

Results
Descriptive statistics
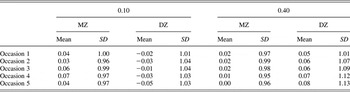
Table 1 shows the means and standard deviations of the 0.10 and 0.40 P ⇔ E simulations. The means are ~0 at each occasion (any deviations are due to sampling error), and the standard deviation at Occasion 1 is ~1.0 for both the simulated MZ and the DZ groups. The standard deviation remains approximately constant in the MZ twins over the five occasions and increases in the DZ twins. For example, for the P ⇔ E value of 0.40, the DZ variance increases by approximately 0.15 SD, or the square root of the mean proportion of the within-family genes transmitted via the phenotype.
Descriptive statistics of low (0.10) and moderate (0.40) phenotype–environment correlation simulated twin data across five measurement occasions

Note: MZ, monozygotic; DZ, dizygotic.
Within-pair rGE
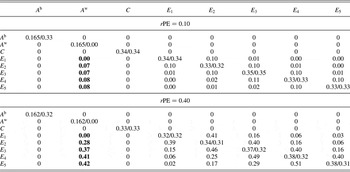
First, we present the findings from each of our simulations to show how within-family genetic and environmental components become increasingly correlated over time. P ⇔ E processes can only lead to within-family rGEs in DZ twins because within-pair phenotypic differences that are partly genetic in origin (the 50% of genetic variation unshared between DZ twins) are matched to their environmental differences over time. In the MZ twins (who have no within-pair genetic variation, by definition) rGE remains at zero. Table 2 shows the rGEs (from the Tech 4 Output command in Mplus) produced by the P ⇔ E process. For each simulation, there are five nonshared environmental terms, one for each measurement occasion, a single stable shared environmental component, and a single stable genetic component that is expressed both between and within pairs. In the DZ twins, the correlation between the nonshared environment and the genetic component starts at 0 but then increases, reaching a level of 0.08 in the low P ⇔ E simulation and 0.42 in the moderate simulation.
Latent variable variances (diagonal) and correlations for the between- and within-family genetic and environmental variance components for monozygotic (upper triangle) and dizygotic (lower triangle) twins

Note: rPE, phenotype–environment correlation; A b, between-family genetic effect; A w, within-family genetic effect; C, between- family environmental effect; E, within-family environmental effect.
The other consequence of the P ⇔ E process is that it induces longitudinal correlations between consecutive E terms, in both the MZ and the DZ twins. At low levels of P ⇔ E (0.10), these correlations, representing within-pair environmental stability, are constant in MZ and DZ twins (approximately 0.10) and decrease exponentially at increasing intervals (e.g., the correlation between E 1 and E 3 = 0.01 and the correlation between E 1 and E 5 = 0.00), as predicted by reciprocal effect models including demonstrable but short-lived environmental effects (Dickens et al., Reference Dickens, Turkheimer, Beam, Kendler, Jaffee and Romer2011). At moderate levels of P ⇔ E (0.40), the within-pair stability is constant in the MZ twins (~0.40) but increases over time in the DZ twins (from 0.39 to 0.51) and again decreases exponentially at increasing intervals.
Within-family phenotypic differentiation
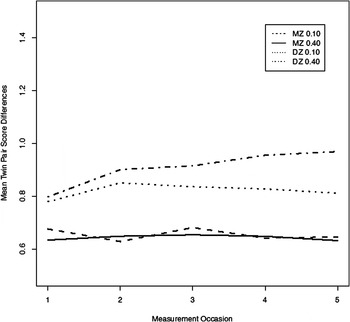
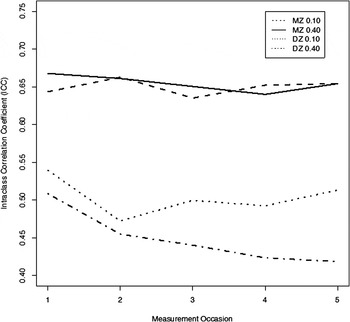
Figure 3 shows the mean absolute (i.e., unsigned) phenotypic within-pair difference over the five simulated occasions. For the low P ⇔ E (0.10) value, the mean MZ and DZ pair differences in observed scores over time (the X is) is slight. At moderate P ⇔ E values (0.40), however, MZ pair differences do not change over time, while DZ mean absolute pair differences increase substantially, demonstrating increasing twin differentiation as within-family genetic differences are matched to environments via the phenotype. The process of twin differentiation can also be demonstrated in terms of intraclass correlations (ICCs). Figure 4 shows that although the MZ ICCs remain constant over the five simulated occasions, the correlations decrease in the DZ simulated group over time, even at low P ⇔ E values.
Phenotypic monozygotic (MZ) and dizygotic (DZ) mean twin pair score differences over the five simulated occasions for low (0.10) and moderate (0.40) phenotype–environment effects.

Monozygotic (MZ) and dizygotic (DZ) interclass correlation coefficients across the five simulated occasions for low (0.10) and moderate (0.40) phenotype–environment effects.

The differential effect of P ⇔ E processes on the ICCs of MZ and DZ twins suggest that, if left unmodeled, P ⇔ E has the potential to produce misleading findings in classical longitudinal behavioral genetics. Although the simulated genetic effect was constant over all occasions, accounting for approximately one third of the total variance, the relatively constant ICC in the MZ simulated group combined with the decreasing ICC in the DZ simulated group implies that the heritability must increase over the measurement occasions. One can obtain a casual impression of this difficulty by simply doubling the difference between the MZ and the DZ ICCs at each measurement occasion. For low P ⇔ E values, heritability estimates increase from ~0.21 (Occasion 1) to 0.28 (Occasion 5). For moderate P ⇔ E values, the heritability estimate increases from 0.32 (Occasion 1) to 0.47 (Occasion 5). In the following section, we address the question of how P ⇔ E can affect classical developmental models in more detail.
Misspecified model
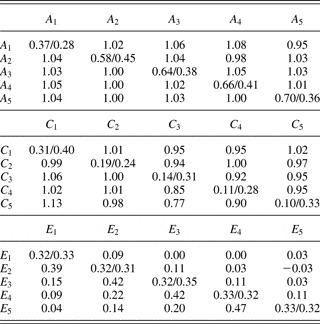
The misspecified model in Figure 2 fit the simulated data well at both low (root mean square error of approximation = 0.016) and moderate (root mean square error of approximation = 0.049) levels of the P ⇔ E simulated process, consistent with our prediction. Table 3 presents the ACE variances (diagonal) and correlations (off-diagonals) of the misspecified correlated ACE factor models over the five simulated occasions. The upper triangle and adjacent diagonal variances consist of genetic (A), shared environmental (C), and nonshared environmental (E) values produced with data generated with the low P ⇔ E value of 0.10, and the lower triangle and adjacent variances consist of correlations generated with the moderate P ⇔ E value of 0.40. For both low and moderate P ⇔ E, the misspecified genetic variances increase while the shared environmental variances decrease, although both terms took a single constant variance in the actual simulations. It is not surprising that the increases and decreases are greater at the moderate P ⇔ E value, consistent with the increase in the within-family DZ variance relative to the MZ variance.
ACE factor correlations and variances (diagonal) for low (upper triangle) and moderate (lower triangle) rPE from the misspecified (no rGE) correlated ACE models

Note: ACE, the additive effect of genes (A), environmental effects that are shared among twins or siblings raised together (C), and environmental effects that are not shared among twins or siblings raised together (E); rPE, phenotype–environment correlation; rGE, gene–environment correlation; low rPE = 0.10 and moderate rPE = 0.40. Corresponding variance estimates are adjacent to the upper (0.10) and lower (0.40) triangles. Subscripts 1–5 refer to the simulated measurement occasions.
The longitudinal correlations between the A terms, which were modeled as 1.0 in the simulation, are captured correctly by the misspecified model, although some estimate at slightly greater than 1.0. The shared environmental correlations are similar, especially at earlier ages and the lower P ⇔ E value. However, after Occasion 3, the lag 1 and lag 2 correlations begin to decrease. Finally, the lag 1 nonshared environmental correlations equal their respective P ⇔ E values, as expected. However, the lag 2 correlations show a general increase over time, which results from the underlying phenotype–environment effect.
Discussion
Differences among longitudinal twin models are notoriously difficult to detect, especially when there are only a few measurement occasions (Eaves, Long, & Heath, Reference Eaves, Long and Heath1986). This has been a problem, for example, in choices between simplex, autoregressive, and growth models of development: they fit longitudinal data equally well, representing the structure of longitudinal data in different ways (McArdle & Epstein, Reference McArdle and Epstein1987). Even when more than a few measurement occasions (greater than three) are available, however, difficulty arises in comparing the utility of models to recover the observed correlations among behavior over time, because different longitudinal models are not nested, which is to say that they are sensitive to different aspects of individual change. The same problem applies here, because models that include rGE cannot be compared statistically to models that ignore rGE. As a consequence, some of the more common findings in developmental behavior genetics, especially the widely observed increase in genetic variance over time, are not necessarily the result of developmental processes that mirror the models used to estimate them.
The goal of the present set of simulations was to show how a plausible alternate mechanism, in which genetic and shared environmental effects are constant and stable but phenotypic differences within pairs induce future within-pair environmental differences, can produce the appearance of rapidly increasing genetic effects over time. In the simulations, we showed that as the phenotype accounts for a greater portion of within-pair environmental variation, the ICCs between DZ twins, but not MZ twins, decrease. Thus, as genes become increasingly matched to within-family environments via the phenotype, DZ twins become more phenotypically differentiated. When fitting conventional models with no rGEs, we observed that longitudinal correlated ACE factor models fit the simulated data well but provided the wrong impression about the biometric features underlying development.
Increases in heritability through childhood and adolescence are frequently cited as one of the foundational findings of behavioral genetics. Bergen, Gardner, and Kendler (Reference Bergen, Gardner and Kendler2007) observed that heritability estimates increased for a variety of behavioral domains, including externalizing behavior, anxiety symptoms, depressive symptoms, alcohol consumption, and nicotine use. Despite the widespread acceptance of the increasing heritability phenomenon, surprisingly little is known about why it occurs. We propose that within-family P ⇔ E processes may explain why researchers often report increases in heritability and decreases in shared environmental effects across development. In some cases heritability increases may be an artifact of underlying within-family rGE, potentially underestimating the importance of environmental differences within twin pairs.
The simulations suggest that the focus of investigations of changes in heritability across development needs to be sharpened. Studies must proceed from simple observations of changes in standardized heritability coefficients to understanding of how MZ and DZ twin correlations change over time. If heritability increases across adolescence, is it because MZ twin correlations increase, DZ twin correlations decrease, or both? Upon inspection of several longitudinal twin studies, including studies of general cognitive ability (Bergen et al., Reference Bergen, Gardner and Kendler2007; Bishop et al., Reference Bishop, Cherny, Corley, Plomin, DeFries and Hewitt2003; Davis, Haworth, & Plomin, Reference Davis, Haworth and Plomin2009; Wilson, Reference Wilson1983), verbal abilities (Hoekstra, Bartels, & Boomsma, Reference Hoekstra, Bartels and Boomsma2007), and obesity (Haworth et al., Reference Haworth, Carnell, Meaburn, Oliver, Plomin and Wardle2008), the ICC coefficients reveal stable MZ correlations and decreasing DZ correlations. These findings suggest that understanding DZ twin (and by inference, sibling) differentiation during childhood and adolescence may be particularly important for unraveling the developmental processes leading to psychopathology.
In eating disorders, for example, Klump, McGue, and Iacono (Reference Klump, McGue and Iacono2000) showed that for overall eating disordered behavior there was “a dramatic increase in genetic and dramatic decrease in environmental (particularly shared environmental) influences in 17- relative to 11-year-old twins” (p. 245). The ICCs for the overall eating disorder scale showed that the 17-year-old MZ twin coefficient was 0.08 units greater than the 11-year-old MZ twin coefficient. However, the 17-year-old DZ female twin coefficient was 0.29 units less than the 11-year-old DZ coefficient.
Viewing developmental psychopathology through the lens of twin and sibling differentiation further suggests that the periods of late adolescence and early adulthood play a particularly important role. The studies of increasing heritability and decreasing DZ similarity cited above were conducted in children and adolescents. McGue and Christensen (Reference McGue and Christensen2012) conducted similar analyses of depression, cognitive ability and handgrip strength in a Danish sample ranging from 46 to 96 years of age and reported no changes in heritability or absolute pair differences for either zygosity. Similarly, Dickens et al. (Reference Dickens, Turkheimer, Beam, Kendler, Jaffee and Romer2011) showed that within-pair stabilities of intelligence were near zero in childhood, but near unity in adulthood. Although the literature is replete with longitudinal studies of children and adolescents, and to a somewhat lesser extent with longitudinal studies of adults, longitudinal studies spanning the transition from one period to another are difficult to find. This is unfortunate, because both our review of the literature and our simulations suggest that it is during young adulthood that highly malleable differences within families coalesce into stable adult patterns of behavior.
A better understanding of the developmental processes that produce increasing heritability of psychopathology during childhood will also require emphasis of unstandardized variance components rather than standardized heritabilities and shared environmental proportions of variance, which contain the quantities of interest in both the numerator and the denominator of the variance ratios that define them. Observing that heritability increases over time is not the same thing as observing that genetic variance increases over time, regardless of the developmental mechanisms that produce it. There may also be changes in phenotypic variances over time that obscure understanding of changes in standardized coefficients (Turkheimer & Harden, in press). As always, the goal of developmental studies of psychopathology is not only to model and catalog components of variance or their changes in time but also to understand the causal processes that explain normal and abnormal development.