I. INTRODUCTION
The recent and rapid renewal of research interest in thermoelectric materials has been driven by several critical factors: the need to increase the efficiency of power generation from waste heat and the efficiency of refrigeration technology, the need to reduce fuel consumption and therefore the dependence on fossil oil, and the need to reduce greenhouse gas emissions. Reports of considerably improved efficiency for a number of new materials, expressed as a figure of merit ZT (ZT = S 2T/ρκ, where ρ is the resistivity and κ is the thermal conductivity), have also drawn much attention (Tritt, Reference Tritt1996; Venkatasubramanian et al., Reference Venkatasubramanian, Siivola, Colpitts and O'Quinn2001; Hsu et al., Reference Hsu, Loo, Guo, Chen, Dyck, Uher, Hogan, Polychroniadis and Kanatzidis2004; Ghamaty and Eisner, Reference Ghamaty and Eisner2005; Dresselhaus et al., Reference Dresselhaus, Chen, Tang, Yang, Lee, Wang, Ren, Fleurial and Gogna2007). Thermoelectric materials with desirable properties (ZT ≫ 1, i.e., characterized by high electrical conductivity, high thermal power, and low thermal conductivity) are required for widespread applications.
Among various families of known thermoelectric materials (Nolas et al., Reference Nolas, Poon and Kanatzidis2006), the inorganic clathrates have attracted attention of the thermoelectric community in recent years (Cordier and Woll, Reference Cordier and Woll1991; Kuhl et al., Reference Kuhl, Czybulka and Schuster1995; Bobev and Sevov, Reference Bobev and Sevov1999, Reference Bobev and Sevov2000; Hermann et al., Reference Hermann, Tanigaki, Kawaguchi, Kuroshima and Zhou1999; Nolas et al., Reference Nolas, Weakley and Cohn1999; Chakoumakos et al., Reference Chakoumakos, Sales, Mandrus and Nolas2000; Gryko et al., Reference Gryko, Marzke, Ramachandran, Patton, Deb and Sankey2000; Gatti et al., Reference Gatti, Bertini, Blake and Iversen2003; Kaduk et al., Reference Kaduk, Wong-Ng and Nolas2003; Paschen et al., Reference Paschen, Pacheco, Bentien, Sanchez, Carrillo-Cabrera, Baenitz, Iversen, Grin and Steglich2003; Christensen et al., Reference Christensen, Juuranyi and Iversen2006, Reference Christensen, Johnson and Iversen2010; Kishimoto et al., Reference Kishimoto, Koyanagi, Akai and Matsuura2007; Deng et al., Reference Deng, Tang and Tang2009; Yan et al., Reference Yan, Tang, Li and Zhang2009). Type I compounds have a general formula of A8E46 and type II compounds have a general formula of A8B16E136. The crystal structures of these compounds contain two crystallographically distinct voids (i.e., large interstitial sites) that can accommodate rattling guest atoms. In type I compounds the two voids exhibit similar sizes (cage size of 24 vs. 20 atoms), whereas in type II compounds the void sizes differ significantly (cage size of 28 vs. 20 atoms). Rattling guest atoms located in these voids scatter phonons, thereby reducing thermal conductivity. Much research work has focused on type I materials because many of them are semiconductors with favorable thermoelectric properties (Cordier and Woll, Reference Cordier and Woll1991; Kuhl et al., Reference Kuhl, Czybulka and Schuster1995; Hermann et al., Reference Hermann, Tanigaki, Kawaguchi, Kuroshima and Zhou1999; Nolas et al., Reference Nolas, Weakley and Cohn1999; Chakoumakos et al., Reference Chakoumakos, Sales, Mandrus and Nolas2000; Gatti et al., Reference Gatti, Bertini, Blake and Iversen2003; Paschen et al., Reference Paschen, Pacheco, Bentien, Sanchez, Carrillo-Cabrera, Baenitz, Iversen, Grin and Steglich2003; Christensen et al., Reference Christensen, Juuranyi and Iversen2006, Reference Christensen, Johnson and Iversen2010; Kishimoto et al., Reference Kishimoto, Koyanagi, Akai and Matsuura2007; Deng et al., Reference Deng, Tang and Tang2009; Yan et al., Reference Yan, Tang, Li and Zhang2009). The majority of type II materials are metals and attempts are being made to convert them into semiconductors by substituting framework, alloying, and modifying cage sizes in the structure (Beekman et al., Reference Beekman, Wong-Ng, Kaduk, Shapiro and Nolas2007, Reference Beekman, Kaduk, Gryko, Wong-Ng, Shapiro and Nolas2009; Shi et al., Reference Shi, Yang, Bai, Yang, Wang, Salvador, Zhang, Chen and Wong-Ng2010).
Despite extensive efforts, the maximum ZT value of type I clathrates remains below 1, with the exception of several single crystals. In a recent article Shi et al. (Reference Shi, Yang, Bai, Yang, Wang, Salvador, Zhang, Chen and Wong-Ng2010), we demonstrated that transition metal doping introduces charge distortion and lattice defects into these materials, which increase the ionized impurity scattering of carriers and point defect scattering of lattice phonons, respectively. These effects enhance power factors, reduce lattice thermal conductivity, and therefore improve a thermoelectric figure of merit. We briefly depicted the structure of the Ni-doped Ba8Ni4Ge42 phase (Shi et al., Reference Shi, Yang, Bai, Yang, Wang, Salvador, Zhang, Chen and Wong-Ng2010). The present paper describes detailed structural characterization of the Ba8Ni4Ge42 phase using neutron diffraction, transmission electron microscopy (TEM), and extended X-ray absorption fine structure (EXAFS) measurements. X-ray diffraction patterns are especially important for phase characterization. Therefore, another goal of this investigation was to obtain reliable values of d-spacing and relative intensity of observed hkl reflections of the title compounds from an experimental X-ray diffraction pattern and to make them widely available through submission to the Powder Diffraction File [PDF (ICDD, In press)].
II. EXPERIMENTALFootnote 1
The Ba8Ni4Ge42 sample was prepared by induction melting of a mixture of elemental barium (Ba), nickel (Ni), and germanium (Ge) with excess (10%) Ba under an Ar atmosphere. The resulting melts were ground into fine powders, cold pressed into pellets, and annealed at 800 °C for one week. Annealing was done for an additional week to ensure uniform distribution for all elements. The final materials were reground into powders and consolidated by Spark Plasma Sintering at 650 °C for 10 min under a pressure of 50 MPa. Powder X-ray diffraction was used to determine the purity of the sample.
Neutron powder diffraction data were collected using the 32-detector BT-1 diffractometer with a Cu (311) monochromator (λ = 1.5403 Å) at the NIST Center for Neutron Research. Samples were loaded in a 0.5-inch-diameter vanadium can. Measurements were done under ambient conditions. The 2θ angular scanning range was 10°–160° in steps of 0.05°. Structure refinement was performed using the program GSAS (Larson and von Dreele, Reference Larson and von Dreele1992) and the initial structure parameters were taken from the report on Sr8Ga16Ge30 (Kaduk et al., Reference Kaduk, Wong-Ng and Nolas2003). The neutron scattering lengths for Ba, Ni, and Ge were 0.525, 1.03, and 0.819 × 10⁻¹² cm, respectively. The scale factor, background function parameters (high-order polynominals), profile parameters U, V, and W, asymmetry coefficient, unit-cell parameters, atomic coordinates, and displacement factors U ij were refined. The relatively large contrast in scattering amplitudes between Ni and Ge made it possible to determine the specific Ge site for Ni substitution; therefore, the site occupancies for all Ba and Ge/Ni were refined. In the final cycles, the occupancy factors of atoms that did not show significant deviation from 1.0 were fixed at 1.0. The mean-squared displacement factors of the same atom types were constrained to be equal.
Samples for TEM were prepared by dispersing the Ba8Ni4Ge42 powder on lacey carbon-coated grids. Electron diffraction experiments were conducted in a Philips TEM CM-30 operated at 200 kV.
EXAFS data were collected at room temperature in transmission for the Ni K-edge using the NIST X23A2 beam-line at the National Synchrotron Light Source. The double-crystal monochromator was operated with a pair of Si (311) crystals. The data were processed using the Athena code (Ravel and Newville, Reference Ravel and Newville2005) to extract EXAFS oscillations. Structural parameters were obtained by fitting the EXAFS Fourier transform, calculated using the FEFF6.0 (Ravel and Newville, Reference Ravel and Newville2005) code, to the experimental data. The fit was accomplished using Artemis software (Zabinsky et al., Reference Zabinsky, Rehr, Ankudinov, Albers and Eller1995).
The Ba8Ni4Ge42 powder was mounted in a corundum cell to measure the X-ray diffraction reference pattern in vacuum (≈0.013 Pa) on a PANalytical X'Pert Pro MPD diffractometer equipped with a PIXcel position-sensitive detector, a graphite diffracted-beam monochromator, and an Anton Paar HTK 1200N furnace. The pattern was measured (CuKα1 radiation of 1.540 63 Å, 40 kV, 40 mA, and 0.5° divergence slit) from 5 to 148° 2θ in steps of 0.013° for 0.5 s per step. The reference pattern was obtained using the Rietveld pattern decomposition technique (Larson and von Dreele, Reference Larson and von Dreele1992). In this technique, the peak positions are derived from the integrated intensities and positions calculated from the unit-cell parameters. When peaks are not resolved at the resolution function characteristics of a good laboratory diffractometer, the intensities are summed, and an intensity-weighted d-spacing is reported. Therefore, these patterns represent ideal specimen patterns. They are corrected for systematic errors both in d-spacing and in intensity.
III. RESULTS AND DISCUSSION
A. Structure of Ba8Ni4Ge42
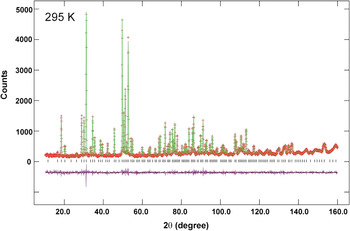
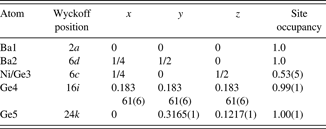
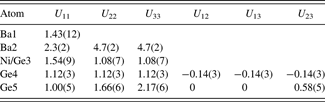
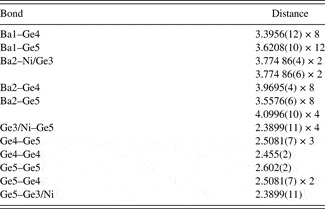
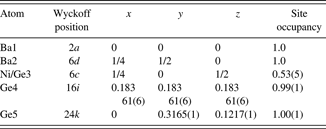
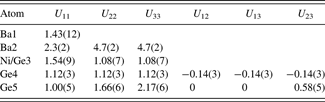
The results of Rietveld refinements using neutron powder diffraction for Ba8Ni4Ge42 are presented in Figure 1. The final refinements yielded residuals of R wp = 0.0497, R p = 0.0419, and χ 2 = 0.91 (with 37 variables and 2999 reflections). The refined atomic coordinates and atomic displacement parameters (ADPs) are reported in Tables I and II, respectively. The bond distances are listed in Table III.
(Color online) Observed (crosses) and calculated (solid line) XRD pattern for Ba8Ni4Ge42 by the Rietveld analysis technique. The difference pattern is plotted at the same scale as the other patterns. The row of tick marks indicates the calculated peak positions.

Refined coordinates for type I Ba8Ni4Ge42 (X-ray data are shown on the second line).
Refined displacement parameters (U ij × 100, Å2) for type I Ba8Ni4Ge42.
Bond distances (Å) in Ba8Ni4Ge42.

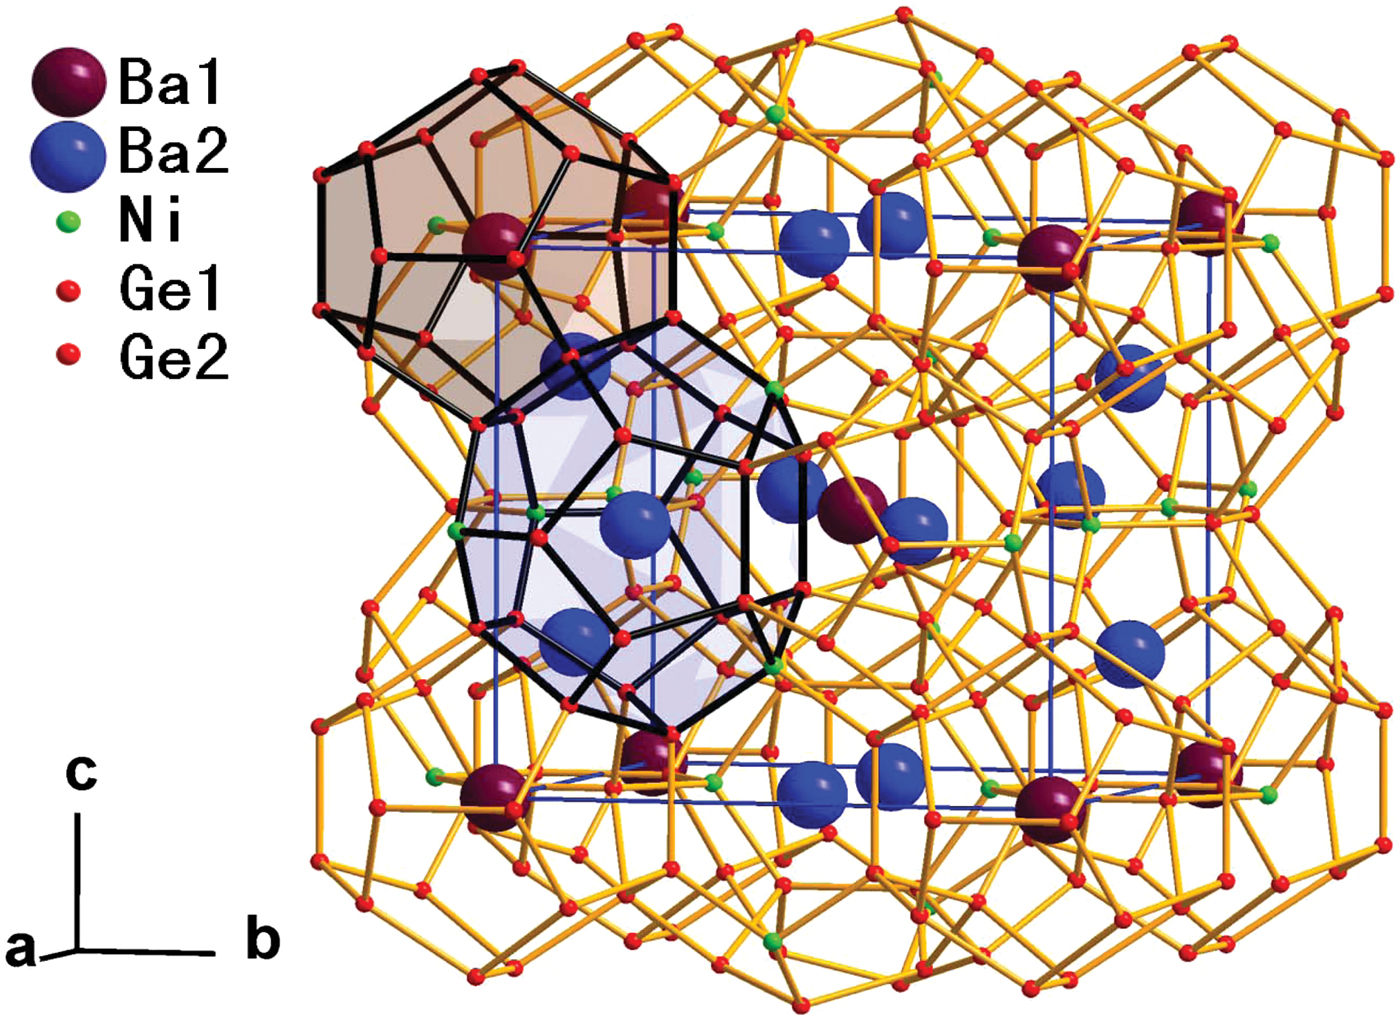
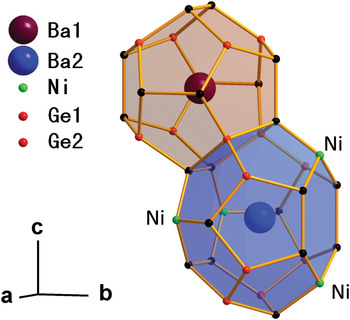
Ba8Ni4Ge42 crystallizes with the cubic structure [Pm n, a = 10.6769(2) Å and V = 1217.13(6) Å3]. Our results, in general, agree with the single-crystal work by Nguyen et al. (Reference Nguyen, Aydemir, Baitinger, Bauer, Borrmann, Burkhardt, Custers, Haghighirad, Höfler, Luther, Ritter, Assmus, Grin and Paschen2010). Figures 2(a) and 2(b) highlight two different types of polyhedra that form a unit cell of Ba8Ni4Ge42. The dodecahedron (20-atom cage with 12 pentagonal faces, Ge20) and the tetrakaidecahedron (24-atom cage with 12 pentagonal and 2 hexagonal faces, Ge24) are depicted in Figure 3. Each unit cell contains two Ge20 dodecahedra and six Ge24 tetrakaidecahedra. The Ge20 dodecahedra are linked via the interstitial 6c positions. The framework structure is formed by the tetrahedrally bounded network of Ge. Ba atoms reside in both the Ge20 and Ge24 cavities at the 2a and 6d sites, respectively.
(Color online) Framework structure of type I Ba8Ni4Ge42 clathrate featuring face-sharing Ge20 dodecahedra and Ge24 tetrakaidecahedra.

(Color online) Three crystallographically distinct framework sites in the structure are shown. The 6c, 16i, and 24k positions are shown as green, red, and black, respectively.

Ni atoms were found to exclusively occupy the 6c (¼ 0 ½) sites (Ge3) with the Ni:Ge ratio of 1:1 (Table I); these sites are located on the hexagonal faces of the larger tetrakaidecahedra (Figure 3). No Ni atoms were found in the smaller dodecahedra that consist of pentagonal faces. The stoichiometry of the compound was refined to Ba8Ni3.2(3)Ge42.8. Although the formula appears to be Ba8Ni4Ge42 within 3σ standard deviation of Ni concentration on the 6c site, there is possible Ni vacancy as suggested in the single-crystal work by Nguyen et al. (Reference Nguyen, Aydemir, Baitinger, Bauer, Borrmann, Burkhardt, Custers, Haghighirad, Höfler, Luther, Ritter, Assmus, Grin and Paschen2010). The preferential 6c site occupancy for Ni in Ba8Ni4Ge42 agrees well with previous reports on M-substituted compounds such as Ba8Cd8Ge38 (Czybulka et al., Reference Czybulka, Kuhl and Schuster1991), Cs8Cd4Sn42 (Wilkinson et al., Reference Wilkinson, Lind, Young, Shastri, Lee and Nolas2002), Ba8Mn2Ge44 (Kawaguchi et al., Reference Kawaguchi, Tanigaki and Yasukawa2000), and Cs8Zn4Sn42 (Nolas et al., Reference Nolas, Poon and Kanatzidis2006). Thus, the 6c site selection does not seem to be size dependent on the substituents. According to Gimarc (Reference Gimarc1983), the substitution site preference can be explained using the rule of topological charge stabilization and Mulliken population analysis (Miller, Reference Miller and Kauzlarich1996). The analysis suggests that the electropositive (or less electronegative) species occupy the framework sites with the lowest Mulliken population, whereas more electronegative species prefer the sites with the highest Mulliken population. On the basis of the findings of Miller (Reference Miller and Kauzlarich1996) that, in type I clathrate K8Si44, the 6c site has the lowest Mulliken population, Wilkinson et al. (Reference Wilkinson, Lind, Young, Shastri, Lee and Nolas2002) suggested that, in Cs8Cd4Sn42, the framework 6c Sn sites are expected to be substituted by less electronegative Cd atoms. Following these arguments, in Ba8Ni4Ge42, Ni, which is less electronegative (χ Ni = 1.91) than Ge (χ Ge = 2.01) (Pauling, Reference Pauling1960), is expected to substitute Ge on the 6c sites, as confirmed by our experimental results.
Different atomic sizes of Ge (covalent radius of 1.22 Å) and Ni (1.10 Å) (Pyykkö and Atsumi, Reference Pyykkö and Atsumi2009) affect bond lengths in Ba8Ni4Ge42. Table III lists all Ba1–Ge distances in the smaller Ge20 cage [ranging from 3.3956(12) to 3.6208(10) Å] and Ba2–Ge distances [ranging from 3.5576(6) to 4.0996(10) Å] in the larger Ge24 cage. The Ge–Ge distances in Ba8Ni4Ge42 were found to be in the range 2.455(2)–2.602(2) Å. These Ge–Ge distances are somewhat longer than those in pure Ge (2.445 Å) (Kaduk et al., Reference Kaduk, Wong-Ng and Nolas2003). The elongation can be attributed to the “extra” electrons available from Ba. The average bond length Ge–(Ge/Ni) [2.3899(11) Å] is significantly shorter because the atomic size of Ni is smaller than that of Ge. The tetrahedral angles around Ge sites are: Ge3/Ni [109.14(2)°–110.14(5)°], Ge4 [106.60(4)°–112.66 (3)°], and Ge5 [102.83(5)°–108.25(4)°]. Of these three tetrahedral sites, the Ge3/Ni site is the least distorted, relative to the ideal angle of 109.45°.
Table II summarizes the ADPs for Ba8Ni4Ge42. The ADP anisotropy may have an effect on the transport properties. Similar to the Cs atoms in Cs8Zn4Sn42 (Nolas et al., Reference Nolas, Weakley and Cohn1999), Ba atoms in the larger Ge24 cavities of Ba8Ni4Ge42 also exhibit greater (or more anisotropic) thermal motion than those in the smaller Ge20 cavities. As seen in the second column of Table II, Ba1 atoms located in smaller cages exhibit nearly isotropic ADPs (U 11 of 1.43 Å2), which acquire values similar to those of the framework atoms Ge and Ge/Ni. In contrast, the ADP U 22 and U 33 displacement factors of Ba2 (4.7 and 4.7, respectively) are three to four times larger than those for Ge, Ge/Ni, and Ba1. These large ADP values likely reflect rattling motions of Ba2 inside the large cage, which are expected to contribute to phonon scattering essential for reducing thermal conductivity. Neutron refinements provided no evidence of Ba2 disorder among off-centered sites in the tetrakaidecahedral cage.
B. TEM study
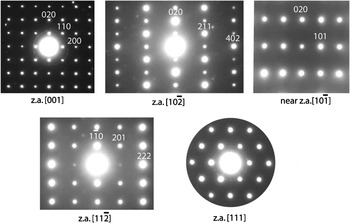
Representative selected area electron diffraction patterns recorded from the same crystallite of Ba8Ni4Ge42 are shown in Figure 4. The observed reflection conditions hhl: l = 2n and h00: h = 2n match the Pm n symmetry. Some of the weak diffraction spots seen in the patterns are associated with adjacent crystallites encompassed by the selected area diffraction aperture, whereas others arise from a contribution of reflections from the first-order Laue zone. The diffraction patterns revealed no visible superlattice reflections or diffuse scattering, thus ruling out any significant Ge/Ni ordering.
Representative selected area electron diffraction patterns recorded from the same single-crystalline grain of Ba8Ni4Ge42. In these patterns, “z.a.” stands for zone axis.

C. Local structure study
The normalized k-weighted EXAFS signal and its Fourier transform are shown in Figure 5(a) (dotted line). A starting cluster for the local-structure refinements was generated on the basis of the average structure obtained from neutron diffraction. The first two coordination shells, Ni–Ge and Ni–Ba, were included in the fit. The refined parameters included the energy shift, Ni–Ge and Ni–Ba distances, and their associated Debye–Waller (σ) factors. The results of the fit are displayed in Figure 5(b) (solid line). The refinements yielded R NiGe = 2.314(5) Å, σ NiGe = 0.006(1) Å2, R NiBa = 3.73(2) Å, and σ NiBa = 0.012(2) Å2.
(Color online) (a) The k 2-weighted EXAFS data for the Ni K-edge. (b) Magnitude of EXAFS Fourier transform (FT). The k-range used in the FT was 3.1–14.6 Å−1. Before an FT, the EXAFS signal was multiplied by the Hanning window with dk = 1. The r-space fitting range was 1–4 Å. Dotted and solid lines represent experimental and calculated data, respectively.

In a typical Ba8Ni4Ge42 structure, the Ge4 site is four-fold coordinated exclusively by Ge atoms (1Ge4 + 3Ge5). The average Ge–Ge distance for this coordination cluster estimated from Rietveld refinements is ≈2.50 Å. Therefore, for a mixed Ge0.33Ni0.67 site, the average distance to the neighboring Ge atoms is expected to be equal to ≈(1/3R GeGe + 2/3R NiGe) = (1/3 × 2.50 Å + 2/3 × 2.31 Å) ≈ 2.373 Å; here, the R NiGe distance was adopted from the EXAFS measurements. This estimate agrees well with R = 2.390 Å obtained for the distance between the mixed Ge3/Ni and pure Ge4 positions from Rietveld refinements. Thus, our EXAFS measurements support a 1:2 mixture of Ge and Ni on the 6c sites within the Pm n structure suggested by Rietveld refinements. The next nearest-neighbor coordination for the mixed Ge3/Ni site includes 4 Ba1 atoms. The EXAFS Debye–Waller factor for the Ni–Ba shell (0.012 Å2) is similar to the ADP value obtained for the Ba1 site (0.014 Å2) from neutron diffraction.
D. Powder X-ray diffraction pattern
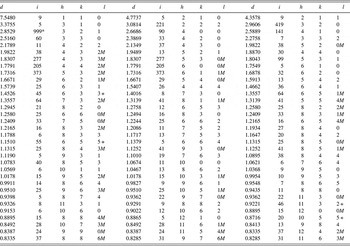
The powder X-ray diffraction pattern for Ba8Ni4Ge42 (Table IV) was submitted to the International Centre for Diffraction Data (ICDD) to be included in the PDF. The atomic coordinates obtained from Rietveld refinements agree well with the results from neutron diffraction. The cell parameter data obtained from X-ray diffraction [a = 10.6744(1) Å and V = 1216.28(1) Å3] were smaller than data obtained from neutron diffraction [a = 10.6769(2) Å and V = 1217.13(6) Å3] as the X-ray pattern was collected under vacuum (≈0.013 Pa). The intensity values reported are integrated intensities rather than peak heights.
X-ray powder pattern for Ba8Ni4Ge42 [Pm  n,a = 10.6744(1) Å, V = 1216.28(1) Å3, and D x = 5.986 g cm−3; λ (CuK α 1) = 1.540 63 Å].

The pattern was measured in vacuum ( ≈ 0.013 Pa). The symbols “M” and “ + ” refer to peaks containing contributions from two and more than two reflections, respectively. The symbol * indicates that the particular peak has the strongest intensity of the entire pattern and is assigned a value of 999.
IV. SUMMARY
Type I clathrate, Ba8Ni4Ge42, contains Ni exclusively on the least-distorted framework Ge 6c sites. EXAFS measurements supported a 1:2 mixture of Ge and Ni on the 6c (¼ 0 ½) sites within the Pm n structure. Electron diffraction patterns revealed no visible signs of Ge/Ni ordering. Powder diffraction patterns for Ba8Ni4Ge42 have been submitted to be published in the PDF.
ACKNOWLEDGMENTS
Use of the Advanced Photon Source at Argonne National Laboratory was supported by the U.S. Department of Energy, Office of Science, Office of Basic Energy Sciences, under Contract No. DE-AC02-06CH11357. This work utilized facilities supported in part by the National Science Foundation under Agreement No. DMR-0454672. Drs. X. Shi and Y. Yang acknowledge the partial support from the U.S. Department of Energy. Dr. G. Liu is thanked for his graphical assistance.