Implications
Some fat by-products of the food chain are used in animal feeding. However, the use of these fat materials is not well regulated in the European Union, and it is well known that the diet might alter the composition of animal's tissues and products. In our study, we assay the addition of palm-oil by-products to animal feeds. The results revealed that the addition of these by-products to feeds leads to changes in the fatty acid (FA) and tocol composition of rabbit and chicken meat, liver and plasma. The differences we found is corresponding to the effect of dietary tocol and FA composition, as well as to the animal species. These results could help to support future developments in policy strategies.
Introduction
The addition of fat to animal feeds is a common strategy for obtaining higher productive results in animal rearing. It increases the energy value of feeds, which is particularly convenient for those containing high amounts of fiber. In addition, fats provide essential nutrients such as polyunsaturated fatty acids (PUFA) and function as a delivery medium for several nutrients, such as liposoluble vitamins. The amount of fat added to feeds varies according to the animal species. High amounts of fat in the diet might affect the fat content and the composition of animal carcasses, which can have relevant repercussions on the nutritional and organoleptic properties of meat products for human consumption. As a consequence, the usual amounts of the fat added as ingredients vary between 2% and 10%, reaching up to 35% to 40% for fish species (Wood et al., Reference Wood, Richardson, Nute, Fisher, Campo, Kasapidou, Sheard and Enser2004).
It is widely known that the fatty acid (FA) composition of feed affects the FA composition of meat and other animal products (Bou et al., Reference Bou, Codony, Tres, Guardiola and Decker2009; Dalle Zotte and Szendro, Reference Dalle Zotte and Szendro2011). Because of this, special attention should be paid to the selection of the source of fat added to the feeds. The range of fat products available on the market as feed ingredients is wide, and does not only include fats of well-defined composition but also several by-products of the food chain whose composition and quality are not always well known. Their composition might vary according to the raw materials that they come from, the production process through which they are obtained and their storage conditions. Moreover, the levels of undesirable compounds such as trans fatty acids (TFA), lipid oxidation compounds and persistent pollutants can be high and variable enough in these by-products to be critical control parameters (Ábalos et al., Reference Ábalos, Parera, Abad and Rivera2008; Nuchi et al., Reference Nuchi, Guardiola, Bou, Bondioli, Della Bella and Codony2009). Despite the effects that these fat by-products may have on animal production and meat quality, few studies can be found in the literature dealing with the effects on tissue lipid composition and stability when these fat by-products are added to feeds. Our study was undertaken in the framework of a larger project (Feeding Fats Safety, http://www.ub.edu/feedfat/), dealing with the characterization of fat co- and by-products from the food chain used in feeds and their effects on animal production, animal tissue composition and meat stability. In a preliminary study, more than 120 commercial fat co- and by-products were characterized (Gasperini et al., Reference Gasperini, Fusari, Della Bella and Bondioli2007; Ábalos et al., Reference Ábalos, Parera, Abad and Rivera2008; Abbas et al., Reference Abbas, Fernández-Pierna, Codony, von Holst and Baeten2009; Nuchi et al., Reference Nuchi, Guardiola, Bou, Bondioli, Della Bella and Codony2009; Ubhayasekera and Dutta, Reference Ubhayasekera and Dutta2009; van Ruth et al., Reference Van Ruth, Rozijn, Koot, Garcia, van der Kamp and Codony2010), and those containing the highest levels of dioxins, polycyclic aromatic hydrocarbons and polybrominated diphenyl ethers, TFA and oxidation compounds were selected for testing in chicken and rabbit trials. This paper is the first of a series of articles reporting the effects of the addition of these selected fat by-products on the composition of animal tissues. In this study, a fat by-product rich in TFA (a hydrogenated palm fatty acid distillate, PFAD) was used as a feed ingredient, and its effects on the FA composition and the tocopherol and tocotrienol (tocol) contents of chicken and rabbit tissues (meat, liver and plasma) were studied in comparison with a non-hydrogenated PFAD (low in TFA). Data on the effects of these experimental diets on animal performance and health, and on cholesterol and cholesterol oxidation products, were obtained by other research groups collaborating as partners (Ubhayasekera et al., Reference Ubhayasekera, Tres, Codony and Dutta2010a and Reference Ubhayasekera, Tres, Codony and Dutta2010b) in the EC project Feeding Fats Safety.
Material and methods
Feed formulation and manufacturing
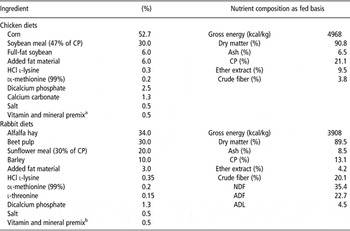
Experimental feeds were formulated according to the corresponding nutritional needs for chicken (National Research Council, 1994) and rabbit (De Blas and Wiseman, Reference De Blas and Wiseman1998). Feeds included 6% (w/w) or 3% (w/w) of fat, for chickens and rabbits, respectively. Feed ingredients and the average nutrient composition are given in Table 1. In the case of rabbit feeds, robenidine was included as a coccidiostatic drug. Batches of rabbit feeds without this coccidiostatic drug were also prepared and distributed during the last fattening week. All feeds were manufactured at the feed plant of the Universidad Politécnica de Valencia (Spain). For the manufacture of rabbit feed, a 3 mm sieve was used for grinding and steam was added for meal conditioning from 18% to 20% humidity and 75°C to 80°C before pelleting. Chicken feeds were manufactured following the same procedure, but they were not pelleted.
Ingredients and average nutrient composition of the broiler chicken and rabbit diets

aComposition of vitamin and mineral premix used in chicken feeds (1 kg of feed contained): vitamin A: 6000 IU; vitamin D3: 1200 IU; vitamin E: 10 mg; vitamin K3: 1.5 mg; vitamin B1: 1.1 mg; vitamin B2: 4 mg; vitamin B6: 1.5 mg; vitamin B12: 9 μg; folic acid: 4 mg; biotin: 50 μg; pantothenic acid: 6 mg; nicotinic acid: 21 mg; choline: 360 mg; Mn: 75 mg; Zn: 50 mg; I: 0.18 mg; Fe: 30 mg; Cu: 6 mg; Se: 0.2 mg; Co: 0.2; ethoxiquin: 16 mg; choline chloride: 15 mg.
bComposition of vitamin and mineral premix used in rabbit feeds (1 kg of feed contained): vitamin A: 8375 IU; vitamin D3: 750 IU; vitamin E: 20 mg; vitamin K3: 1 mg; vitamin B1: 1 mg; vitamin B2: 2 mg; vitamin B6: 1 mg; nicotinic acid: 20 mg; choline chloride: 250 mg; Mg: 290 mg; Mn: 20 mg; Zn: 60 mg; I: 1.25 mg; Fe: 26 mg; Cu: 10 mg; Co: 0.7; butylhydroxianisole + ethoxiquin: 4 mg.
Experimental design
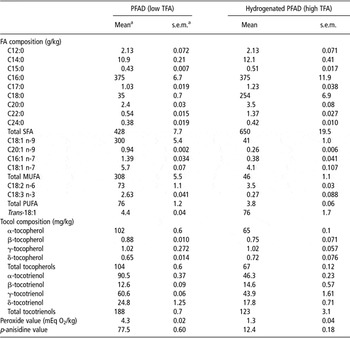
As mentioned above, fat was selected according to the TFA values found in the characterization of commercial fat by-products during the first step of the project (Nuchi et al., Reference Nuchi, Guardiola, Bou, Bondioli, Della Bella and Codony2009). Values found in the analyzed samples ranged between 0.1% and 10% TFA, the highest corresponding to hydrogenated PFAD samples. Therefore, in the animal trials, a hydrogenated PFAD was selected as the high TFA fat and a PFAD was selected as the control (low TFA fat). Thus, apart from the higher TFA content and the obviously increased saturated fatty acids (SFA) in the hydrogenated PFAD, it can be assumed that both fats have similar matrix characteristics. To improve the study of TFA effects, an intermediate TFA level was created by blending both fats (50 : 50, w/w), which was named medium TFA. Selected fats were characterized chemically (Table 2).
Chemical composition of the PFAD (low trans) and the hydrogenated PFAD (high trans) used in the animal diets

PFAD = palm fatty acid distillate; TFA = trans fatty acids; FA = fatty acids; SFA = saturated fatty acids; MUFA = monounsaturated fatty acids; PUFA = polyunsaturated fatty acids; s.e.m. = standard error of the mean.
aValues correspond to means (n = 5 replicates for each type of fat).
Both chicken and rabbit trials included three different dietary treatments, corresponding to the addition of PFAD (low TFA), hydrogenated PFAD (high TFA) and the 50 : 50 fat blend (medium TFA). All treatments were replicated eight times. According to this design, in the chicken trial, 96 seven-day-old Ross-308 female broilers were randomly distributed into 24 experimental groups (three dietary treatments per eight replicates) under standard conditions of temperature, humidity and ventilation. The animals were housed in groups of four per cage, and feed and water were provided ad libitum during the study. Broilers were killed when 47 days old in a commercial slaughterhouse. For the rabbit trial, a total of 144 rabbits, crosses of New Zealand and Californian rabbit, were housed in 24 collective cages (three treatments × eight replicates × six animals per cage). In all cases, feed and water were provided ad libitum. At 63 days of age, rabbits were electrically stunned and killed by cutting carotids and jugulars. The experimental trials received prior approval from the Animal Protocol Review Committees of the Universitat Autònoma de Barcelona and the Universidad Politécnica de Valencia. All animal housing and husbandry conformed to European Union guidelines.
Fat and feed samples
Oil samples were taken and stored under N2, in glass vials capped with Teflon caps, at −25°C until analysis. Feed samples were taken at the beginning of the trial. A 500 g aliquot from each of 10 sacks was taken, yielding a total of 5 kg that was homogenized. Then a sample of 1 kg was taken, packed in a hermetic plastic bag and kept at −25°C. Before analysis, feed samples were ground in a mill until they reached a suitable particle size (1 mm).
Meat, liver and plasma samples
Chicken and rabbit carcasses were refrigerated at 4°C for 24 h after death. Each cage was considered an experimental unit. From each cage, one leg of each animal was taken and legs were hand-deboned. Meat was pooled and ground. Meat samples were vacuum-packed (∼20 g meat per bag) in high-barrier multilayer bags (Cryovac BB325; permeability to O2, 25 cm3/m2 per day per bar at 23°C and 0% RH, ASTMD-3985; Cryovac Europe, Sealed Air S. L., Sant Boi de Llobregat, Spain) and stored at −25°C until analysis. The main difference between chicken and rabbit samples was that chicken meat samples were dark meat with skin while rabbit meat samples were leg meat. This sampling procedure was chosen according to the usual form in which these meats might be consumed. The main repercussion is that the lipid content was higher in chicken meat samples (mean value 10.4%, data obtained by analysis and expressed on a wet basis) than in rabbit meat samples (mean value 2.8%, data obtained by analysis and expressed on a wet basis). Livers were removed from carcasses immediately after death. Livers from animals in each cage were pooled, ground and vacuum-packed (∼15 g liver per bag) in high-barrier multilayer bags (Cryovac BB325) and stored at −80°C until analysis. Chicken plasma samples (∼5 ml) were obtained from blood taken by a syringe from the four birds of each cage, at 37 days. For rabbit plasma samples, approximately 20 ml of blood was collected from four rabbits in each cage when they were killed. Both chicken and rabbit blood samples were collected in heparinized tubes and immediately centrifuged at 1450 × g at 4°C for 10 min. Pooled plasma samples from the animals in each cage were homogenized and aliquots were transferred to plastic tubes (4.5 ml capacity) and stored at −25°C.
Reagents and standards
Butylated hydroxytoluene, α-tocopherol (αΤ) and pyrogallol were obtained from Sigma-Aldrich (St. Louis, MO, USA). FA methyl esters were obtained from Larodan Fine Chemicals AB (Malmo, Sweden) and Sigma-Aldrich (St. Louis, MO, USA). Tocopherol and tocotrienol standards were obtained from Calbiochem (La Jolla, CA). Methanol and ethanol used in tocol analysis were HPLC grade. Other reagents were ACS grade.
Characterization of experimental fats
The two fats (PFAD and hydrogenated PFAD) were characterized chemically according to Nuchi et al. (Reference Nuchi, Guardiola, Bou, Bondioli, Della Bella and Codony2009), including peroxide value, p-anisidine value, FA composition and tocol composition. The values obtained are reported in Table 2.
FA composition
The FA composition of feed, meat, liver and plasma was determined using gas chromatography, according to Tres et al. (Reference Tres, Bou, Codony and Guardiola2009), adjusted to the required sample amount. The FA methyl esters were prepared according to Guardiola et al. (Reference Guardiola, Codony, Rafecas, Boatella and Lopez1994).
Tocol content
Tocopherols and tocotrienols from feed, meat and liver were extracted after saponification according to Bou et al. (Reference Bou, Guardiola, Tres, Barroeta and Codony2004). Plasma tocopherols and tocotrienols were extracted (without saponification) as described by Tres et al. (Reference Tres, Bou, Codony and Guardiola2009). Tocopherol and tocotrienol composition was determined using HPLC with fluorescence detection following a procedure adapted from Hewavitharana et al. (Reference Hewavitharana, Lanari and Becu2004).
Statistics
Each cage was considered an experimental unit. One-way ANOVA was used to determine whether the factor ‘hydrogenated fat added to feeds’ affected the FA and tocol contents of chicken (eight replicates × three levels) and rabbit (eight replicates × three levels) meat, liver and plasma. One-way ANOVA was used to determine whether the factor ‘hydrogenated fat added to feeds’ affected the meat-to-feed FA ratio, the liver-to-feed FA ratio and the plasma-to-feed FA ratio. Multifactor ANOVA (n = 48) was used to determine whether the factor ‘hydrogenated fat added to feeds’ affected the FA and tocol content of chicken and rabbit meat, liver and plasma (‘animal species’ factor) differently. In all cases, least-square means for the main factors that had a significant effect were separated using Scheffe's test, with α ⩽ 0.05 considered as significant. Software used was SPSS 15.0 (version 15.0.1, SPSS Inc., Chicago, IL, USA).
Results and discussion
FA composition of fats and feeds
The fat products tested in this study differed in their FA composition (Table 2): hydrogenated PFAD was richer than PFAD in TFA (76 v. 4.4 g/kg) and in SFA (650 v. 428 g/kg). In contrast, PFAD had lower monounsaturated fatty acids (MUFA) and PUFA contents than non-hydrogenated PFAD.
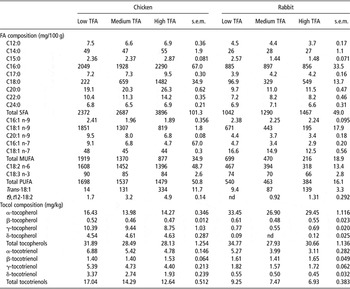
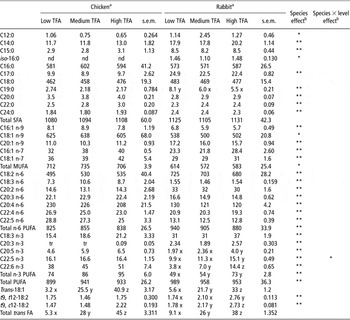
The addition of these fats to feeds affected feed FA composition, particularly the TFA content, C18:0 and C18:1 n-9 (Table 3). Obviously, feed FA composition also depended on all the other feed ingredients (Table 1). In fact, although the contents of C18:2 n-6 and C18:3 n-3 were only slightly different between the feeds containing different fats, their values were clearly different according to the factor animal species, as basal feed ingredients were very different for chicken and rabbit (Table 3).
FA and tocol composition of the experimental feedsFootnote a

FA = fatty acids; TFA = trans fatty acids; SFA = saturated fatty acids; MUFA = monounsaturated fatty acids; PUFA = polyunsaturated fatty acids; nd = not detected.
a Values correspond to means (FA determination: n = 2 for each treatment; tocol determination: n = 5 for each treatment). s.e.m. = pooled standard error of the means (for each animal species).
FA composition of meat
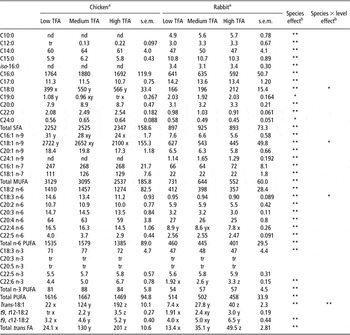
Table 4 shows the FA composition of chicken and rabbit meats. As mentioned above, chicken samples contained a mean value of 10.4% fat and consisted of a mix of muscle and skin (adipose tissue), whereas rabbit samples (2.8% of fat) only contained muscle tissue. This explained most of the differences in the meat FA composition between species (Table 4). However, other factors might also be responsible for these differences. For instance, chickens and rabbits present differences in their digestion process as well as in their nutritional behavior (i.e. cecotrophy in rabbits).
FA composition of chicken and rabbit meat (mg/100 g of meat), depending on the content of TFA (low, medium or high) of the fat added to feeds

FA = fatty acids; TFA = trans fatty acids; SFA = saturated fatty acids; MUFA = monounsaturated fatty acids; PUFA = polyunsaturated fatty acids; tr = traces; nd = not detected.
x, y, z values in the same row for a certain species with no common letters are statistically (P ⩽ 0.05) different according to one-way ANOVA for each animal species (n = 24 for chicken, n = 24 for rabbit). Letters were obtained by means of Scheffé's test (α = 0.05).
aValues correspond to means (n = 8 for each level and species). s.e.m. = pooled standard error of the means estimated by ANOVA (for each animal species).
bMultifactor ANOVA (n = 48, chicken+rabbit) was conducted to study whether the factor ‘addition of increasing levels of trans fatty acids to feeds’ led to different effects between animal species. *P ⩽ 0.05, **P ⩽ 0.01.
Apart from this, the FA composition of chicken and rabbit meat varied among treatments, depending on the feed FA composition and the animal's FA metabolism. The total TFA content in rabbit and chicken meat varied according to the inclusion of low, medium and high TFA levels in feeds. Increases in the content of C18:0 and decreases in the content of C19:0 and some MUFA, such as C16:1 n-9 and C18:1 n-9, were also observed in chicken meat (Table 4) as the level of TFA increased in feeds. However, this was not significant in rabbit meat samples. This could be related to the presence of adipose tissue from the skin in chicken samples.
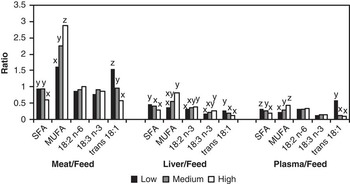
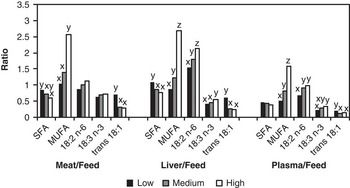
However, the deposition of trans-18:1 did not increase linearly with the increase of trans-18:1 in feeds. To reflect this fact, we calculated the meat-to-feed ratios (and also liver-to-feed and plasma-to-feed ratios) by dividing the concentration of the FA in meat – expressed in mg per 100 g (in the liver, expressed in mg per 100 g, and in plasma, expressed in mg per l) by the concentration of the FA in the corresponding feed (in mg per 100 g). These values do not express a real transfer, because feed consumption and live weight at sacrifice were not used in their calculation. However, we assume that the values obtained for these ratios are an estimate of the FA accumulated in tissues or circulating in plasma. These ratio values would be a global expression of several effects including differences in the supply of FA by each feed, and in FA consumption, digestion, absorption, metabolism and tissue deposition for chicken and rabbit. In meats, the relative content of trans-18:1 in relation to feed decreased as trans-18:1 increased in feeds (Figures 1 and 2). Furthermore, this decrease was more pronounced from low-to-medium TFA diets (from 0.79 to 0.32 in rabbits and from 1.54 to 0.95 in chickens) than from medium-to-high TFA diets (from 0.32 to 0.29 in rabbits and from 0.95 to 0.58 in chickens). This might be related to the maintenance of certain membrane fluidity in muscle tissues. According to this, the rate of incorporation of SFA was also reduced from low-to-high TFA diets (from 0.86 to 0.61 in rabbits and from 0.95 to 0.60 in chickens), and furthermore, the incorporation of MUFA (meat-to-feed ratios) increased from low-to-high TFA diets for both chickens (from 1.63 to 2.89) and rabbits (from 1.05 to 2.56), although the MUFA content was lower in the high TFA feeds (Figure 2). This can be attributed to the fact that part of the MUFA in tissues could be derived from endogenous synthesis or derivation from SFA, which might have been enhanced to maintain membrane fluidity (Ntambi, Reference Ntambi1999; Crespo and Esteve-Garcia, Reference Crespo and Esteve-Garcia2002). Moreover, the incorporation of trans-18:1 was higher in chicken than in rabbit (Table 4). However, due to the presence of the skin in chicken meat samples, it is not clear whether the higher incorporation of trans-18:1 in chicken meat is only due to the presence of the skin or whether it might also be related to differences between species in terms of digestion and deposition processes.
Chicken meat-to-feed, liver-to-feed and plasma-to-feed ratios for the content saturated fatty acids (SFA), monounsaturated fatty acids (MUFA), linoleic acid (C18:2n-6), linolenic acid (C18:3n-3) and trans-18:1 fatty acids (FA) depending on the fat added to feeds (x, y, z: bars having different letters for the same FA and tissue are statistically different (P ⩽ 0.05) according to one-way ANOVA for each species. Letters were obtained by means of Scheffé's test (α = 0.05).

Rabbit meat-to-feed, liver-to-feed and plasma-to-feed ratios for the content saturated fatty acids (SFA), monounsaturated fatty acids (MUFA), linoleic acid (C18:2n-6), linolenic acid (C18:3n-3) and trans-18:1 fatty acids (FA) depending on the fat added to feeds. x, y, z: bars having different letters for the same FA and tissue are statistically different (P ⩽ 0.05) according to one-way ANOVA for each species. Letters were obtained by means of Scheffé's test (α = 0.05).

Regarding PUFA, rabbit meat obtained from high TFA treatments had a 1.7-fold higher content of some long-chain n-3 PUFA, such as C22:6 n-3, although the content of linolenic acid, their precursor in biosynthesis, did not show differences either between feeds or meats (Table 4). Thus, it seemed that SFA-rich diets led to an increase in the content of long-chain PUFA in rabbit meat. As this effect was more evident for n-3 PUFA, and the Δ6-desaturase enzyme involved in their biosynthesis has a closer affinity with the n-3 precursor than with the n-6 precursor (Burdge and Calder, Reference Burdge and Calder2005), a hypothesis for this effect could be the enhancement of the biosynthesis of these long-chain PUFA, although we did not determine enzymatic activities to confirm this. This mechanism, together with the lower content of linoleic acid in high TFA rabbit meat, could explain the slight but significant reduction observed for C22:4 n-6 (Table 4). Furthermore, these results might be controversial as Mahfouz et al. (Reference Mahfouz, Smith and Kummerow1984) have reported that TFA inhibit the activity of the Δ6-desaturase enzyme, although this was only checked for feeds containing much higher amounts of TFA. The final FA composition of animal tissues is the result of several processes, such as the absorption of FA from diets, their metabolism and their incorporation into tissues, all of which might be modified in order to maintain homeostasis. Thus, it is probable that, although impairments in the activity of Δ6-desaturase have been described for some TFA, the high SFA and MUFA contents may lead to a general increase and accumulation in some PUFA in order to compensate for the alterations in membrane fluidity.
Significant differences were also found between rabbit and chicken meat in t9,c12-18:2 content (Table 4), which was higher in rabbit meat despite its lower fat content. This FA can be formed by intestinal bacteria and then be excreted into feces (Gómez-Conde et al., Reference Gómez-Conde, Menoyo, Chamorro, Lopez-Bote, García-Rebollar and De Blas2006; Leiber et al., Reference Leiber, Meier, Burger, Wettstein, Kreuzer, Hatt and Clauss2008). As rabbits practice coprophagy, t9,c12-18:2 might be re-ingested and then accumulated in rabbit tissues in higher amounts than in chicken. This nutritional behavior might also explain the presence of iso-FA in rabbit meat (Table 4), such as iso-16:0, which was not present in chicken meat.
FA composition of the liver
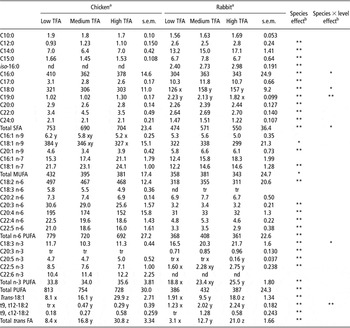
Liver FA composition was also affected by dietary added fats and by the animal's metabolism. The trans-18:1 content in the liver was higher in those chickens and rabbits on diets containing hydrogenated PFAD (high TFA feeds; Table 5). However, similar to that observed in meat, the content of trans-18:1 in the liver did not increase at the same rate as the trans18:1 level increased in feeds. Figures 1 and 2 show that the liver-to-feed ratios for trans-18:1 decreased as the TFA level in feeds increased, both for chicken and for rabbit (i.e. in rabbit, from 0.60 to 0.24 from low-to-high TFA liver). As in meat, it seems that FA are selected during fat digestion, absorption and metabolism to maintain a certain membrane fluidity. This might also explain why the SFA content in chicken and rabbit liver (Table 5) did not vary among treatments, although their contents were higher in feeds containing hydrogenated PFAD (Table 3).
FA composition of chicken and rabbit liver (mg/100 g of liver) depending on the content of TFA (low, medium or high) of the fat added to feeds

FA = fatty acids; TFA = trans fatty acids; SFA = saturated fatty acids; MUFA = monounsaturated fatty acids; PUFA = polyunsaturated fatty acids; tr = traces; nd = not detected.
x, y, z values in the same row for a certain species with no common letters are statistically (P ⩽ 0.05) different according to one-way ANOVA for each animal species (n = 24 for chicken, n = 24 for rabbit). Letters were obtained by means of Scheffé's test (α = 0.05).
aValues correspond to means (n = 8 for each level and species). s.e.m. = pooled standard error of the means estimated by ANOVA (for each animal species).
bMultifactor ANOVA (n = 48, chicken+rabbit) conducted to study whether the factor ‘addition of increasing levels of trans fatty acids to feeds’ led to different effects between animal species. *P ⩽ 0.05, **P ⩽ 0.01.
No differences were found in the MUFA content in the liver among dietary treatments for chicken or rabbit (Table 5), although the MUFA content in feeds decreased from low-to-high TFA diets (Table 3). One reason for this effect could be the increased biosynthesis of MUFA as a result of the enhancement of hepatic stearoyl-CoA-desaturase by the higher amounts of dietary SFA in diets containing hydrogenated PFAD (Sessler et al., Reference Sessler, Kaur, Palta and Ntambi1996) or by the higher amounts of cholesterol found in high TFA treatments (Ntambi, Reference Ntambi1999; Ubhayasekera et al., Reference Ubhayasekera, Tres, Codony and Dutta2010a and Reference Ubhayasekera, Tres, Codony and Dutta2010b). Furthermore, this enhancement might have been more pronounced in rabbits than in chickens because the liver-to-feed ratio for MUFA was higher in rabbits (Figure 2). This might be due to species differences in the FA metabolism, especially unsaturated FA (Figure 2).
The alteration in the content of PUFA in the liver as a result of the addition of hydrogenated PFAD to feeds also differed between animal species (Table 5). The PUFA content in chicken liver did not vary between treatments, but in rabbits, the content of long-chain n-3 PUFA (such as C20:5 n-3, C22:5 n-3 and C22:6 n-3) increased in relation to the amount of hydrogenated PFAD in feeds (Table 5) as it was found in meat. Differences in the incorporation of FA into hepatic tissue (Lands et al., Reference Lands, Inoue, Sugiura and Okuyama1982) might also account for these results. Furthermore, our results are in line with Gatto et al. (Reference Gatto, Lyons, Brown and Samman2001), who found higher proportions of linoleic acid and TFA in hepatic phospholipids of rabbits fed with TFA-enriched diets. They attributed this effect to an increase in the esterification of TFA and linoleic acid to phospholipids at the expense of palmitic acid, in order to maintain membrane fluidity. In fact, these authors also found concomitant decreases in the proportion of palmitic acid. As our diets contained increasing amounts of both TFA and SFA, we did not obtain a similar reduction of SFA in the liver, but similar SFA contents between treatments.
Rabbit liver-to-feed ratios for trans-18:1, SFA, MUFA and C18:3 n-3 were quite similar to the corresponding ratios in rabbit meat (Figure 2). Liver-to-feed ratios for C18:2 n-6 were higher than those in meat. This reflects a tendency of rabbit liver to accumulate PUFA, particularly FA from the n-6 series (Tres et al., Reference Tres, Bou, Codony and Guardiola2009 and Reference Tres, Bou, Codony and Guardiola2010). In fact, a preferential use of linolenic acid in the liver for β-oxidation (McCloy et al., Reference McCloy, Ryan, Pencharz, Ross and Cunnane2004) or for the biosynthesis of long-chain PUFA (Burdge and Calder, Reference Burdge and Calder2005) has also been reported in rabbits (Tres et al., Reference Tres, Bou, Codony and Guardiola2009). This effect was not found when meat-to-feed ratios and liver-to-feed ratios were compared in chicken, which might probably be again due to the presence of adipose tissue (skin) in chicken meat samples. Species differences in the metabolism of unsaturated FA could also be responsible for these effects.
FA composition of plasma
Plasma FA composition is affected both by the FA composition of the diet and by the FA exchange between tissues (for instance from their biosynthesis to their storage location). However, plasma levels of TFA (trans-18:1 and t9,t12-18:2) increased when their levels in feeds increased, for both chicken and rabbit (Table 6), following a pattern similar to that observed for meat and liver TFA content. Actually, these results might be a consequence of both the higher availability of TFA in high TFA diets and the higher TFA circulating in plasma during their transport to storage sites. Similar to what we found in meat and liver, the plasma-to-feed ratios for trans-18:1 decreased from low-to-medium TFA diets, particularly in chicken (Figure 1). Regarding SFA, significant but slight increases in the content of C18:0 were found in rabbit plasma when diets contained hydrogenated PFAD. However, no significant differences due to dietary treatment were observed for SFA in chicken plasma, in contrast to the differences found in the content of some SFA (such as C18:0) in chicken meat (Table 4).
FA composition of chicken and rabbit plasma (mg/l of plasma), depending on the content of TFA (low, medium or high) of the fat added to feeds

FA = fatty acids; TFA = trans fatty acids; SFA = saturated fatty acids; MUFA = monounsaturated fatty acids; PUFA = polyunsaturated fatty acids; tr = traces; nd = not detected.
x, y, z values in the same row for a certain species with no common letters are statistically (P ⩽ 0.05) different according to one-way ANOVA for each animal species (n = 24 for chicken, n = 24 for rabbit). Letters were obtained by means of Scheffé's test (α = 0.05).
aValues correspond to means (n = 8 for each level and species). s.e.m. = pooled standard error of the means estimated by ANOVA (for each animal species).
bMultifactor ANOVA (n = 48, chicken+rabbit) was conducted to study whether the factor ‘addition of increasing levels of trans fatty acids to feeds’ led to different effects between animal species. *P ⩽ 0.05, **P ⩽ 0.01.
The contents of C16:1 n-9 and C18:1 n-9 in chicken plasma followed the same tendency as that observed in meat and decreased in line with the lower MUFA content of diets containing hydrogenated PFAD (Table 3). But, as it was found in meat, the plasma-to-feed ratios for MUFA increased from low-to-high TFA feeds, in both chicken (from 0.23 to 0.43) and rabbit (from 0.48 to 1.59; Figures 1 and 2). The values reached were higher in rabbit plasma than in chicken (as it was found in the liver), reflecting the higher tendency of rabbit to select MUFA (by absorption and/or by metabolism) when TFA increased in the diet (Figures 1 and 2).
Finally, plasma PUFA was less affected in general. As observed in meat and liver, no effects were observed in chicken plasma PUFA contents. However, in rabbit plasma, some n-3 PUFA increased similar to the findings in meat and liver (Tables 4, 5 and 6). The plasma-to-feed ratios for PUFA also showed significant differences according to the TFA level and, as it was found for MUFA plasma-to-feed ratios, they were also higher in rabbits than in chickens (Figures 1 and 2), reflecting overall differences between species in the absorption and metabolism of FA, particularly for unsaturated FA.
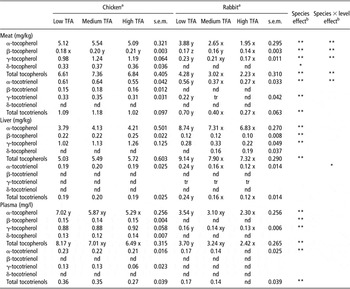
Tocopherol and tocotrienol composition
Regarding tocopherol and tocotrienol composition, both fat products (PFAD and hydrogenated PFAD) were rich in tocotrienols because PFAD came from palm oil (Tan et al., Reference Tan, Sambanthamurthi, Sundram and Wahid2007). However, hydrogenated PFAD had lower tocopherol and tocotrienol contents due to losses during the hydrogenation process (Table 2). Because of that, feed tocol (tocopherols+tocotrienols) contents were higher in feeds containing PFAD (low TFA feeds; Table 3).
Apart from the type and amount of fat added to the feeds, the vitamin–mineral premix included in feed formulations (Table 1) affected feed tocol composition (Table 3). Chicken feeds contained a higher amount of added fat (6%, w/w) than rabbit feeds (3%, w/w). In contrast, the vitamin–mineral premix added supplied 20 mg of αT per kg of rabbit feed and only 10 mg of αT per kg of chicken feed. This explains why the amount of αT was higher in rabbit feeds, but the amounts of other tocopherols and of tocotrienols were higher in chicken feeds (Table 3). According to this, chicken samples were richer in tocotrienols than rabbit samples, particularly meat and plasma (Table 7).
Tocol composition of meat, liver and plasma of chicken and rabbit depending on the fat product added to feeds

TFA = trans fatty acids; tr = traces; nd = not detected.
x, y values in the same row for a certain tissue with no common letters are statistically different (P ⩽ 0.05) according to one-way ANOVA for each species. Letters were obtained by means of Scheffé's test (α = 0.05).
aValues correspond to means (n = 8 for each level and species). s.e.m. = pooled standard error of the means estimated by ANOVA (for each animal species).
bMultifactor ANOVA (n = 48, chicken + rabbit) was conducted to study whether the factor ‘addition of increasing levels of trans fatty acids to feeds’ led to different effects between animal species. *P ⩽ 0.05, **P ⩽ 0.01.
Tocotrienols were much lower than αT in all the tissues studied in both animal species. Intestinal cells absorb tocotrienols faster than tocopherols, and then both tocopherols and tocotrienols are transported in chylomicrons from the intestine and subsequently to the liver in remnants (Tsuzuki et al., Reference Tsuzuki, Yunoki and Yoshimura2007). There, αT is preferentially carried stereo-selectively by the cytosolic protein αT transfer protein (αTTP) to a very low-density lipoprotein and then it is released into the circulation (Schneider, Reference Schneider2005). As a consequence, the incorporation of αT from feeds to tissues was higher than for other tocols and tocotrienols such as γT, γ-tocotrienol or α-tocotrienol, and the liver was particularly rich in αT (Table 7).
Liver tocol content also varied between species and depending on the fats added to feeds. In rabbit, αT and α-tocotrienol contents decreased as diets contained more hydrogenated PFAD, but no differences among treatments were found in chicken liver (Table 7). Significant differences between chicken and rabbit were also found for meat tocol content (Table 7). Apart from possible differences due to absorption, the tocopherol and tocotrienol contents of chicken meat were higher because these samples also contained skin (adipose tissue). Thus, a direct comparison between the tocol content of rabbit and chicken meat should take into account the different metabolic and storage functions of adipose and muscle tissue. This explained that although the tocol content varied in both chicken and rabbit feeds depending on the added fat, the content of the different tocols did not vary between treatments in chicken meat (except β-tocopherol), but in rabbit meat, it decreased as diets contained more hydrogenated PFAD (Table 7).
Plasma αT content from both chicken and rabbit reflected the changes in the αT content found in feeds. Thus, animals on high TFA diets had lower plasma αT contents than animals on low TFA diets (Table 7). This reduction was more pronounced than the reduction observed in feeds, reflecting that the composition of the fat in feeds might have had an influence on the final plasma αT content.
Although chicken feeds contained less αT than rabbit feeds (Table 3), plasma from chickens was richer in αT than plasma from rabbits (Table 7), which could be due to differences between species regarding αT absorption. Furthermore, it is also well known that fat in the diet, which was higher in chicken feeds, contributes positively to the absorption of liposoluble vitamins such as αT.
General conclusions
The addition of fat by-products from the food chain, rich in TFA (and SFA) in chicken and rabbit feeds, altered the FA composition of meat, liver and plasma. This should be taken into account when animal products are intended for human consumption, because recommendations tend to minimize the intake of both TFA and SFA (Food and Nutrition Board, 2005), due to an incremental effect on the plasma values of total and low-density lipoprotein cholesterol concentrations. However, the TFA supplied by 100 g of chicken meat from animals on high TFA diets would correspond to less than 0.1% of the daily energy intake of a 2400 kcal diet, which is far below the values reported to increase cardiovascular risk (Combe et al., Reference Combe, Clouet, Chardigny, Lagarde and Léger2007). On the other hand, the inclusion of these by-products in animal feeds could also induce a decrease in the tocol content of animal tissues, although the differences found between the dietary treatments are minimal.
Acknowledgments
This study was supported by the 6th Framework Programme of Research of the European Commission, Feeding Fats Safety project (FOOD-CT-2004-07020).