


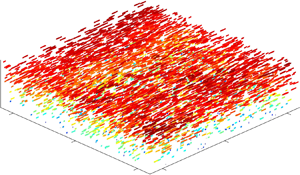

1. Introduction
It is well known that long-chain polymers and surfactants can significantly reduce the skin-friction drag of turbulent liquid flows by in excess of 60 %. This was first discovered for polymers by Toms (Reference Toms1948), and for surfactants by Mysels (Reference Mysels1949). Relative to polymers, early observations indicated that surfactants required greater concentrations to induce a comparably similar drag-reduction percentage (DR). For example, Mysels (Reference Mysels1949) used 2.5%–4.5 % by weight of surfactant, while Toms (Reference Toms1948) used approximately 0.05 % by weight of polymer to produce a similar amount of DR. Despite the economic benefit of requiring lower concentrations, polymer chains tend to break apart when exposed to high amounts of shear within the flow. This causes a permanent decay in the amount of DR – a process known as mechanical degradation (den Toonder et al. Reference den Toonder, Draad, Kuiken and Nieuwstadt1995). In contrast, the micelles formed from aggregating surfactant molecules possess a feature of self-reparability that prevents permanent mechanical degradation (Qi & Zakin Reference Qi and Zakin2002). As a result, polymer additives are generally confined to once-through systems, such as the Trans Alaska pipeline, where the fluid is not perpetually recirculated through high-shear devices (Burger, Munk & Wahl Reference Burger, Munk and Wahl1982). Surfactants, on the other hand, are often used to conserve pumping costs in closed-loop systems; significant in applications such as district heating and cooling (Krope & Lipus Reference Krope and Lipus2009). Similar to their respective practical applications, the research into polymer and surfactant drag reduction has taken different trajectories. Investigations have generally been confined to either polymers or surfactants, but rarely a direct comparison of the two. The focus of the current investigation is to conduct a detailed comparison of the rheology and turbulent flow field of polymer and surfactant drag-reduced flows. In the following discussion, we will review previous investigations of the rheology and turbulence pertinent to polymer and surfactant drag reducers.
Polymer drag reducers are classified as having either a flexible or a rigid molecular structure (Virk & Wagger Reference Virk, Wagger and A.1990). When dissolved in water, both flexible and rigid polymers form a solution that is generally shear thinning (Escudier, Presti & Smith Reference Escudier, Presti and Smith1999; Pereira, Andrade & Soares Reference Pereira, Andrade and Soares2013). Despite this common rheological feature, the traits that are typically attributed to drag reduction are the extensional viscosity and the elastic moduli (Lumley Reference Lumley1969; Tabor & de Gennes Reference Tabor and de Gennes1986). Both features are attributed to stretching of the polymer molecules; however, they imply different interactions between the polymer molecules and the turbulent flow (White & Mungal Reference White and Mungal2008). Using an opposed nozzle rheometer, Escudier et al. (Reference Escudier, Presti and Smith1999) showed that the DR of rigid and flexible polymer solutions was related to their extensional viscosity at low strain rates. For solutions of flexible polyacrylamide polymers, Owolabi, Dennis & Poole (Reference Owolabi, Dennis and Poole2017) demonstrated a correlation between DR and a characteristic relaxation time. The latter was obtained based on extensional stress growth using a capillary breakup extensional rheometer (CaBER), which is a more accurate means of measuring the extensional viscosity compared to the opposed nozzle apparatus (Dontula et al. Reference Dontula, Pasquali, Scriven and Macosko1997). However, such a relaxation time has not been reported for samples of rigid polymer solutions. The filament tends to break up rapidly upon filament extension using standard CaBER systems, owing to the significantly lower extensional viscosity of rigid polymer solutions (Pereira et al. Reference Pereira, Andrade and Soares2013; Mohammadtabar, Sanders & Ghaemi Reference Mohammadtabar, Sanders and Ghaemi2020). With regards to elasticity, a correlation between the elastic moduli of flexible and rigid polymer solutions and DR has yet to be confirmed experimentally (Pereira et al. Reference Pereira, Andrade and Soares2013; Mohammadtabar et al. Reference Mohammadtabar, Sanders and Ghaemi2020). Therefore, a common rheological property amongst flexible and rigid polymer solutions that correlates with DR has not been determined. Despite the apparent difference in the rheology of flexible and rigid polymer solutions, both polymer types significantly modify turbulent wall-bounded flows.
One of the most pronounced effects of polymer drag reducers is the redistribution of the mean velocity profile relative to the Newtonian law of the wall. The elastic sublayer model of Virk (Reference Virk1971) described drag-reduced flows of intermediate DR as having three layers: a viscous sublayer, a buffer layer – that was re-termed the elastic sublayer – and a logarithmic layer that was referred to as the Newtonian plug layer. Relative to Newtonian flows, the viscous and elastic sublayers of a polymer drag-reduced flow are thicker. The Newtonian plug layer possesses a similar slope as the logarithmic layer of a Newtonian flow, but a larger intercept due to the thickened buffer or elastic sublayer. At maximum drag reduction (MDR), the Newtonian plug layer is eradicated and the elastic sublayer demonstrates an ultimate profile, known as the MDR asymptote, determined empirically as  ${\langle U\rangle ^ + } = 11.7\,\textrm{ln}({y^ + }) - 17$ . Where, U is the streamwise velocity, y is the wall-normal distance from the wall and the
 $\langle \cdots \rangle$ symbol denotes time averaging. The superscript + indicates inner normalization in which velocity is normalized by the friction velocity, uτ, and y is normalized by ν/uτ, where ν is the kinematic viscosity of the fluid. The elastic sublayer model and the MDR asymptote have been observed in a number of experimental and numerical investigations (Min, Choi & Yoo Reference Min, Choi and Yoo2003; Ptasinski et al. Reference Ptasinski, Boersma, Nieuwstadt, Hulsen, van den Brule and Hunt2003; Kim et al. Reference Kim, Islam, Shen, Siriviente and Solomon2004; White, Somandepalli & Mungal Reference White, Somandepalli and Mungal2004). However, the model has since been adapted, stemming from the contributions of Warholic, Massah & Hanratty (Reference Warholic, Massah and Hanratty1999a) and White, Dubief & Klewicki (Reference White, Dubief and Klewicki2012). The most significant modification found by White et al. (Reference White, Dubief and Klewicki2012) was the discovery that the exact shape of the mean velocity profile at MDR is not logarithmic. They also conjectured that the slope of the profile may depend on the Reynolds number, Re, the canonical flow type or properties of the drag-reducing additive (see also, Elbing et al. Reference Elbing, Perlin, Dowling and Ceccio2013; White, Dubief & Klewicki Reference White, Dubief and Klewicki2018).
In addition to the redistribution of the mean velocity profile, the Reynolds stress distributions are also modified in polymer drag-reduced flows relative to those of a Newtonian flow, as confirmed by several experimental investigations (Ptasinski, Nieuwstadt & Hulsen Reference Ptasinski, Nieuwstadt and Hulsen2001; Escudier, Presti & Smith Reference Escudier, Nickson and Poole2009; Mohammadtabar, Sanders & Ghaemi Reference Mohammadtabar, Sanders and Ghaemi2017). Warholic et al. (Reference Warholic, Massah and Hanratty1999a) showed that polymer drag-reduced flows have different inner-normalized Reynolds stress profiles depending on whether the DR was in a state of ‘low’ or ‘high’ DR. The transition between these two states occurred at approximately 40 % DR, and was also noticed by an eradication of the Newtonian plug layer (White et al. Reference White, Dubief and Klewicki2012). The main distinction in the Reynolds stresses in the low and high DR regimes was the change in the peak value of the Reynolds stresses (Warholic et al. Reference Warholic, Massah and Hanratty1999a; Escudier et al. Reference Escudier, Nickson and Poole2009). For polymer drag-reduced flows of low DR, an increase in DR was accompanied by an increase in the peak streamwise Reynolds stress,  ${\langle {u^2}\rangle ^ + }$, and an attenuation in the wall-normal,
 ${\langle {v^2}\rangle ^ + }$, and spanwise Reynolds stresses,
 ${\langle {w^2}\rangle ^ + }$. Here, u, v and w indicate streamwise, wall-normal and spanwise velocity fluctuations. In contrast, polymer drag-reduced flows of high DR showed a decrease in all Reynolds stresses with increasing DR. The Reynolds shear stress,
 ${\langle uv\rangle ^ + }$, of a polymer drag-reduced flow decreased monotonically with increasing DR in both low and high DR regimes. Warholic et al. (Reference Warholic, Massah and Hanratty1999a) found that the profile of
 ${\langle uv\rangle ^ + }$ for drag-reduced flows close to MDR was approximately zero for all y+. Contrary to the findings of Warholic et al. (Reference Warholic, Massah and Hanratty1999a), other experiments and simulations have suggested a
 ${\langle uv\rangle ^ + }$ profile equal to zero is not a necessary condition for MDR (Ptasinski et al. Reference Ptasinski, Boersma, Nieuwstadt, Hulsen, van den Brule and Hunt2003). The discrepancy still remains unexplained, but it is generally accepted that flows near MDR have a significantly attenuated Reynolds shear stress profile (White & Mungal Reference White and Mungal2008).
Cryogenic transmission electron microscope images of drag-reducing surfactant solutions at rest are comprised of long threadlike micelles (Zhang et al. Reference Zhang, Schmidt, Talmon and Zakin2005). Although their presence has not been verified in a turbulent flow, these threadlike micelles are believed to be associated with a surfactant solutions ability to reduce drag (Bewersdorff & Ohlendorf Reference Bewersdorff and Ohlendorf1988). A common surfactant drag reducer is a cationic surfactant, which is readily used due to its affinity to produce DR over large temperature ranges and lack of precipitation when introduced to common minerals in domestic tap water (Qi & Zakin Reference Qi and Zakin2002). Cationic surfactants are characterized by their positively charged, hydrophilic head group and long alkyl chain. Some common examples of cationic surfactants include cetyltrimethylammonium bromide or trimethyltetradecylammonium chloride. When combined with a hydrophobic counterion, such as sodium salicylate or 3,5-dichlorobenzoate, repulsion forces between the positively charged surfactant molecules decrease, causing the molecules to aggregate and form micelles (Lu et al. Reference Lu, Li, Scriven, Davis, Talmon and Zakin1998). The resulting solution is often viscoelastic and drag reducing (Qi & Zakin Reference Qi and Zakin2002). Older experiments, such as Bewersdorff & Ohlendorf (Reference Bewersdorff and Ohlendorf1988) or Warholic, Schmidt & Hanratty (Reference Warholic, Schmidt and Hanratty1999b), used large surfactant concentrations of approximately 0.1%–0.2 % by weight to induce DR greater than 60 %. However, more recent experiments have used concentrations as low as 0.0065 % (65 ppm) to produce comparably large amounts of DR (Tamano et al. Reference Tamano, Itoh, Inoue, Kato and Yokota2009).
Depending on the type of surfactant, the concentration, and the temperature, the solution can exhibit a variety of rheological characteristics. Qi & Zakin (Reference Qi and Zakin2002) investigated rheological properties commonly found in solutions of drag-reducing surfactants, the likes of which include: shear-induced structures (SISs), a large extensional viscosity, and other viscoelastic properties. Extensional viscosity and viscoelasticity are rheological properties that are also common in polymer drag-reducing solutions and were briefly discussed earlier. SISs, on the other hand, are a unique property of surfactant solutions (Bewersdorff & Ohlendorf Reference Bewersdorff and Ohlendorf1988; Escudier et al. Reference Escudier, Nickson and Poole2009). SISs refer to an abrupt shear-thickening trend observed in the steady shear viscosity measurements at a critical shear rate (Ohlendorf, Interthal& Hoffman Reference Ohlendorf, Interthal and Hoffman1986; Hofmann, Rauscher & Hoffmann Reference Hofmann, Rauscher and Hoffmann1991). If the shear rate is increased further, well above this critical shear rate, the viscosity then decreases gradually, becoming shear thinning like most semi-dilute or concentrated polymer solutions (Qi & Zakin Reference Qi and Zakin2002; Escudier et al. Reference Escudier, Nickson and Poole2009). Authors such as Zakin, Myska & Chara (Reference Zakin, Myska and Chara1996) and Lu et al. (Reference Lu, Li, Scriven, Davis, Talmon and Zakin1998) have insinuated that SISs are a necessary condition for DR. However, in compiling several experimental results from existing literature, Qi & Zakin (Reference Qi and Zakin2002) concluded the contrary: that SISs are not necessary for DR. Qi & Zakin (Reference Qi and Zakin2002) referenced Lin (Reference Lin2000), who showed that high concentration surfactant solutions were capable of producing large amounts of DR (approximately 70 %) despite having no SISs, a zero first normal stress difference and an extensional viscosity comparable to water. Similar to polymer solutions, the rheological property of surfactant solutions that correlates with their DR is still unknown.
Several investigations have reported mean velocity profiles of surfactant drag-reduced flows that surpass the MDR asymptote of polymeric flows (Bewersdorff & Ohlendorf Reference Bewersdorff and Ohlendorf1988; Chara et al. Reference Chara, Zakin, Severa and Myska1993; Zakin et al. Reference Zakin, Myska and Chara1996). Zakin et al. (Reference Zakin, Myska and Chara1996) postulated a new limiting asymptote,  ${\langle U\rangle ^ + } = 23.4\,\textrm{ln}({y^ + }) - 65$, for surfactant drag-reducing additives based on the measurements of twelve different investigations. However, recent experiments have yet to replicate the findings of Zakin et al. (Reference Zakin, Myska and Chara1996). Warholic et al. (Reference Warholic, Schmidt and Hanratty1999b) used two-component laser Doppler velocimetry (LDV) to measure the mean velocity profile of a channel flow comprised of one of the surfactant solutions discussed in Zakin et al. (Reference Zakin, Myska and Chara1996). The results of Warholic et al. (Reference Warholic, Schmidt and Hanratty1999b) showed agreement with the MDR asymptote from Virk, Mickley & Smith (Reference Virk, Mickley and Smith1970) for polymer drag-reduced flows and not the unique limit proposed by Zakin et al. (Reference Zakin, Myska and Chara1996). Tamano et al. (Reference Tamano, Uchikawa, Ito and Morinishi2018) used particle image velocimetry and two-component LDV to measure the mean velocity profile of surfactant drag-reduced boundary layer flows using heterogeneous wall injection of a concentrated master solution. Tamano et al. (Reference Tamano, Uchikawa, Ito and Morinishi2018) observed a modification in the mean velocity profile that was in conformance with the elastic sublayer model proposed by Virk (Reference Virk1971). Findings from Warholic et al. (Reference Warholic, Schmidt and Hanratty1999b) and Tamano et al. (Reference Tamano, Uchikawa, Ito and Morinishi2018) suggest surfactants modify the mean velocity profile in a similar manner as polymers.
Few experiments have been performed where the turbulent Reynolds stresses have been measured in homogenous solutions of surfactant drag-reduced flows. The trend in the peak of the  ${\langle {u^2}\rangle ^ + }$ profile of surfactant drag-reduced flows, appears to depend on Re. For surfactant flows at MDR, Warholic et al. (Reference Warholic, Schmidt and Hanratty1999b) observed a smaller peak in
 ${\langle {u^2}\rangle ^ + }$ at the lowest tested Re relative to the Newtonian flow of water, but a greater
 ${\langle {u^2}\rangle ^ + }$ for two larger cases of Re. The investigation of Li et al. (Reference Li, Kawaguchi, Segawa and Hishida2005) also demonstrated that the Reynolds stress distribution of surfactant solutions depends on Re. The dependence of
 ${\langle {u^2}\rangle ^ + }$ on both Re and DR, and the smaller
 ${\langle {u^2}\rangle ^ + }$ with respect to
 ${\langle {u^2}\rangle ^ + }$ of a Newtonian flow, are not consistent with polymer drag-reduced flows. Warholic et al. (Reference Warholic, Schmidt and Hanratty1999b) demonstrated that the surfactant solutions at MDR had a significantly attenuated
 ${\langle {v^2}\rangle ^ + }$ profile and a
 ${\langle uv\rangle ^ + }$ distribution approximately equal to zero. Li et al. (Reference Li, Kawaguchi, Segawa and Hishida2005) also showed suppression in the
 ${\langle {v^2}\rangle ^ + }$ profile, but a non-zero
 ${\langle uv\rangle ^ + }$ distribution for solutions close to MDR. In addition, the trend in
 ${\langle {w^2}\rangle ^ + }$ has yet to be measured for a surfactant drag-reduced channel flow. Therefore, additional measurements of the Reynolds stresses of surfactant drag-reduced flows are required to confirm the trends and identify the anomalies.
The above summary could not point at any common rheological property that can be attributed to DR for drag-reducing surfactant and polymer solutions. This brings up the question of whether polymer and surfactant solutions share a similar mechanism for turbulent drag reduction. To address this question, the first step is to compare the turbulence statistics of polymer and surfactant drag-reducing solutions. Although using previously published experimental results might be possible, such a comparison of turbulent statistics is likely subject to errors brought about by inconsistencies in the flow conditions and the amount of DR. Better yet, would be to perform an experiment directly comparing the different additives. For this purpose, we have carried out a detailed measurement of turbulent statistics in drag-reducing polymer and surfactant solutions while maintaining the same mass flow rate and wall shear stress. The latter parameter is equivalent to maintaining the same DR, and was fulfilled by tuning the concentration and mechanical degradation of the drag-reducing additives. This would not only yield an effective comparison between the turbulence statistics of the polymer and surfactant solutions, but also allows evaluation of the rheology of solutions that produce the same DR.
The current investigation compares three drag-reducing additives that have significantly different molecular structures; a flexible polymer, a rigid polymer and a surfactant. The additive solutions are prepared such that the solutions impose the same level of wall shear stress at the same mass flow rate, i.e. same DR at the same mass flow rate. Two scenarios of DR are considered: a DR of approximately 58 % referred to as high drag reduction (HDR), and a MDR case with DR of approximately 70 %. To measure all three components of the velocity field with a high spatial resolution, we apply a novel three-dimensional particle tracking velocimetry (3D-PTV) based on the ‘shake-the-box’ (STB) algorithm (Schanz et al. Reference Schanz, Gesemann, Schröder, Wieneke and Novara2013). In addition, we also characterize the rheology of the drag-reduced solutions using a torsional rheometer and a capillary break-up extensional rheometer. The details of our experimental methodology are discussed in § 2, and are followed by a presentation of the results in § 3.
2. Experimental methodology
2.1. Flow facility
The present experiments were carried out in a recirculating flow loop comprised of a channel section, as shown in figure 1. The channel section had a rectangular cross-section with a height, H, of 15 mm and width, W, of 120 mm. It also consisted of four sub-sections connected with flanges as seen in figure 1. The third section from the channel inlet was made with glass walls for optical measurements. The measurements were carried out at the middle of this third section which was situated 107H downstream from the inlet of the channel section. This ensured a fully developed turbulent channel flow. The walls of the channel sections immediately upstream and downstream of the measurement section were cast acrylic. Transition fittings, 30 cm in length, were used to convert the cross-section from circular to rectangular, and vice versa. The complete length of the channel section was 168H. Figure 2 demonstrates the cross-section of the measurement section and the coordinate system used here. Position along the streamwise direction is denoted as x, while y is the wall-normal direction and z is the spanwise direction. The coordinate system is centred at the mid-span of the lower channel wall.
Annotated top view of experimental flow facility showing the pipe loop connected to the channel section.

Isometric view of the cross-section of the test section used for flow measurements.

Fluid was driven using a centrifugal pump (LCC-M 50-230, GIW Industries Inc.) controlled by a variable frequency drive. A thermocouple (Type K) and a double pipe heat exchanger were used to measure and maintain a temperature of 25 ± 0.5 °C. The mass flow rate,  $\dot{m}$, was measured using a Coriolis flow meter (Micro Motion F-series, Emerson Process Management) with an accuracy of ±0.2 %. A proportional integral derivative controller was used to maintain a constant
 $\dot{m}$ by controlling the input frequency to the pump. Static pressure loss along the channel was measured using a differential pressure transducer (DP-15, Validyne) with a 0.5 psi diaphragm. Ports for the pressure transducer were separated 109H, with the upstream port being 34H from the channel inlet.
Two methods are used to determine the wall shear stress, τw. The first method used measurements of the pressure drop, ΔP, where τw ,1 = hΔP/Δx, and h is half-channel height (H/2). Subscript, 1, is used to distinguish this first method and, going forward, will denote variables calculated based on ΔP. In the second method, τw ,2 characterized by the subscript 2, was determined using a wall-normal gradient of the mean velocity obtained from 3D-PTV measurements, and will be discussed in § 2.3. The drag-reduction percentage, DR, was established based on a comparison of τw of a drag-reduced flow and that of the flow of water at the same mass flow rate,  $\dot{m}$, according to,
 \begin{equation}DR = 100\left( {1 - \frac{{{\tau_{w,\; A}}}}{{{\tau_{w,N}}}}} \right),\end{equation}
where τw ,A is the wall shear stress of the additive solution and τw ,N is the wall shear stress of the Newtonian flow of water at the same  $\dot{m}$. We defined the DR derived from ΔP (and τw ,1) as DR 1, which is equivalent to DR 1 = 100(1 − ΔPA/ΔPN). In this equation, ΔPA is the streamwise pressure drop for an additive solution and ΔPN is the streamwise pressure drop for the flow of water at the same
 $\dot{m}$. All experiments with drag-reducing additives were performed at a
 $\dot{m}$ of 3.294 kg s−1, which corresponds to a bulk velocity, Ub, of 1.839 m s−1. For the flow of water, this flow rate equates to a bulk Reynolds number (ReH = UbH/ν) of 31 900 and friction Reynolds number (Reτ = uτh/ν) of 793. Certain drag-reducing solutions have a viscosity that is larger than that of water (Escudier et al. Reference Escudier, Nickson and Poole2009). Such an increase in kinematic viscosity of the flow will result in a decrease in Re although
 $\dot{m}$ and ΔP are kept constant. It is challenging to maintain a constant Re for the drag-reduced flows, since Re is calculated using the viscosity of the fluid at the wall-shear-rate, which is unknown a priori. In addition, changing
 $\dot{m}$ to set a desired Re, will vary ΔP and therefore the DR.
Additional measurements were also performed for water at lower  $\dot{m}$ to match the Reτ of the drag-reduced flows. Table 1 lists Ub, ReH, ΔP and τw ,1 for each flow case of water. Table 1 also provides τw ,2, the friction velocity uτ = (τw ,2/ρ)1/2, wall units λ = ν/u τ, and Reτ of each water flow experiment. Here ρ is the density of the fluid. The variables in the last four columns of table 1 are derived based on the estimated τw ,2 from 3D-PTV measurements. The method will be discussed and evaluated in § 2.3.
Flow properties for channel flow experiments using water as the working fluid.

2.2. Drag-reducing additives
Three different types of drag-reducing additives were chosen: a flexible polymer, a rigid polymer and a surfactant. To prepare the additive solutions, drag-reducing powders were weighed using a digital scale (AB104-S, Mettler Toldeo) with a 0.1 mg resolution, and added to 15 l of tap water. The combination was then agitated for approximately 2 h using a stand mixer equipped with a three-blade impeller set to 100 revolutions per minute (Model 1750, Arrow Engineering Mixing Products) and left to rest for approximately 16 h (Abu Rowin, Sanders & Ghaemi Reference Abu Rowin, Sanders and Ghaemi2018). The master solution was then added to the reservoir labelled in figure 1. The pump effectively mixed and diluted the 15 l concentrated master solution with 120 l of tap water, to bring the fluid to the desired concentration, c.
Two different cases of DR were considered for the present experiments. The first was a comparison of additive solutions at a high level of drag reduction (HDR). This case evaluated three drag-reduced solutions at a similar DR 1, approximately equal to 57.7 % ± 1.2 %. Seeing as the DR 1 is greater than 40 %, this comparison is in the ‘HDR’ regime according to Warholic et al. (Reference Warholic, Massah and Hanratty1999a). The HDR amount of 57.7 % was selected based on the largest DR that could be obtained using the rigid polymer. The second scenario was a comparison of the flexible polymer and surfactant solutions at MDR, which occurs at DR 1 of approximately 70.3 % ± 1.8 % for the Re considered here.
A common species of flexible polymers known as polyacrylamide (PAM) obtained from SNF Floerger was used here. PAM has been readily used in other experiments and has been shown to induce large amount of DR for relatively low values of c (Escudier et al. Reference Escudier, Presti and Smith1999, Reference Escudier, Nickson and Poole2009; Ptasinski et al. Reference Ptasinski, Nieuwstadt and Hulsen2001; Owolabi et al. Reference Owolabi, Dennis and Poole2017). Solutions of PAM are also transparent, which was ideal for the 3D-PTV measurements. When the concentration of PAM increased beyond 50 ppm, it was observed that DR 1 plateaued at approximately 68.5 %, as demonstrated by figure 3(a). This suggested that 50 ppm of PAM could generate the required MDR state. To achieve the HDR case, with smaller DR 1, the rotational speed of the centrifugal pump was increased to reduce DR 1 to the desired value by using mechanical degradation. Figure 3(b) demonstrates how this procedure was executed on a 50 ppm PAM solution. Upon initially adding the master solution to the reservoir and letting the loop mix the solution for about 2 minutes at a low pump speed, DR 1 was 68.5 % for a pump speed of 600 revolutions per minute (desired  $\dot{m}$ of 3.294 kg s−1). At this pump speed mechanical degradation is negligible and DR 1 remains constant. At t = 360 s, the pump speed was increased significantly to promote mechanical degradation. After approximately 720 s at a high pump speed, the pump speed was then returned to 600 revolutions per minute and the DR 1 became approximately equal to 58.0 %. While lower levels of c for PAM could produce the same effect, mechanical degradation at lower values of c would have been greater, making flow measurements challenging (Virk & Wagger Reference Virk, Wagger and A.1990; Pereira et al. Reference Pereira, Andrade and Soares2013). Therefore, we decided to use a degraded, 50 ppm PAM solution as opposed to a lower concentration solution of PAM for the case of HDR.
(a) Value of DR 1, as a function of c for PAM, (b) DR 1 of c = 50 ppm solution of PAM as a function of time, t, (c) DR 1 of XG as a function of c, (d) DR 1 of C14/NaSal (1 : 2 mM) as a function of c.

Most rigid polymers are polysaccharides that naturally occur and are biodegradable (Pereira et al. Reference Pereira, Andrade and Soares2013). The rigid polymer used here was xanthan gum (XG) from Sigma Aldrich (CAS No. 1138-66-2). Figure 3(c) demonstrates that the largest DR 1 achieved was 58.5 %, exhibited by 300 ppm of XG. The XG solution showed negligible amounts of degradation, similar to the findings of Pereira et al. (Reference Pereira, Andrade and Soares2013). The largest DR 1 achieved using XG was chosen as the common HDR value. Due to the limited drag-reduction capability of XG, no MDR case was achieved.
Cationic surfactants have a chemical structure: CnH2n+1N+(CH3)3Cl, where n is an integer generally from 12 to 18. Compounds are often referred to as Cn depending on the number of carbon atoms in a surfactant's alkyl chain, n. Based on our preliminary investigations, Trimethyltetradecylammonium chloride (n = 14) in combination with a sodium salicylate counterion (NaSal) at a molar ratio of 1 : 2 was deemed an appropriate surfactant-counterion pairing. Going forward this compound will be referred to as C14. Figure 3(d) shows that a 200 ppm (0.685 mM) solution of C14 produced DR 1 of 72.0 %. No increase in DR 1 was observed if the c of C14 was increased further. Therefore, 200 ppm of C14 was perceived to produce MDR. Choosing a c equal to 150 ppm of C14 (0.521 mM), with the same 1 : 2 molar ratio of C14 to NaSal, produced DR 1 of 56.5 % for HDR tests. The measurements of ΔP and DR 1 are listed in table 2 for each drag-reduced flow.
Bulk flow measurements from Coriolis flow meter and pressure transducer. To reiterate, DR 1 is calculated based on ΔP. *Solution was subject to mechanical degradation.

The skin-friction coefficient,  ${C_f} = 2{\tau _w}_{,1}/\rho U_b^2$, as a function of ReH, is demonstrated in figure 4 for flows of drag-reducing solutions and water. For drag-reduced flows, the kinematic viscosity, ν, that is used to calculate ReH, corresponds to the measured shear viscosity at the wall shear rate. The procedure will be discussed in §§ 3.1 and 3.3. The error bars shown in figure 4 propagate from random and systematic uncertainties in measurements of the flow rate, viscosity and streamwise pressure gradient. Figure 4 also presents two empirical correlations. The upper line in figure 4, corresponds to the
 ${C_f} = 0.073Re_H^{ - 0.25}$ correlation from Dean (Reference Dean1978) for a Newtonian turbulent channel flow that has a cross-section with W/H greater than 7. The measured Cf for the experimental data of water, shown by the blue markers in figure 4, are marginally lower than the Dean (Reference Dean1978) correlation equation. However, the results are in agreement with other turbulent channel flow experiments, several of which were used by Dean (Reference Dean1978) to obtain the correlation. The lower line in figure 4 corresponds to the MDR asymptote proposed by Virk et al. (Reference Virk, Mickley and Smith1970). The original correlation was intended to be used for pipe flows. To adapt the equation to a channel flow, similar to Owolabi et al. (Reference Owolabi, Dennis and Poole2017), the MDR asymptote is plotted using a Re that is calculated based on the hydraulic diameter,
 $R{e_{{D_h}}} = {U_b}{D_h}/\nu$, where Dh = 2HW/(H + W). The Cf of drag-reduced flows at MDR are about 15 % greater than the Cf of the correlation. It should be noted that there is considerable ambiguity in the equation describing the MDR asymptote in channel flows. Escudier et al. (Reference Escudier, Nickson and Poole2009) applied a correction factor to Re to account for potential secondary flows, while Ptasinski et al. (Reference Ptasinski, Boersma, Nieuwstadt, Hulsen, van den Brule and Hunt2003) simply used ReH. The choice of the length scale in defining Re will raise or lower the MDR asymptote along the vertical axis of the plot of Cf. Also, Virk et al. (Reference Virk, Mickley and Smith1970) remarked that the Cf relationship was derived from an integration of the asymptotic mean velocity profile. White et al. (Reference White, Dubief and Klewicki2012), among others, had cast doubt on the exactness of the mean velocity profile of drag-reduced flows at MDR. Therefore, the Cf distribution at MDR may also be erroneous and conditionally on the canonical flow type, Reynolds number and additive type (White et al. Reference White, Dubief and Klewicki2012).
Skin-friction coefficient as a function of bulk Reynolds number for drag-reduced flows and water. The upper equation shows the Dean (Reference Dean1978) correlation for Newtonian channel flows and the lower equation shows the MDR asymptote adapted for channel flows.

Shear and extensional viscosity measurements were performed on samples of each drag-reducing solution. The samples were collected from the flow loop using an outlet valve at the corresponding DR and the rheology measurements were performed immediately afterwards. The apparent shear viscosity, μ, as a function of shear rate,  $\dot{\gamma }$, for each additive solution and water, was determined using a torsional rheometer equipped with a double gap cylinder geometry (HR-2, TA Instruments). The four radii of the geometry, in increasing order, were defined as the inside cup radius (15.1 mm), the inside bob radius (16.0 mm), the outside bob radius (17.5 mm) and the outside cup radius (18.5 mm). The height of the sample immersed in the bob and cup was 53.0 mm. Shear viscosity measurements were performed three times for each sample listed in table 2 (including water) to establish the uncertainty of the measurements.
Relaxation time based on extensional viscosity, λE, was established using a CaBER (Haake CaBER, Thermo Scientific). Samples were placed between two circular plates, both of which were 6 mm in diameter and had a 3 mm separation from one another. After loading the sample, the top plate was displaced causing the solution to stretch in uniaxial extension (Barnes, Hutton & Walters Reference Barnes, Hutton and Walters1989; Rodd et al. Reference Rodd, Scott, Cooper-White and Mckinley2005). The final gap between the plates was 9 mm and the strike time to attain that final displacement was 50 ms. A laser micrometer was used to measure the midpoint diameter, D, of the sample as a function of time, t. Extensional characteristics, such as λE, were derived from fitting an equation of the form D(t) = Ae−Bt − Ct + E to the measurements of filament diameter, D, with respect to time, t (Anna & Mckinley Reference Anna and Mckinley2001; Miller, Clasen & Rothstein Reference Miller, Clasen and Rothstein2009), where A, B, C and E are fitting parameters. The value of B = λE/3 characterizes the relaxation time of the fluid, while C is indicative of the steady-state extensional viscosity (Anna & Mckinley Reference Anna and Mckinley2000). For the present experiment, the focus was prioritized on deriving λE for each sample and qualitatively comparing the uniaxial extensibility of each solution. CaBER measurements were also repeated three times for each solution.
2.3. Lagrangian 3D-PTV measurements
We carried out 3D-PTV using the state-of-the-art STB algorithm devised by Schanz, Gesemann & Schröder (Reference Schanz, Gesemann and Schröder2016). The STB algorithm predicts the three-dimensional particle position based on the established trajectories of previous time steps. The prediction is then corrected using an iterative particle reconstruction (Wieneke Reference Wieneke2013), where the particles are shifted (‘shaked’) in the volume (‘box’) until residual errors are minimized and a trajectory is established. The algorithm can analyse images with high seeding densities, allowing measurement of spatially resolved turbulent statistics and instantaneous flow structures. The efficacy of STB was exemplified by Schröder et al. (Reference Schröder, Schanz, Geisler, Gesemann and Willert2015), where the turbulent Reynolds stresses were accurately measured for y+ as low as 1.5.
The 3D-PTV system consisted of four high-speed cameras (v611, Phantom) and a high-repetition Nd:YLF laser (DM20-527 Photonoics Industries). Figure 5 provides a visual representation of the cameras and laser configuration. The laser emitted light with a wavelength of 532 nm and a maximum pulse energy of 20 mJ pulse−1. As seen in figure 5, the circular laser beam was directed in the spanwise direction of the channel (negative z). A lens combination shaped and collimated the beam into an oval profile. The resulting oval profile was then cropped to form a rectangular cross-section with 5 mm thickness in the wall-normal direction, covering from y = 0 to 5 mm. The laser sheet was 16 mm in the streamwise direction, x. To increase the light intensity for the backward scattered camera, the laser sheet was also reflected back onto itself using a large mirror situated on the opposite side of the test section (Ghaemi & Scarano Reference Ghaemi and Scarano2010).
Three-dimensional rendering of high-speed laser and camera array for 3D-PTV.

The four Phantom v611 cameras had a 1280 × 800 pixel complementary metal oxide semiconductor sensor with pixel size of 20 × 20 μm2 and 12 bit resolution. Scheimpflug adapters and Nikon lenses with a focal length of f = 105 mm were connected to the cameras. A reduced sensor resolution of 900 × 800 pixel was used to enable higher recording rates. The forward/backward scattering cameras (cameras 2 and 3 in figure 5) were placed along the z-direction and set to a lens aperture of f/16. The side scattering cameras (cameras 1 and 4) were placed along the streamwise x-direction with a lens aperture setting of f/11. The line of sight of cameras 2 and 3 had an angle of 60° with respect to each other, while the side scattering cameras were placed at 30° with respect to each other. The distance of the cameras to the measurement location was approximately 290 mm. This imaging configuration resulted in a magnification of approximately 0.56 and a resolution of 27.9 μm pixel−1. The cameras and laser were synchronized using a programmable timing unit (PTU X, LaVision GmbH). Fluids were seeded with 10 μm silver coated hollow glass spheres (S-HGS-10, Dantec Dynamics). The density of the tracers in the images was approximately 0.05 particles per pixel. The fidelity for which the tracer particles can follow the fluid flow can be defined by two parameters, the Stokes number, St, and Froude number, Fr (Bewley, Sreenivasan & Lathrop Reference Bewley, Sreenivasan and Lathrop2008). The local values of St and Fr of the particles can be approximated as St = tp/tf and Fr = up/uτ, and describe the significance of particle inertia and particle settling. The particle response time is  ${t_p} = {\rho _p}d_p^2/18{\mu _w}$, and the settling velocity is
 ${u_p} = ({\rho _p}-\rho)d_p^2g/18\mu$. Here ρp is the density of the particles and dp the diameter. The characteristic fluid response time, tf, was approximated as λ/uτ. The value of St was between 0.012 and 0.087 depending on the flow conditions. While the Fr for all flows was of the order of magnitude, 10−3–10−4. Therefore, particle inertia and particle settling was considered inconsequential.
One time-resolved data set, for each drag-reduced and Newtonian flow, consisted of 6800 single-frame images captured at a frequency between 2.5 and 4.5 kHz. Therefore, one data set was between 1.5 and 2.7 s in duration. Depending on Ub of the flow being measured, the image capture rate was determined such that a maximum particle displacement of approximately 10 pixels across successive frames was maintained. After recording the images, the minimum intensity of each data set was computed and subtracted to remove any glare points caused by surface scratches and tracer particles stuck to the bottom wall. Images were further enhanced by applying a sliding minimum subtraction with kernel of 7 pixels and local intensity normalization over a kernel of 50 pixels.
Calibration of the imaging system was carried out by fitting a third-order polynomial mapping function onto images recorded from a dual-plane calibration target (058-5, LaVision GmbH). To improve the accuracy of the mapping function, volume self-calibration was employed (Wieneke Reference Wieneke2008), which brought the average disparity down to 0.02 pixels. An optical transfer function was generated for iterative particle reconstruction in STB (Schanz et al. Reference Schanz, Gesemann, Schröder, Wieneke and Novara2013). The measurement volume was in the mid-span of the test section and had dimensions of (Δx, Δy, Δz) = 670 × 180 × 670 voxel = 24 × 5 × 24 mm3. Additional image and volume cropping mitigated noise common along the borders of the volume. Lastly, the STB algorithm was performed in DaVis 8.4 (LaVision GmbH). The maximum triangulation error was constrained to 1 voxel. Particle displacement was limited to a maximum value of 15 voxels. In addition, particles with a change in velocity exceeding 2 pixels or 20 % in successive image frames were discarded.
A moving second-order polynomial was fit on the particle trajectories in MATLAB. The length of the polynomial (kernel) was five time steps (1.11–2 ms) for obtaining first-order turbulence statistics. To mitigate noise in Reynolds stresses, a kernel with a length of 11 time steps (2.4–4.4 ms) was used. Trajectories less than the respective kernel length were removed from consideration. To obtain the velocity statistics, particle tracks were binned into slabs parallel with the wall, covering the entire measurement domain in the x and z directions. Each slab was 10 μm thick in the y direction for evaluating the mean velocity profiles (Δy+ ˜ 0.4–0.7) and 100 μm in the y direction for the Reynolds stresses (Δy+ ˜ 4.0–6.7). Both procedures incorporated a 75 % overlap between neighbouring slabs in the y direction. The statistics were obtained by averaging in time and the homogenous directions (x and z), and are indicated by angle brackets,  $\langle \cdots \rangle$. To obtain instantaneous velocity fields in a Eulerian frame of reference, the particle tracks were binned into 24 × 24 × 24 voxel cubes with 75 % overlap in all three directions. The instantaneous velocities in x, y and z directions were denoted by U, V and W, respectively. The corresponding velocity fluctuations were represented by u, v, w.
As previously established, a superscript of + is indicative of inner normalization by friction velocity, uτ, defined as (τw ,2/ρ)1/2, and wall unit, λ = ν/uτ. Here, ν is equivalent to μ w/ρ. For the inner normalizations, the wall shear stress is calculated as  ${\tau _w}_{,2} = {\mu _w}\,\textrm{d}\langle U\rangle /\textrm{d}y{|_w}$, where
 $\textrm{d}\langle U\rangle /\textrm{d}y{|_w}$ is the mean velocity gradient at the wall. Drag-reducing solutions can exhibit shear-thinning characteristics, where μ decreases with respect to
 $\dot{\gamma }$ (Warholic et al. Reference Warholic, Schmidt and Hanratty1999b; Ptasinski et al. Reference Ptasinski, Nieuwstadt and Hulsen2001; Escudier et al. Reference Escudier, Nickson and Poole2009). Therefore, the shear viscosity measurements, discussed in § 2.2, were used to estimate μ w at the wall shear rate, i.e. at
 $\dot{\gamma } = \textrm{d}\langle U\rangle /\textrm{d}y{|_w}$. To determine
 $\textrm{d}\langle U\rangle /\textrm{d}y{|_w}$, a linear fit was applied on the mean velocity profile within 2–4 < y+ < 5 in the linear viscous sublayer. The lower bound varied depending on the flow Reτ but it corresponded to y ≈ 60 μm. The efficacy of this procedure is discussed in § 3.2 by comparing the normalized mean velocity profile and Reynolds stresses for turbulent channel flow of water with results from direct numerical simulation (DNS) at a similar Reτ. Such an estimate of τw using the near-wall gradient of the mean velocity profile is an approximation for the drag-reduced flows. Solutions that are shear thinning can exhibit instantaneous variations in
 $\textrm{d}\langle U\rangle /\textrm{d}y{|_w}$ and therefore variations in μ w with time. To ensure τw ,2 of the drag-reduced flows was reasonable, we validated these results by comparing the estimated DR 2 with the DR 1 that was obtained using measurements of ΔP.
Uncertainty in the normalized velocity and Reynolds stresses are quantified based on two sources of error. The first source propagates from the uncertainty in measurements of μ. This was estimated by repeating the measurements of μ, which will be shown in § 3.1. The uncertainty in μ affects variables used for inner scaling, that is uτ and λ, following a root-sum-of-squares propagation of uncertainty (Wheeler & Ganji Reference Wheeler and Ganji2010). The second source of uncertainty is a random noise in the measured flow velocity associated with particle positioning in 3D-PTV. Using a spectral analysis of the particle tracks, Abu Rowin & Ghaemi (Reference Abu Rowin and & Ghaemi2019) and Ebrahimian, Sanders & Ghaemi (Reference Ebrahimian, Sanders and Ghaemi2019) showed that an error of 0.1, 0.2 and 0.1 pixel was present in particle displacements along the x, y and z directions, respectively. Combined, these two sources of uncertainty contribute to the total uncertainty in normalized mean velocity, Reynolds stresses and wall-normal location. The estimated uncertainty is shown as error bars in the figures demonstrated in § 3.
3. Results
3.1. Fluid rheology
The results of the shear viscosity measurements using the torsional rheometer are shown in figure 6(a). The demonstrated shear viscosities are the average of the thrice repeated measurements for each sample. Error bars are the range in the measurements at each  $\dot{\gamma }$. Within the presented values of
 $\dot{\gamma }$, the measurements of μ show good repeatability and low random error; the range in the measurements are less than 5.7 %. Based on figure 6(a), the measured μ of domestic tap water at 25 °C is 0.861 ± 0.049 mPa s. The results for water can be contrasted with shear viscosity measurements of Nagashima (Reference Nagashima1977) and Collings & Bajenov (Reference Collings and Bajenov1983). They measured the viscosity of distilled water at 25 °C; finding it to be 0.891 mPa s. The discrepancy between the results of figure 6(a) for water and the measurements of Nagashima (Reference Nagashima1977) and Collings & Bajenov (Reference Collings and Bajenov1983) is within the estimated uncertainty based on the three repeated measurements, and is attributed to systematic uncertainties inherent with the torsional rheometer.
Rheology of aqueous solutions of drag-reduced additives including (a) shear viscosity as a function of shear rate, and (b) mid-point filament diameter with respect to time from uniaxial filament extension.

From visual inspection of figure 6(a), it is apparent that the XG solution is shear thinning. The viscosity of the XG solution reduces by 80.4 % between  $\dot{\gamma }$ of 5 and 400 s−1. For
 $\dot{\gamma }\; \gt 400\;{\textrm{s}^{ - 1}}$, Taylor instabilities produce a sudden increase in μ and the results were discarded. The values of
 $\textrm{d}\langle U\rangle /\textrm{d}y{|_w}$ for the drag-reduced, turbulent flows being investigated are beyond 2000 s−1, much greater than the maximum achievable
 $\dot{\gamma }$ of 400 s−1 using this rheometer. Therefore, a predictive model is used to extrapolate the data and estimate μ w of the drag-reduced turbulent flows. For the XG solution, the Carreau–Yasuda (CY) model (Carreau Reference Carreau1972; Yasuda, Armstrong & Cohen Reference Yasuda, Armstrong and Cohen1981) fit the measurements appropriately and is shown by the solid line in figure 6(a). The CY model is represented by the following equation,
 \begin{equation}\frac{{\mu - {\mu _\infty }}}{{{\mu _0} - {\mu _\infty }}} = \frac{1}{{{{(1 + {{({\lambda _t}\dot{\gamma })}^a})}^{n/a}}}},\end{equation}
where μ 0 is the zero-shear-rate viscosity, μ ∞ is the infinite-shear-rate viscosity, λt is a fitting constant with a dimension of time, n is a dimensionless exponent and a is an additional fitting parameter introduced by Yasuda et al. (Reference Yasuda, Armstrong and Cohen1981). For XG, μ 0 is 0.019 Pa s, μ ∞ is 0.937 mPa s, λt is 0.517 s, n is 0.466 and a is 1.935. The uncertainty in the extrapolated shear viscosity for XG is taken to be the maximum range in the thrice-repeated measurements of μ. Using the above (3.1), the μ w of XG at HDR, which corresponds to the value of  $\dot{\gamma }$ that was equal to
 $\textrm{d}\langle U\rangle /\textrm{d}y{|_w}$, is 1.576 mPa s. Extrapolating the CY model may be subject to errors that can influence the variables derived for inner scaling, including τw ,2, uτ and λ (Singh et al. Reference Singh, Rudman, Blackburn, Chryss, Pullum and Graham2016). We will go on to demonstrate that the DR 2 derived using these rheology measurements is within 5 % of the DR 1 determined from measurements of the streamwise pressure gradient. Propagation of uncertainty accounts for additional errors in the inner-scaling variables that can be seen by error bars in plots of the mean velocity profile and Reynolds stresses.
Solutions of PAM also demonstrate shear-thinning qualities, but to a much lesser extent than XG. The viscosity of PAM at MDR reduced by 7.4 % between  $\dot{\gamma }$ of 10 and 180 s−1. The viscosity of PAM at HDR reduces by 6.1 % across the same range in
 $\dot{\gamma }$. Below
 $\dot{\gamma }$ of 10 s−1, measurements of μ were noisy and ambiguous. In either scenario, measurements of μ are approximately constant for
 $\dot{\gamma }\; \gt 180\;{\textrm{s}^{ - 1}}$, which is the maximum measurable
 $\dot{\gamma }$ of both PAM solutions (HDR and MDR) before Taylor instabilities impair the measurements. The Sisko (SI) model (Sisko Reference Sisko1958) was used to represent μ of the PAM solutions at moderate and large values of
 $\dot{\gamma }$. This model is typically used when measurements close to the zero-shear-rate viscosity are lacking (Barnes et al. Reference Barnes, Hutton and Walters1989). The fitted SI model is shown in figure 6(a) using a dashed line and is represented by the following equation,
 \begin{equation}\mu = {\mu _\infty } + K{\dot{\gamma }^{n - 1}},\end{equation}
where K and n are constants used to describe the power law decay in μ. The infinite-shear-rate viscosity, μ ∞, for PAM at HDR and MDR are estimated to be 1.072 and 1.087 mPa s, respectively. The fitting parameter n and K are 0.349 and 0.455 mPa sn for PAM at HDR and 0.101 and 0.985 mPa sn for PAM at MDR. Using the above (3.2), the μ w of PAM at HDR and MDR is 1.074 and 1.088 mPa s respectively, not much greater than the corresponding values of μ ∞.
There is a negligible difference in measured values of μ for the 150 ppm C14 solution at HDR and the 200 ppm C14 solution at MDR. Unlike PAM and XG, solutions of C14 exhibit a Newtonian trend with constant μ for  $10\;{\textrm{s}^{ - 1}} \lt \dot{\gamma }\; \lt 100\;{\textrm{s}^{ - 1}}$. Therefore, their viscosities were assumed constant for
 $\dot{\gamma }\; \gt 100\;{\textrm{s}^{ - 1}}$. The estimated μ w of C14 at HDR is 0.911 ± 0.036 mPa s and C14 at MDR is 0.912 ± 0.024 mPa s. No SISs are observed for C14; however, that does not rule out the possibility of their presence at higher values of
 $\dot{\gamma }$.
Using the CaBER system, it was not feasible to measure λE of XG and C14 solutions, since the filament immediately ruptured upon moving the endplates. Similar findings for rigid polymer and surfactant solutions have been reported by previous investigations (Lin Reference Lin2000; Escudier et al. Reference Escudier, Nickson and Poole2009; Mohammadtabar et al. Reference Mohammadtabar, Sanders and Ghaemi2020). The two PAM solutions were the only fluids that showed a measurable λE using the CaBER apparatus. Figure 6(b) demonstrates the filament diameter, D, as a function of time, t. Here t = 0 indicates the end of the top plate displacement. Similar to the shear viscosity measurements, the thrice-repeated measurements of D(t) were averaged for each sample and the error bars show the range of the measurements. The solid black line represents the exponential fit of D(t) = Ae−Bt − Ct + E. The resulting λE for PAM at HDR and PAM at MDR were 4.3 and 11.0 ms, respectively. For the purposes of our analysis, a comprehension that solutions of PAM have significantly larger extensional characteristics than those of XG and C14, will suffice.
Despite producing similar DR at HDR or MDR (see table 2), each drag-reducing solution exhibits a different shear viscosity and extensional characteristics. Of the additive solutions, XG has the largest overall μ and a strong shear-thinning behaviour. PAM has the next largest distribution in μ; however, only approximately 20 % larger than the average μ of water. C14, on the other hand, has a water-like distribution in μ. Although we were unable to measure λE for C14 and XG using the CaBER system, the fact that λE for PAM solutions could be measured implies that PAM has a larger λE than C14 and XG. Rodd et al. (Reference Rodd, Scott, Cooper-White and Mckinley2005) specified that the operable range of the CaBER is constrained to fluids with λE larger than approximately 1 ms when μ is smaller than 70 mPa s. Given the measured shear viscosities of XG and C14 are less than 70 mPa s, it is possible that their λE are less than 1 ms. However, further measurements of the extensional rheology are needed to confirm this hypothesis, one possible method being the dripping-onto-substrate technique detailed in Dinic, Jimenez & Sharma (Reference Dinic, Jimenez and Sharma2017). Such a method was capable of measuring the pinch-off dynamics of fluids with μ less than 20 mPa s and λ E less than 1 ms, according to Dinic et al. (Reference Dinic, Jimenez and Sharma2017). Nonetheless, a correlation relating DR to λE, similar to that proposed by Owolabi et al. (Reference Owolabi, Dennis and Poole2017) for flexible polymers, may not apply to solutions of XG or C14. The above analysis using conventional torsional and extensional rheometers highlights that the drag-reduced solutions demonstrate different rheological characteristics.
Other authors have demonstrated that flows obtained from DNS and using the FENE-P (finitely extensible non-linear elastic spring, with a Peterlin approximation) model with large Weissenberg number,  $Wi = {\lambda _E}\,\textrm{d}\langle U\rangle /\textrm{d}y{|_w}$, have an effective viscosity that increases with distance from the wall (Procaccia et al. Reference Procaccia, L'vov and Benzi2008). A viscosity that increases monotonically with distance from the wall is achieved inherently by shear-thinning fluids. We find it intriguing that DR exists for both XG with relatively small λE and large shear-thinning behaviour, and PAM with large λE and minimal shear-thinning characteristics. This could suggest that polymers achieve DR using a viscosity that increases monotonically with y. Flexible polymers achieve this viscosity gradient using polymer elasticity (i.e. Wi), while rigid polymers are naturally shear thinning. Such a hypothesis is only speculative. Measurements connecting the role of shear-thinning characteristics to DR are warranted.
3.2. Newtonian turbulent channel flow
The following section seeks to evaluate the 3D-PTV measurements for water by comparing them with DNS of Iwamoto, Suzuki & Kasagi (Reference Iwamoto, Suzuki and Kasagi2002) at Reτ = 300, Moser, Kim & Mansour (Reference Moser, Kim and Mansour1999) at Reτ = 395, and Lee & Moser (Reference Lee and Moser2015) at Reτ = 550. The previously listed DNS data, in that order, are compared with the experimental water data at Reτ = 307, 425 and 511, respectively, in figures 7 and 8. The comparison involves an evaluation of  ${\langle U\rangle ^ + }$ in figure 7 and the Reynolds stress distributions in figure 8. The error bars in figures 7 and 8 originate from a propagation of uncertainty stemming from errors in velocity and shear viscosity measurements. For clarity of the figures, the error bars are down sampled in figures 7 and 8.
Inner-normalized mean streamwise velocity from 3D-PTV measurement for water in comparison with DNS and the law of the wall. The three profiles are shifted upward along the vertical axis by 10. 3D-PTV measurements at Reτ = [307, 425, 511] are compared with DNS from Iwamoto et al. (Reference Iwamoto, Suzuki and Kasagi2002) with Reτ = 300; Moser et al. (Reference Moser, Kim and Mansour1999) with Reτ = 395; and Lee & Moser (Reference Lee and Moser2015) with Reτ = 550.

Reynolds stresses from 3D-PTV of water compared with DNS. (a)  ${\langle {u^2}\rangle ^ + }$, where each data set is shifted upward along the vertical axis by 5, (b)
 ${\langle {v^2}\rangle ^ + }$ where each data set is shifted by 1, (c)
 ${\langle {w^2}\rangle ^ + }$ where each data set is shifted by 1 and lastly (d)
 ${\langle uv\rangle ^ + }$where each data set is shifted by −1. The legends are similar to figure 7. The 3D-PTV results with Reτ = [307, 425, 511] are compared with DNS from Iwamoto et al. (Reference Iwamoto, Suzuki and Kasagi2002) with Reτ = 300; Moser et al. (Reference Moser, Kim and Mansour1999) with Reτ = 395; and Lee & Moser (Reference Lee and Moser2015) with Reτ = 550.

As demonstrated in figure 7, the 3D-PTV measurements of mean velocity at the three Reτ agree with the distributions established using DNS and the law of the wall. Rather remarkable is the spatial resolution at which these measurements can be attained. For the lowest velocity case of Reτ = 307, the spacing of data points along y+ is 0.4λ and the velocity measurements are obtained for y+ as low as 2 (~60 μm from the wall). The spatial resolution of the velocity measurements with respect to inner scaling decreases with increasing Reτ. For Reτ = 511, the spatial resolution is 0.7λ and a minimum y+ of 4 (~60 μm from the wall). The closest data point to the wall is limited by the size of the tracer particles and glare spots that formed due to a reflection of the laser sheet from imperfections on the surface (small scratches and particles stuck to the wall). As shown in figure 7, there is no observable noise in the velocity distributions obtained from 3D-PTV based on STB.
The 3D-PTV measurements of the Reynolds stress profiles are compared with those of DNS in figure 8. The results from 3D-PTV and DNS agree well with one another, although there are some minor deviations. The maximum discrepancy in the peak streamwise Reynolds stress,  ${\langle {u^2}\rangle ^ + }$, shown in figure 8(a), is approximately
 $0.4u_\tau ^2$. The maximum deviation in the y+ location of the peak in
 ${\langle {u^2}\rangle ^ + }$ is 2.6λ. The wall-normal Reynolds stress profile,
 ${\langle {v^2}\rangle ^ + }$, overlaps well with DNS for Reτ of 425 and 511, as shown in figure 8(b). The
 ${\langle {v^2}\rangle ^ + }$ profile for data with a Reτ of 307 has a constant deviation, relative to the DNS profile, approximately equal to
 $0.1u_\tau ^2$ for all y+. Generally, the spanwise Reynolds stress distributions,
 ${\langle {w^2}\rangle ^ + }$, for all 3D-PTV results, are in good agreement with DNS, as seen in figure 8(c). The 3D-PTV results and DNS also show good agreement in their Reynolds shear stress profiles,
 ${\langle uv\rangle ^ + }$, shown in figure 8(d). One minor exception might be that the 3D-PTV profile of
 ${\langle uv\rangle ^ + }$ at Reτ of 425 has a marginally larger peak by approximately
 $0.1u_\tau ^2$ with respect to the DNS profile.
The profiles of  ${\langle {v^2}\rangle ^ + }$ and
 ${\langle uv\rangle ^ + }$, shown in figure 8(b,d) both have visible low-amplitude noise. This is associated with the larger particle positioning error of 3D-PTV in the out-of-plane direction and the smaller flow motions in this direction (v component). The largest peak-to-peak noise oscillation in figure 8(b) is approximately
 $0.03u_\tau ^2$, occurring between y+ = 230 and 250 for the case of Reτ = 425. This peak-to-peak noise corresponds roughly to a pixel disparity of 0.1 pixel, given the digital resolution of 27.9 μm pixel−1 and the image acquisition rate of 2.9 kHz. Since 0.1 pixel is less than the assumed error of 0.2 pixel for v, the visible low-amplitude noise in figure 8(b,d) is within the assumed margin of uncertainty discussed in § 2.3, and is captured by the error bars.
3.3. Mean velocity profile
The mean velocity profiles normalized using outer scaling are compared for drag-reduced flows at HDR and MDR in figures 9(a) and 9(b), respectively. Here, h is the half-channel height. Error bars are excluded from this figure, as the estimated 3D-PTV uncertainty is equivalent to the line thickness used here. In these figures, the mean velocity profile for water at the same Ub as the drag-reduced flows is also presented. For water, this flow rate results in Reτ of 793, which is larger than Reτ of the drag-reduced flows. The magnitudes of mean velocity in the near-wall region for the drag-reduced solutions is smaller than mean velocity of water. Although not fully captured within the wall-normal extent of the 3D-PTV domain, farther away from the wall, mean velocity of the drag-reduced flows is expected to become larger than that of water to maintain a similar Ub.
Outer-normalized mean streamwise velocity profile for drag-reduced flows at (a) HDR and (b) MDR.

Based on the shape of velocity profiles in figure 9(a), we can also see that the wall-normal gradient of mean velocity at the wall,  $\textrm{d}\langle U\rangle /\textrm{d}y{|_w}$, for all three drag-reduced cases is smaller than
 $\textrm{d}\langle U\rangle /\textrm{d}y{|_w}$ of water. The profiles of C14 and PAM at HDR appear to approximately overlap in figure 9(a). The XG solution, on the other hand, starts with a lower
 $\textrm{d}\langle U\rangle /\textrm{d}y{|_w}$, and its
 $\langle U\rangle /{U_b}$ profile is smaller up until y/h of 0.42. The greater μ w of XG compensates for its smaller
 $\textrm{d}\langle U\rangle /\textrm{d}y{|_w}$, resulting in a similar wall shear stress as PAM and C14. Within the region of y/h < 0.4 shown in figure 9(b), mean velocity for the two MDR cases of PAM and C14 are significantly lower than water. The profiles also demonstrate that
 $\textrm{d}\langle U\rangle /\textrm{d}y{|_w}$ of PAM and C14 are smaller than
 $\textrm{d}\langle U\rangle /\textrm{d}y{|_w}$ of water. PAM at MDR has a marginally lower velocity for y/h < 0.5 when compared to C14.
Figure 9 confirms that a similar DR does not ensure overlap of the mean velocity profile for different drag-reducing additives when the profiles are normalized using outer scaling. This was observed clearly for the XG solution in figure 9(a). The results also show that the difference in the mean velocity profiles of different drag-reducing additives at a similar DR is not associated with the difference in their Re H. In both figures 9(a) and 9(b), the mean velocity profiles of PAM and C14 solutions are similar while their Re H is different (see table 2). The properties of the solutions suggest that their shear viscosity plays an important role in setting the outer-normalized mean velocity profiles. At a similar DR, drag-reduced solution with larger μ w have a lower  $\textrm{d}\langle U\rangle /\textrm{d}y{|_w}$ and
 $\langle U\rangle /{U_b}$ in the near-wall region. While solutions with a similar μ w result in a similar
 $\textrm{d}\langle U\rangle /\textrm{d}y{|_w}$ and
 $\langle U\rangle /{U_b}$ in the near-wall region.
The inner-normalized mean velocity profile,  ${\langle U\rangle ^ + }$, in the immediate wall vicinity at y+ < 15 is demonstrated for all additives and for water in figure 10. The inner scales of the turbulent flows are estimated here by calculating
 $\textrm{d}\langle U\rangle /\textrm{d}y{|_w}$ using a linear fit of the data at 2–4 < y+ < 5. The lower wall-normal limit corresponds to the first valid data point from the 3D-PTV system which is determined to be at y ≈ 60 μm. For consistency, we chose the upper bound to be the maximum limit of the linear viscous sublayer for a Newtonian flow. Figure 10 shows the linear fit used to calculate
 $\textrm{d}\langle U\rangle /\textrm{d}y{|_w}$, and confirms the presence of a linear region for all the flows. The estimated
 $\textrm{d}\langle U\rangle /\textrm{d}y{|_w}$ values are presented in table 3 and are used to calculate the corresponding μ w based on the shear viscosity models described in § 3.1. This results in μ w and the other inner-scaling variables for the drag-reduced flows that are presented in the table 3. The comparison of the estimated DR 2 (based on
 $\textrm{d}\langle U\rangle /\textrm{d}y{|_w}$) in table 3 with the DR 1 (based on ΔP) in table 2 shows a reasonable agreement of the two methods. The difference between DR 1 and DR 2 is small and varies between 1.6 % to 4.8 %. The discrepancy is associated with several factors including the finite aspect ratio of the channel, deviation from the fully developed turbulence at the upstream pressure port, and the uncertainty in determining
 $\textrm{d}\langle U\rangle /\textrm{d}y{|_w}$.
Mean streamwise velocity profile in the immediate near-wall region for (a) PAM at HDR, (b) XG at HDR, (c) C14 at HDR, (d) PAM at MDR, (e) C14 at MDR and (f) water.

The estimated inner scaling based on the wall-normal gradient of mean velocity at the wall for the drag-reduced flows.

The relatively good agreement amongst the wall statistics and DR using measurements of ΔP and 3D-PTV for XG, suggests the extrapolation of the CY model from § 3.1 can reasonably estimate μ w. A further means of communicating the agreement of these measurements is by determining μ w using  $\textrm{d}\langle U\rangle /\textrm{d}y{|_w}$ and τw ,1. Here,
 $\textrm{d}\langle U\rangle /\textrm{d}y{|_w}$ is obtained from 3D-PTV measurements, and τw ,1 is derived from measurements of ΔP. Such a validation has been done in experiments by Warholic et al. (Reference Warholic, Schmidt and Hanratty1999b) and Ptasinski et al. (Reference Ptasinski, Nieuwstadt and Hulsen2001). If we perform the same analysis, the viscosity of the XG solution at a shear rate of 2364 s−1 (
 $\textrm{d}\langle U\rangle /\textrm{d}y{|_w}$ from table 3) is 1.44 mPa s (using τw ,1 in table 1). This viscosity is approximately 0.14 mPa s lower than the μ w listed in table 3, which is roughly 8 %. The majority of this uncertainty is reflected in the error bars that propagate from a random error in repeated viscosity measurements and are shown in figures of mean velocity profile and Reynolds stresses to follow.
As alluded to earlier in § 2.3, the method of multiplying  $\textrm{d}\langle U\rangle /\textrm{d}y{|_w}$ and μ w to establish τw ,2 for the non-Newtonian fluids is an approximation. Fluctuations in
 $\textrm{d}\langle U\rangle /\textrm{d}y{|_w}$ with respect to time can be significant and the instantaneous distribution of μ w may not be simply determined by the mean shear rate. This is most significant for the XG solution, whose shear viscosity is described by the CY model. Gubian et al. (Reference Gubian, Stoker, Medvescek, Mydlarski and Baliga2019) demonstrated that τw can fluctuate by as much as 35 % of the nominal value of τw for a Newtonian turbulent channel flow with a Reτ of approximately 300. Assuming such a variance in τw is applicable to XG, an uncertainty in μ w of approximately 0.06 mPa s is expected. Such a fluctuation in μ w is captured by the error bars in the mean flow statistics demonstrated in the figures to follow.
In addition to demonstrating the fit of the linear viscous sublayer, figure 10 presents some insight into the thickness of the viscous sublayer for drag-reduced flows. The elastic sublayer model of Virk (Reference Virk1971) proposed that all drag-reduced flows have a viscous sublayer thickness of y+ = 11.6 (corresponding to the tri-section point of the MDR asymptote,  ${y^ + } = {\langle U\rangle ^ + }$, and the log law). However, figure 10 demonstrates that none of the drag-reduced flows, have a viscous sublayer thickness of y+ = 11.6 (represented by the maximum extent of the black line). However, there is still a considerable thickening of the linear viscous subregion relative to water for the drag-reduced flows. At y+ = 11.6, HDR flows of XG, C14 and PAM solutions deviate from the linear fit by 1.98uτ, 1.44uτ and 1.12uτ, respectively. The largest deviation corresponds to the XG solution, which has the largest shear viscosity. Water has a deviation from the linear fit at y+ = 11.6 of 1.97uτ, which is equivalent to the deviation of XG. For MDR flows of C14 and PAM, the relative deviation from the linear profile at y+ = 11.6 is smaller and equal to 0.6uτ and 1.0uτ, respectively.
The results in figure 10 show that the thickness of the viscous sublayer is smaller for drag-reduced flows at HDR than MDR, suggesting that viscous sublayer thickens with increasing DR. We also see that the thickness of the viscous sublayer depends on the additive type, i.e. the thickness varies for different solutions at a similar DR. The results also suggest that in general the thickness of the viscous sublayer in inner scaling reduces with increasing shear viscosity. The XG solution has the highest shear viscosity and has an almost identical viscous sublayer thickness as water, while other HDR flows with lower shear viscosity have a thicker viscous sublayer.
The velocity profiles normalized by inner scaling and presented in a log–linear format are shown in figure 11. The inner-normalized mean velocity profiles are compared with both the Newtonian law of the wall and the ultimate profile for drag-reduced flows at MDR,  ${\langle U\rangle ^ + } = 11.7\,\textrm{ln}\,{y^ + } - 17$ (Virk et al. Reference Virk, Mickley and Smith1970). The results for flows at HDR in figure 11(a) are discussed first, followed by the results for MDR in figure 11(b).
Inner-normalized mean streamwise velocity profile of drag-reduced flows at (a) HDR and (b) MDR.

The mean velocity profiles of the HDR flows in figure 11(a) are close to each other in the near-wall region. We also observe that with increasing y+, the HDR profiles of the three drag-reduced cases start to diverge and appear to have different slopes. Subject to the Virk (Reference Virk1971) elastic sublayer model for polymer flows at an intermediate DR, the  ${\langle U\rangle ^ + }$ profile in the elastic sublayer (or buffer layer) is supposed to overlap with the ultimate profile, and for larger y+ a Newtonian plug layer with a logarithmic profile with a similar slope as the Newtonian log layer should propagate. As shown in figure 11(a), none of the HDR profiles overlap with the ultimate asymptote. Our observations for HDR flows show that in the HDR regime, DR does not uniquely define the inner-normalized mean velocity profile since the type of additive plays a role in shaping the profile. In comparing the mean velocity profiles of different experiments, White et al. (Reference White, Dubief and Klewicki2012) similarly observed variability in the outer layer of the mean velocity profile for polymer solutions with the same DR; albeit for cases of low DR, smaller than 40 %. Due to the differences amongst the data sets, White et al. (Reference White, Dubief and Klewicki2012) postulated that the velocity distribution in the outer layer depends on Re, properties of the additive, and the canonical flow type. It is important to note that the results in figure 11(a) do not exclude the effect of Re. In other words, the variations can be partly attributed to differences in the Re of the drag-reduced flows.
The mean velocity profile of the two drag-reduced flows at MDR are shown in figure 11(b). The profile of C14 has a higher  ${\langle U\rangle ^ + }$ than PAM outside the viscous sublayer, which is consistent with its slightly higher DR 2; 76.5 % for C14 versus 73.3 % for PAM solution. The C14 profile is also marginally greater than the MDR asymptote for y+ > 60. Both previous experimental and numerical simulations have observed a small overshoot of the MDR asymptote for velocity profiles of polymer solutions (Escudier et al. Reference Escudier, Nickson and Poole2009; White et al. Reference White, Dubief and Klewicki2012; Graham Reference Graham2014). Both profiles do not adhere to the MDR asymptote of Virk et al. (Reference Virk, Mickley and Smith1970) and intersect with it at different y+. In addition, the profile of C14 does not agree with the asymptote for drag-reducing surfactant solutions proposed by Zakin et al. (Reference Zakin, Myska and Chara1996);
 ${\langle U\rangle ^ + } = 23.4\,\textrm{ln}\,{y^ + } - 65$. This asymptote is not show in figure 11 for brevity. Considering the error bars and the slight difference in DR of C14 and PAM, the MDR asymptote seems to be unique and independent of the additive type and Re number. However, the drag-reduced flows of PAM and C14 at MDR do not follow the logarithmic trend proposed by Virk et al. (Reference Virk, Mickley and Smith1970); they share a similar S-shaped profile that straddles or at least intersects the asymptote of Virk et al. (Reference Virk, Mickley and Smith1970). To further evaluate the logarithmic behaviour, the indicator function,
 $\zeta = {y^ + }\,\textrm{d}{\langle U\rangle ^ + }/\textrm{d}{y^ + }$, is investigated next in figure 12. Using the indicator function to evaluate logarithmic dependency, White et al. (Reference White, Dubief and Klewicki2012) found that the inner-normalized mean velocity of polymer drag-reduced flows at MDR were not truly logarithmic functions of y+.
The indicator function for drag-reduced flows at (a) HDR and (b) MDR.

To establish  $\textrm{d}{\langle U\rangle ^ + }/\textrm{d}{y^ + }$, and calculate ζ, a moving second-order polynomial filter, of length 10–15λ (250 μm), was applied to the distribution of
 ${\langle U\rangle ^ + }$ as a function of y+. The polynomials were then differentiated analytically. Figures 12(a) and 12(b) demonstrates ζ as a function of y+ for HDR and MDR flows, respectively. A region of y+ where ζ is constant is indicative of a layer where
 ${\langle U\rangle ^ + }$ varies logarithmically as a function of y+. For example, the distribution of ζ for water, shown in both figures 12(a) and 12(b), is approximately constant and equal to 2.5 for y+ > 30, which is indicative of a logarithmic layer for the Newtonian turbulent channel flows. White et al. (Reference White, Dubief and Klewicki2012), Elbing et al. (Reference Elbing, Perlin, Dowling and Ceccio2013) and White et al. (Reference White, Dubief and Klewicki2018) proposed that for a polymer drag-reduced flow, the shape of the mean velocity profile, and similarly ζ, depends on Re, polymeric properties and the canonical flow type. Figure 12(a,b) addresses the second postulate by comparing flows comprised of different additives at HDR and MDR.
Figure 12(a) shows that the HDR flows of C14 and PAM have similar distributions of ζ. White et al. (Reference White, Dubief and Klewicki2012) stated that HDR flows are distinct in their lack of a Newtonian plug. By observation of figure 12(a) none of the HDR flows have a y+ range where ζ appears constant and a Newtonian plug does not exist within the measurement domain. However, this does not rule out the possibility of a Newtonian plug existing at larger y+. The profile of ζ for XG show relative similarity with the other HDR flows for y+ < 30; however, the peak in its profile, though subject to experimental noise, appears to be marginally higher and located at larger y+. The larger y + location of ζ peak for XG solution indicates that the centre of the elastic sublayer (buffer layer) is farther away for the wall. Therefore, the indicator function also provides further evidence that the shape of the velocity profile and the thickness of the sublayers is not uniquely defined by DR. Here, the thicker elastic sublayer of the XG solution is associated with its larger shear viscosity and lower Re number. The y + location of the peak in the distribution of ζ, shows that the elastic sublayer is thinner for drag-reduced solution with higher Re number (ReH or Reτ).
Figure 12(b) compares the plots of ζ for C14 and PAM at MDR. The two profiles appear similar for all y+. The y+ location and value in the peak of ζ is approximately (y+, ζ) = (70, 14) for both drag-reduced flows. The peak is larger and farther away from the wall relative to the HDR cases, indicating a thicker elastic sublayer. Due to the lack of a region with constant ζ, White et al. (Reference White, Dubief and Klewicki2012) concluded that the exact shape of the MDR profile was not logarithmic. Instead, MDR was achieved when the peak in ζ equals 11.7, corresponding to the slope in the MDR asymptote proposed by Virk et al. (Reference Virk, Mickley and Smith1970). Figure 12(b) demonstrates that the peak exceeds this limit for both PAM and C14 solutions. In plotting ζ for experimental data from Escudier et al. (Reference Escudier, Nickson and Poole2009) collected for a rigid polymer solution at MDR with DR of 67 %, White et al. (Reference White, Dubief and Klewicki2012) demonstrated a similar overshoot of ζ = 11.7. Elbing et al. (Reference Elbing, Perlin, Dowling and Ceccio2013) also shows a peak in ζ greater than 11.7 for a flexible polymer solution with DR = 65 %. Therefore, further doubt is cast on the exactness of the slope of the MDR profile of Virk et al. (Reference Virk, Mickley and Smith1970). Figure 12(b) also appends the conclusion of White et al. (Reference White, Dubief and Klewicki2012) to state that surfactant drag-reduced flows at MDR, in addition to polymer flows, also do not possess a logarithmic layer. Furthermore, while the shape of the two mean velocity profiles at MDR are not exactly logarithmic, they are similar. This implies that a universal distribution of  ${\langle U\rangle ^ + }$, and ζ, for drag-reduced flows at MDR, that is irrespective of the additive type and Re number, may exist.
3.4. Reynolds stresses
The Reynolds stresses profiles for the HDR cases are compared in figure 13. In addition to the drag-reduced flows, the Reynolds stress profiles for water at four Reτ that are similar to Reτ of the drag-reduced cases are presented. For example, the Reynolds stress profiles of C14, PAM and XG, with Reτ of 503, 424 and 287, are shown alongside those for water with a Reτ of 511, 425 and 307. As expected, all of the Reynolds stress profiles of water show similar distributions, relative to one another, within the linear sublayer and buffer layer. Larger differences in the outer layer, amplify with increasing y+ as expected.
Inner-normalized mean Reynolds stress profiles of drag-reduced flows at HDR showing (a) streamwise Reynolds stress, (b) wall-normal Reynolds stress, (c) spanwise Reynolds stress profiles and (d) Reynolds shear stress.

Figure 13(a) shows that all HDR flows possess a large peak value of  ${\langle {u^2}\rangle ^ + }$ that is also shifted away from the wall, relative to water at a similar Reτ. The
 ${\langle {u^2}\rangle ^ + }$ profiles of C14 and PAM appear similar for y + < 70 although the
 ${\langle {u^2}\rangle ^ + }$ peak is smaller for PAM. The two profiles deviate with further increase of y +. Compared to C14 and PAM, XG has a smaller peak value of
 ${\langle {u^2}\rangle ^ + }$, which is displaced farther from the wall. Therefore,
 ${\langle {u^2}\rangle ^ + }$ peak is smaller and farther away from the wall for solutions with higher shear viscosity. In addition, the notion that drag-reduced flows of different additives at the same DR have a similar
 ${\langle {u^2}\rangle ^ + }$ peak appears to be invalid. The shift in the peak of
 ${\langle {u^2}\rangle ^ + }$ away from the wall is an indication of a thicker buffer layer that is consistent with our previous observations.
Figure 13(b,c) demonstrates significant attenuation in the profile of  ${\langle {v^2}\rangle ^ + }$ and
 ${\langle {w^2}\rangle ^ + }$ of the drag-reduced flows relative to water. For
 ${\langle {v^2}\rangle ^ + }$, this agrees with the observations of Escudier et al. (Reference Escudier, Nickson and Poole2009) for polymers and also Warholic et al. (Reference Warholic, Schmidt and Hanratty1999b) for surfactants. Attenuation in the profile of
 ${\langle {w^2}\rangle ^ + }$ has been shown by White et al. (Reference White, Somandepalli and Mungal2004) for polymers. To the authors’ knowledge,
 ${\langle {w^2}\rangle ^ + }$ has never been demonstrated for surfactant drag-reduced flows. Similar to their
 ${\langle {u^2}\rangle ^ + }$ profiles, C14 and PAM display rather similar profiles for
 ${\langle {v^2}\rangle ^ + }$ and
 ${\langle {w^2}\rangle ^ + }$ with subtle discrepancies. The
 ${\langle {v^2}\rangle ^ + }$ and
 ${\langle {w^2}\rangle ^ + }$ profiles for XG, on the other hand, are noticeably more attenuated than the other HDR flows. The peak value in the
 ${\langle {v^2}\rangle ^ + }$ and
 ${\langle {w^2}\rangle ^ + }$ distributions of XG are approximately 50 % those of C14. Figure 13(d) demonstrates similar profiles in
 ${\langle uv\rangle ^ + }$ for C14 and PAM, but again a more attenuated distribution for XG. The larger attenuation in
 ${\langle uv\rangle ^ + }$ is likely attributed to a larger imposition of viscous stresses due to the larger overall shear viscosity of the XG solution. Therefore, different drag-reduced solutions at an identical DR do not exhibit identical distribution of Reynolds shear stresses, in particular when their shear viscosity is different. A lack of consistency in the shear viscosity of the drag-reduced solutions is also reflected by differences in the Re number of the solutions with similar DR (i.e. similar uτ). Therefore, the discrepancy in the Reynolds stress distributions of the HDR flows can be similarly explained by differences in the Re of the drag-reduced solutions.
Figure 14 demonstrates the Reynolds stresses of C14 and PAM at MDR. Having observed that the Reynolds stresses of XG were much lower than the other HDR flows in figure 13, it was perceived to be prudent to include XG at HDR in the comparison with the MDR flows in figure 14. This was based on prior knowledge that the Reynolds stresses are more attenuated for flows with larger DR (Warholic et al. Reference Warholic, Massah and Hanratty1999a; Ptasinski et al. Reference Ptasinski, Nieuwstadt and Hulsen2001; Escudier et al. Reference Escudier, Nickson and Poole2009). Similar to figure 13, figure 14 presents the Reynolds stresses of the drag-reduced flows alongside the distributions of water that share a similar Reτ. C14 and PAM at MDR, alongside XG at HDR, with Reτ of 363, 324 and 307, are presented together with the distributions of water with Reτ of 363 and 307.
Inner-normalized mean Reynolds stress profiles of drag-reduced flows at MDR and XG at HDR; (a) streamwise Reynolds stress, (b) wall-normal Reynolds stress, (c) spanwise Reynolds stress profiles and (d) Reynolds shear stress.

In figure 14(a), there is relatively good overlap in the distributions of  ${\langle {u^2}\rangle ^ + }$ for the three solutions. Here the similarity in the XG profile with the other two profiles is striking, despite 18–21 % difference in DR 2 of XG at HDR and the other two MDR flows. For polymer flows, Escudier et al. (Reference Escudier, Nickson and Poole2009) demonstrated that for DR > 40 %,
 ${\langle {u^2}\rangle ^ + }$ decreases as a function of DR; albeit, results appeared mixed for other authors (Warholic et al. Reference Warholic, Massah and Hanratty1999a). In the current investigation, the
 ${\langle {u^2}\rangle ^ + }$ peak of C14 and PAM at MDR decreased relative to their corresponding HDR cases. However, the peaks did not decrease to a point where they are lower than the peak measured for water. While Li et al. (Reference Li, Kawaguchi, Segawa and Hishida2005) and Warholic et al. (Reference Warholic, Schmidt and Hanratty1999b) demonstrate a lower peak in
 ${\langle {u^2}\rangle ^ + }$ for surfactant drag-reduced flows with large DR they have similarly shown that the peak in
 ${\langle {u^2}\rangle ^ + }$ largely depends on the Reτ of the flow. Warholic et al. (Reference Warholic, Schmidt and Hanratty1999b) demonstrated this in their sweep of Re for different HDR flows, where the peak in
 ${\langle {u^2}\rangle ^ + }$ was larger than water for surfactant drag-reduced flows with large Re, but smaller than water for low Re. Thais, Gatski & Mompean (Reference Thais, Gatski and Mompean2012) showed the peak in
 ${\langle {u^2}\rangle ^ + }$ had a similar dependence on Re based on DNS using the FENE-P model. Figure 14(b,c) demonstrates that the distributions of
 ${\langle {v^2}\rangle ^ + }$ and
 ${\langle {w^2}\rangle ^ + }$ for C14 and PAM at MDR, and XG at HDR, have nearly identical profiles that are also significantly suppressed relative to water. Li et al. (Reference Li, Kawaguchi, Segawa and Hishida2005) and Warholic et al. (Reference Warholic, Schmidt and Hanratty1999b) also observed significant attenuation in profiles of
 ${\langle {v^2}\rangle ^ + }$ for surfactant drag-reduced flows near MDR. The overlap in
 ${\langle {u^2}\rangle ^ + }$,
 ${\langle {v^2}\rangle ^ + }$ and
 ${\langle {w^2}\rangle ^ + }$ implies that the mean turbulent kinetic energy is the same for the three drag-reduced flows.
Lastly, figure 14(d) demonstrates that  ${\langle uv\rangle ^ + }$ profiles of C14 and XG are slightly larger than the
 ${\langle uv\rangle ^ + }$ profile of PAM at y + < 100. However, for all three flows, the
 ${\langle uv\rangle ^ + }$ magnitudes are small and have the same order of magnitude as the error bars. Therefore, the values should be considered negligible and differences are not tangible. Several authors have shown both finite and also negligible
 ${\langle uv\rangle ^ + }$ profiles for polymer drag-reduced flows near MDR (Warholic et al. Reference Warholic, Massah and Hanratty1999a; Ptasinski et al. Reference Ptasinski, Boersma, Nieuwstadt, Hulsen, van den Brule and Hunt2003; Escudier et al. Reference Escudier, Nickson and Poole2009). Similarly, Tamano et al. (Reference Tamano, Uchikawa, Ito and Morinishi2018) presented a finite
 ${\langle uv\rangle ^ + }$ distribution, while Warholic et al. (Reference Warholic, Schmidt and Hanratty1999b) demonstrated a
 ${\langle uv\rangle ^ + }$ profile approximately equal to zero for flows of surfactant drag-reducing additives at MDR. The discrepancies in the small residual values of
 ${\langle uv\rangle ^ + }$ is potentially associated with measurement uncertainties as they are also present in the current measurements.
Considering PAM and C14 at MDR, the measurements presented in figure 14 show that Reynolds stress profiles of drag-reduced flows at MDR overlap. We observed a perfect overlap for all components except Reynolds shear stress. For the latter component, there are subtle differences with the same magnitude as the measurement uncertainties. Therefore, we can conclude that at MDR, the Reynolds stress profiles are not a function of additive type and Reynolds number. At MDR, the Reynolds stress profiles converge to a common set of distributions for polymer and surfactant drag-reduced flows with different Re.
The Cf values presented based on ΔP in figure 4, and mean velocity profiles of figure 11(a), suggest that XG is not at MDR. In contrast, the results of figure 14 demonstrate that Reynolds stress profiles of XG are similar to those of PAM and C14 at MDR. The measurements of DR 1 (based on ΔP) for XG in figure 3(c) also show that a higher level of DR was not achievable for XG with increasing its concentration; DR 1 plateaus to a constant 58.5 % for c in excess of 300 ppm. Why XG has a lower asymptotic DR 1, relative to C14 and PAM at MDR, is likely attributed to the imposition of larger viscous stresses. To summarize, it is evident that the DR 1 of XG has attained an asymptotic state, according to figure 3(c). The Reynolds stresses also demonstrate that XG shares dynamical similarities with other MDR flows (see figure 14). Therefore, with respect to the turbulent flow and production of turbulent kinetic energy, XG is at an MDR state. The discrepancies in DR and mean velocity profile of XG with respect to the MDR state of the other drag-reduced flows is associated with larger inherent viscous stresses of this polymer solution.
3.5. Low- and high-speed streaks
The following analysis evaluates the length scale of the dominant flow structures at HDR and MDR using two-point correlation of streamwise velocity fluctuations. The spatial, two-point correlation is computed as
 \begin{equation}{R_{uu}}(\Delta z) = \frac{{\langle \; {u_{({x_0},{y_0},{z_0})}}\; {u_{({x_0},{y_0},{z_0} + \Delta z)}}\; \rangle }}{{\sqrt {\langle \; u_{({x_0},{y_0},{z_0})}^2\rangle } \; \sqrt {\langle \; u_{({x_0},{y_0},{z_0} + \Delta z)}^2\rangle } }}.\end{equation}
Here, (x 0, y 0, z 0) is the coordinate of the reference point selected at (0, 0.4 h, 0), which is positioned within the logarithmic layer for Newtonian flows. The dominant coherent structures at this location are low and high-speed streaks that have also been observed in drag-reduced flows (White et al. Reference White, Somandepalli and Mungal2004; Mohammadtabar et al. Reference Mohammadtabar, Sanders and Ghaemi2017). At higher Re and in Newtonian flows, these streaks form the very large-scale motions (Hutchins & Marusic Reference Hutchins and Marusic2007). The incremental displacement along the spanwise direction is indicated as Δz, relative to the z 0 reference point. As a result, Ruu characterizes the spanwise scale of the low and high-speed streaks in the drag-reduced flows.
Figure 15(a) presents Ruu along Δz/h for the HDR flows. The Ruu functions for water are shown alongside the drag-reduced flows. The overlap in the Ruu profiles indicate that the width of the streaks for the Newtonian cases are similar. The Ruu profiles for C14 and PAM at HDR are also approximately similar, indicating a similar streak spacing. This suggests that the Ruu distribution for drag-reduced flow may not be a strong function of Re as PAM and C14 flows have different Re. The XG demonstrates a rather larger Ruu relative to C14 and PAM, which indicates even wider streaks. Therefore, the turbulent streaks of drag-reduced flows of PAM and C14 with similar shear viscosities appear to be more alike, while XG – a solution with a much larger overall shear viscosity – is distinct.
Two-point correlation of streamwise velocity fluctuations in the spanwise direction for drag-reduced flows at (a) HDR and (b) MDR. The reference location for the two-point correlations is at (x 0, y 0, z 0) = (0, 0.4 h, 0).

Figure 15(b) presents Ruu of drag-reduced flows of PAM and C14 at MDR, and XG at HDR. The profiles approximately overlap, and therefore streak spacing is expected to be similar for the three drag-reduced flows. Using a similar two-point correlation analysis, Li, Sureshkumar & Khomami (Reference Li, Sureshkumar and Khomami2006), White et al. (Reference White, Somandepalli and Mungal2004) and Tamano et al. (Reference Tamano, Uchikawa, Ito and Morinishi2018) demonstrated a monotonic increase in the spanwise width of the low- and high-speed streaks for polymer and surfactant drag-reduced flows with increasing DR. Comparing figure 15(a), with figure 15(b), both C14 and PAM exhibit growth in the average streak spacing with respect to DR. The XG profile appears to show more similarities in the width of its streaks with respect to solutions of C14 and PAM at MDR. This reinforces the notion that XG has attained a state of MDR regarding turbulent dynamics.
4. Discussion and conclusion
We investigated three drag-reducing additives with different molecular structures: a flexible polymer, a rigid polymer and a surfactant. The chosen flexible polymer was PAM, the rigid polymer was XG and the surfactant was a cationic compound referred to as C14. The main objective of this investigation was to compare the rheological features and turbulence statistics of these three drag-reducing additives in a turbulent channel flow. To ensure that the comparison of the additives is subject to similar conditions, the drag-reducing solutions were prepared such that they all produced a similar level of drag reduction (DR) at a common mass flow rate. This is equivalent to maintaining a similar wall shear stress and mass flow rate. Two DR values were considered; the first being a HDR case with DR of 57.7 % ± 1.2 %, and the second being a MDR case with DR of 70.3 % ± 1.8 %. Based on measurements of the streamwise pressure gradient along the channel, solutions of PAM, XG and C14 achieved the HDR condition, while only PAM and C14 could attain the larger MDR limit. Although the mass flow rate and DR were constant, the flows had different Reynolds numbers (Re) due to the difference in their shear viscosity.
Samples of each drag-reduced flow at HDR and MDR were collected for shear viscosity measurements in a torsional rheometer and measurements of their extensional relaxation time using a CaBER. Despite having the capability of generating similar levels of DR, none of the different types of additive solutions exhibited overlap in their apparent shear viscosity curves or similarities in their extensional relaxation times. Solutions of C14 exhibited low, and relatively constant shear viscosities that were almost identical to the shear viscosity of water. PAM solutions demonstrated only marginal shear-thinning trends. The overall shear viscosity of PAM was approximately 20 % larger than the shear viscosity of water. In contrast, the shear viscosity of the XG solution at low strain rates, was an order of magnitude larger than the other solutions, and had a pronounced shear-thinning trend. Regarding the extensional relaxation time, CaBER measurements could only be performed for solutions of PAM. Solutions of XG and C14 failed to show considerable uniaxial filament stretching, considering the samples disintegrated immediately upon a marginal imposition of strain from the CaBER system. Therefore, only solutions of PAM demonstrated measurable extensibility characteristics using CaBER, with a relaxation time of 4 to 11 ms. Although the current measurements, alongside previous experimental measurements from the literature, have not identified a common rheological trait for different drag-reducing additives, we still cannot rule out the possibility of such a common feature existing. However, our results pose the question of how different drag-reducing solutions manipulate the wall turbulence. We addressed this question using detailed measurements of the turbulence statistics.
The turbulent channel flow of the drag-reduced additives and several Newtonian flows were characterized using 3D-PTV. The drag-reduced solutions of PAM, XG and C14 at the HDR state demonstrated different mean velocity profiles when normalized using outer and inner scaling. The indicator function showed inconsistencies in the inner-normalized mean velocity distributions were a result of variations in the wall-normal thickness of the constituent sublayers of the three drag-reduced solutions. Drag-reduced solutions with a larger overall shear viscosity, and therefore a smaller Re, had a thinner linear viscous sublayer and a thicker elastic sublayer. At HDR, the Reynolds stress profiles of the PAM, XG and C14 solutions did not overlap. In particular, the XG solution, which had the highest shear viscosity, had more attenuated Reynolds stresses. Two-point correlation of streamwise velocity also demonstrated larger spanwise streak spacing for the XG solution relative to the other HDR flows. However, similar to previous observations, the drag-reduced additives resulted in the same qualitative net effect: that is, relative to a Newtonian turbulent wall flow, the buffer layer of all drag-reduced flows were thicker, the streamwise Reynolds stress profile was significantly larger and the other Reynolds stress components were much smaller. The observations demonstrated that turbulent flows of different drag-reducing additives generated mean velocity and Reynolds stress profiles that were qualitatively similar, but quantitatively different. The discrepancy in the magnitude of flow statistics appeared to be mainly due to the difference in the flow Re.
In contrast to the HDR flows, the outer and inner-normalized mean velocity profiles of PAM and C14 at MDR approximately overlapped. The small deviation between the two profiles was associated with the marginal differences in their DR. The indicator function showed that the wall-normal spacing of the sublayer's were similar for the two flows at MDR. Plots of the indicator function also demonstrated that a region where mean streamwise velocity varied logarithmically with distance from the wall, does not exist. That being said, the mean velocity profile at MDR was still asymptotic and independent of the type of additive and Re, despite not being precisely logarithmic in its distribution. The Reynolds stress profiles and two-point correlation of streamwise velocity fluctuations were also independent of additive type and Re as they converged to a common profile for PAM and C14 at MDR.
Although XG had a much lower DR, its Reynolds stress profile overlapped with the Reynolds stress distributions of PAM and C14 at MDR. The overlap in the Reynolds stresses indicated that the XG solution achieved a maximum level of attenuation in its turbulence, similar to PAM and C14 at MDR. In contrast, the DR and mean velocity profile of the XG solution at HDR was not consistent with those of PAM and C14 at MDR. The discrepancy was associated with the greater shear viscosity and therefore, lower Re of the XG solution. The large shear viscosity and lower Re of XG appeared to have hindered the solutions' ability to produce a larger DR, and have its mean velocity profile intersect with the MDR asymptote. This observation refines the previous conclusions. It hints that the dependence of mean velocity profile and Reynold stresses on the additive type and Re was attributed to differences in the shear viscosity and Re, and not a rheological feature typically associated with drag reduction, such as the extensibility of the solution.
Our experimental investigation demonstrated that different additives generate drag-reduced flows with similar turbulent statistics. Despite the fact that the drag-reduced flows had similar turbulent statistics, our rheology measurements – along with the rheology measurements of previous investigations – could not identify a common rheological feature that can be associated with drag reduction. The fluid extensibility, that has been shown to correlate with drag reduction for flexible polymers, does not seem to be pertinent for drag-reducing solutions of rigid polymers and surfactants. Also, the unique shear-induced structures that are associated with drag-reducing solutions of surfactants are not present in the steady shear viscosity measurements of drag-reducing polymers solutions. This ambiguity in our understanding can be explained two fold. First, that drag-reducing additives have a common rheological property that has yet to be identified from rheological measurements. This implies that the different additives reduce the turbulent drag via a common mechanism. Second, that the rheological feature responsible for drag reduction is different amongst the additives. This suggests that wall-turbulence responds similarly to the different drag-reduction mechanisms induced by fluids of different rheology. The latter hypothesis is more plausible since drag-reduced flows typically result in a similar turbulent state, in which streamwise Reynolds stress is large and other Reynolds stress components diminish. The results also raise the question of whether elasto-inertial turbulence, shown for flexible polymers (Dubief, Terrapon & Soria Reference Dubief, Terrapon and Soria2013), is present in drag-reduced flows of rigid polymers or surfactants. Answering this question requires an extensive analysis of solution rheology and flow structures at low Re.
Acknowledgments
The authors acknowledge the support of the Natural Sciences and Engineering Research Council of Canada (grant number: CRDPJ 531190-2018). We would also like to recognize Dr B. Owolabi for his contributions to the extensional viscosity measurements.
Declaration of interest
The authors report no conflict of interest.



