





%20--%3e%3c!DOCTYPE%20svg%20PUBLIC%20'-//W3C//DTD%20SVG%201.0//EN'%20'http://www.w3.org/TR/2001/REC-SVG-20010904/DTD/svg10.dtd'%3e%3csvg%20version='1.0'%20id='Layer_1'%20xmlns='http://www.w3.org/2000/svg'%20xmlns:xlink='http://www.w3.org/1999/xlink'%20x='0px'%20y='0px'%20width='64px'%20height='64px'%20viewBox='5.5%20-3.5%2064%2064'%20enable-background='new%205.5%20-3.5%2064%2064'%20xml:space='preserve'%3e%3cg%3e%3ccircle%20fill='%23FFFFFF'%20fill-opacity='0'%20cx='37.785'%20cy='28.501'%20r='28.836'/%3e%3cpath%20fill='%23595959'%20d='M37.441-3.5c8.951,0,16.572,3.125,22.857,9.372c3.008,3.009,5.295,6.448,6.857,10.314%20c1.561,3.867,2.344,7.971,2.344,12.314c0,4.381-0.773,8.486-2.314,12.313c-1.543,3.828-3.82,7.21-6.828,10.143%20c-3.123,3.085-6.666,5.448-10.629,7.086c-3.961,1.638-8.057,2.457-12.285,2.457s-8.276-0.808-12.143-2.429%20c-3.866-1.618-7.333-3.961-10.4-7.027c-3.067-3.066-5.4-6.524-7-10.372S5.5,32.767,5.5,28.5c0-4.229,0.809-8.295,2.428-12.2%20c1.619-3.905,3.972-7.4,7.057-10.486C21.08-0.394,28.565-3.5,37.441-3.5z%20M37.557,2.272c-7.314,0-13.467,2.553-18.458,7.657%20c-2.515,2.553-4.448,5.419-5.8,8.6c-1.354,3.181-2.029,6.505-2.029,9.972c0,3.429,0.675,6.734,2.029,9.913%20c1.353,3.183,3.285,6.021,5.8,8.516c2.514,2.496,5.351,4.399,8.515,5.715c3.161,1.314,6.476,1.971,9.943,1.971%20c3.428,0,6.75-0.665,9.973-1.999c3.219-1.335,6.121-3.257,8.713-5.771c4.99-4.876,7.484-10.99,7.484-18.344%20c0-3.543-0.648-6.895-1.943-10.057c-1.293-3.162-3.18-5.98-5.654-8.458C50.984,4.844,44.795,2.272,37.557,2.272z%20M37.156,23.187%20l-4.287,2.229c-0.458-0.951-1.019-1.619-1.685-2c-0.667-0.38-1.286-0.571-1.858-0.571c-2.856,0-4.286,1.885-4.286,5.657%20c0,1.714,0.362,3.084,1.085,4.113c0.724,1.029,1.791,1.544,3.201,1.544c1.867,0,3.181-0.915,3.944-2.743l3.942,2%20c-0.838,1.563-2,2.791-3.486,3.686c-1.484,0.896-3.123,1.343-4.914,1.343c-2.857,0-5.163-0.875-6.915-2.629%20c-1.752-1.752-2.628-4.19-2.628-7.313c0-3.048,0.886-5.466,2.657-7.257c1.771-1.79,4.009-2.686,6.715-2.686%20C32.604,18.558,35.441,20.101,37.156,23.187z%20M55.613,23.187l-4.229,2.229c-0.457-0.951-1.02-1.619-1.686-2%20c-0.668-0.38-1.307-0.571-1.914-0.571c-2.857,0-4.287,1.885-4.287,5.657c0,1.714,0.363,3.084,1.086,4.113%20c0.723,1.029,1.789,1.544,3.201,1.544c1.865,0,3.18-0.915,3.941-2.743l4,2c-0.875,1.563-2.057,2.791-3.541,3.686%20c-1.486,0.896-3.105,1.343-4.857,1.343c-2.896,0-5.209-0.875-6.941-2.629c-1.736-1.752-2.602-4.19-2.602-7.313%20c0-3.048,0.885-5.466,2.658-7.257c1.77-1.79,4.008-2.686,6.713-2.686C51.117,18.558,53.938,20.101,55.613,23.187z'/%3e%3c/g%3e%3c/svg%3e)
%20--%3e%3c!DOCTYPE%20svg%20PUBLIC%20'-//W3C//DTD%20SVG%201.0//EN'%20'http://www.w3.org/TR/2001/REC-SVG-20010904/DTD/svg10.dtd'%3e%3csvg%20version='1.0'%20id='Layer_1'%20xmlns='http://www.w3.org/2000/svg'%20xmlns:xlink='http://www.w3.org/1999/xlink'%20x='0px'%20y='0px'%20width='64px'%20height='64px'%20viewBox='5.5%20-3.5%2064%2064'%20enable-background='new%205.5%20-3.5%2064%2064'%20xml:space='preserve'%3e%3cg%3e%3ccircle%20fill='%23FFFFFF'%20fill-opacity='0'%20cx='37.637'%20cy='28.806'%20r='28.276'/%3e%3cg%3e%3cpath%20fill='%23595959'%20d='M37.443-3.5c8.988,0,16.57,3.085,22.742,9.257C66.393,11.967,69.5,19.548,69.5,28.5c0,8.991-3.049,16.476-9.145,22.456%20C53.879,57.319,46.242,60.5,37.443,60.5c-8.649,0-16.153-3.144-22.514-9.43C8.644,44.784,5.5,37.262,5.5,28.5%20c0-8.761,3.144-16.342,9.429-22.742C21.101-0.415,28.604-3.5,37.443-3.5z%20M37.557,2.272c-7.276,0-13.428,2.553-18.457,7.657%20c-5.22,5.334-7.829,11.525-7.829,18.572c0,7.086,2.59,13.22,7.77,18.398c5.181,5.182,11.352,7.771,18.514,7.771%20c7.123,0,13.334-2.607,18.629-7.828c5.029-4.838,7.543-10.952,7.543-18.343c0-7.276-2.553-13.465-7.656-18.571%20C50.967,4.824,44.795,2.272,37.557,2.272z%20M46.129,20.557v13.085h-3.656v15.542h-9.944V33.643h-3.656V20.557%20c0-0.572,0.2-1.057,0.599-1.457c0.401-0.399,0.887-0.6,1.457-0.6h13.144c0.533,0,1.01,0.2,1.428,0.6%20C45.918,19.5,46.129,19.986,46.129,20.557z%20M33.042,12.329c0-3.008,1.485-4.514,4.458-4.514s4.457,1.504,4.457,4.514%20c0,2.971-1.486,4.457-4.457,4.457S33.042,15.3,33.042,12.329z'/%3e%3c/g%3e%3c/g%3e%3c/svg%3e)
1. Introduction
Open jet flows are ubiquitous in nature and engineering. Over the years, their spatiotemporal stability and dynamics have been studied extensively (Huerre & Monkewitz Reference Huerre and Monkewitz1990; Schmid & Henningson Reference Schmid and Henningson2001; Drazin & Reid Reference Drazin and Reid2004). It is now well known that when the density of a jet is sufficiently below that of its surroundings, a region of local absolute instability can develop in the near field (Monkewitz & Sohn Reference Monkewitz and Sohn1988; Yu & Monkewitz Reference Yu and Monkewitz1990; Jendoubi & Strykowski Reference Jendoubi and Strykowski1994; Lesshafft & Huerre Reference Lesshafft and Huerre2007; Coenen, Sevilla & Sánchez Reference Coenen, Sevilla and Sánchez2008; Lesshafft & Marquet Reference Lesshafft and Marquet2010; Srinivasan, Hallberg & Strykowski Reference Srinivasan, Hallberg and Strykowski2010; Coenen & Sevilla Reference Coenen and Sevilla2012). If this region is sufficiently large, then it can give rise to global instability, causing the jet to transition from a spatial amplifier of extrinsic perturbations to a self-excited oscillator with an intrinsic limit cycle at a well-defined natural frequency (Chomaz, Huerre & Redekopp Reference Chomaz, Huerre and Redekopp1988; Chomaz Reference Chomaz2005; Lesshafft et al. Reference Lesshafft, Huerre, Sagaut and Terracol2006; Hallberg et al. Reference Hallberg, Srinivasan, Gorse and Strykowski2007; Lesshafft, Huerre & Sagaut Reference Lesshafft, Huerre and Sagaut2007; Coenen et al. Reference Coenen, Lesshafft, Garnaud and Sevilla2017; Chakravarthy, Lesshafft & Huerre Reference Chakravarthy, Lesshafft and Huerre2018). If the jet discharges from a round non-swirling nozzle with thin shear layers, then its dynamics will be dominated by axisymmetric (bulging) oscillations with azimuthal wavenumber  $m=0$, which can arise via a supercritical or subcritical Hopf bifurcation (Sreenivasan, Raghu & Kyle Reference Sreenivasan, Raghu and Kyle1989; Monkewitz et al. Reference Monkewitz, Bechert, Barsikow and Lehmann1990; Kyle & Sreenivasan Reference Kyle and Sreenivasan1993; Hallberg & Strykowski Reference Hallberg and Strykowski2006; Zhu, Gupta & Li Reference Zhu, Gupta and Li2017, Reference Zhu, Gupta and Li2019). Such self-excited oscillations are desirable in some situations because they can aid mixing and transport. They are, however, undesirable in other situations because they can couple with structural, acoustic or other hydrodynamic modes at nearby frequencies. It is thus important to be able to control the self-excited oscillations of globally unstable jets.
Studies have already shown that globally unstable axisymmetric jets can be controlled readily with time-periodic acoustic forcing applied axially, such that rotationally symmetric perturbations of a prescribed frequency and amplitude are generated at the jet base (see § 1.2 for details). Under most conditions, however, such jets are not only globally unstable to the axisymmetric mode ( $m=0$), but also convectively unstable to the helical modes, i.e. the spiralling modes with
 $m = \pm 1, \pm 2, \ldots$ (Monkewitz & Sohn Reference Monkewitz and Sohn1988; Jendoubi & Strykowski Reference Jendoubi and Strykowski1994; Lesshafft & Huerre Reference Lesshafft and Huerre2007; Coenen et al. Reference Coenen, Sevilla and Sánchez2008). Consequently, it is important to explore the effects of rotationally asymmetric forcing as well, not least because such forcing could interact differently with the natural axisymmetric and helical modes, producing axisymmetry-breaking phenomena not seen with purely axial forcing. In this study, we take a forced synchronization approach to investigating the effects of axisymmetry breaking, induced by transverse acoustic forcing, on a globally unstable low-density jet oscillating self-excitedly in a period-1 limit cycle. Before presenting our experimental and modelling methodologies (§§ 2 and 3) and results (§§ 4 and 5), we will review the universal concept of forced synchronization and its amplitude suppression mechanisms (§ 1.1) and survey previous work on the axial (§ 1.2) and transverse (§ 1.3) forcing of axisymmetric jets, drawing on examples involving global instability in the hydrodynamic field whenever possible.
1.1. Forced synchronization and its amplitude suppression mechanisms
When a self-excited oscillator (e.g. a globally unstable flow) is forced externally at a frequency  $f_f$ different from its natural frequency
 $f_n$, it can adjust its motion to match that of the forcing signal (Pikovsky, Rosenblum & Kurths Reference Pikovsky, Rosenblum and Kurths2003). This unidirectional adjustment process is known as forced synchronization (Balanov et al. Reference Balanov, Janson, Postnov and Sosnovtseva2009) and can lead to a completely synchronous state, known as lock-in in fluid mechanics (Sreenivasan et al. Reference Sreenivasan, Raghu and Kyle1989), if the forcing amplitude is sufficiently high. According to synchronization theory based on single-mode oscillators, lock-in tends to occur via two universal routes (Balanov et al. Reference Balanov, Janson, Postnov and Sosnovtseva2009): phase locking and suppression. Along the phase-locking route, which typically arises when the detuning
 $(|f_f - f_n|)$ is small, lock-in occurs via a gradual pulling of
 $f_n^\ast$ (where the superscript
 $^\ast$ denotes the presence of external forcing) towards
 $f_f$ as the forcing amplitude increases. By contrast, along the suppression route, which typically arises when the detuning is large, lock-in occurs via a gradual reduction in the amplitude of the natural mode without a simultaneous pulling of its frequency. These two routes can also be distinguished by their unique bifurcations: the phase-locking route involves a saddle-node bifurcation to lock-in, whereas the suppression route involves an inverse Neimark–Sacker bifurcation to lock-in, i.e. a torus-death bifurcation (Balanov et al. Reference Balanov, Janson, Postnov and Sosnovtseva2009; Li & Juniper Reference Li and Juniper2013a,Reference Li and Juniperc; Hyodo & Biwa Reference Hyodo and Biwa2018; Kashinath, Li & Juniper Reference Kashinath, Li and Juniper2018).
However, only along the suppression route can asynchronous quenching occur (Bogoliubov & Mitropolsky Reference Bogoliubov and Mitropolsky1961; Balanov et al. Reference Balanov, Janson, Postnov and Sosnovtseva2009). This is a nonlinear phenomenon whereby the natural mode of a self-excited oscillator is stabilized to a fixed point by periodic forcing applied externally at an off-resonance frequency sufficiently far from  $f_n$, i.e. at large detuning (Minorsky Reference Minorsky1974). Under most conditions, asynchronous quenching occurs without amplification of the forcing signal (Minorsky Reference Minorsky1967), resulting in a substantial reduction in the overall response amplitude of the forced self-excited system – often to less than 20 % of the natural (uncontrolled) amplitude (Guan et al. Reference Guan, Gupta, Kashinath and Li2019a,Reference Guan, Gupta, Wan and Lib). Such quenching of the natural mode is due to the external forcing inducing an asymptotic loss of stability in the original limit-cycle attractor (Minorsky Reference Minorsky1974). Nevertheless, it is worth noting that quenching of the natural mode can occur for small detuning as well, in an analogous process known as synchronous quenching (Odajima, Nishida & Hatta Reference Odajima, Nishida and Hatta1974). This type of quenching, however, is usually accompanied by resonant amplification of the forcing signal, resulting in an increase in the overall response amplitude (Abel, Ahnert & Bergweiler Reference Abel, Ahnert and Bergweiler2009). Both asynchronous and synchronous quenching are universal phenomena in nonlinear dynamical systems (Pikovsky et al. Reference Pikovsky, Rosenblum and Kurths2003) and can be modelled with a forced self-excited oscillator containing a generic Van der Pol (VDP) kernel (Dewan Reference Dewan1972; Odajima et al. Reference Odajima, Nishida and Hatta1974). Unsurprisingly, such phenomena have been observed in various systems, ranging from premixed combustors (Lubarsky et al. Reference Lubarsky, Shcherbik, Bibik and Zinn2003; Bellows, Hreiz & Lieuwen Reference Bellows, Hreiz and Lieuwen2008; Kashinath et al. Reference Kashinath, Li and Juniper2018; Guan, Murugesan & Li Reference Guan, Murugesan and Li2018; Guan et al. Reference Guan, Gupta, Kashinath and Li2019a,Reference Guan, Gupta, Wan and Lib,Reference Guan, He, Murugesan, Li, Liu and Lic; Mondal, Pawar & Sujith Reference Mondal, Pawar and Sujith2019; Roy et al. Reference Roy, Mondal, Pawar and Sujith2020) to plasma columns (Keen & Fletcher Reference Keen and Fletcher1969, Reference Keen and Fletcher1970; Ohe & Takeda Reference Ohe and Takeda1974) to open jet flows (Staubli & Rockwell Reference Staubli and Rockwell1987; Li & Juniper Reference Li and Juniper2013a), albeit mostly in response to purely axial (symmetric) forcing.
For open-loop control, asynchronous quenching appears to be a promising mechanism by which to suppress limit-cycle oscillations. However, a major drawback of this strategy, as implemented in the examples above, is the need for  $f_f$ to be sufficiently far from
 $f_n$ (Bogoliubov & Mitropolsky Reference Bogoliubov and Mitropolsky1961; Minorsky Reference Minorsky1967). This presents a potential challenge for open-loop controllers as it requires prior knowledge of the value of
 $f_n$, which may be difficult to obtain in systems where even momentary excursions into a high-amplitude limit-cycle regime can cause catastrophic mechanical or thermal damage. Exacerbating this is the possibility that
 $f_n$ can drift with changes in the operating conditions or system parameters. For robust control, it would be helpful to have a method of suppressing limit-cycle oscillations that is less sensitive to the detuning between the forced and natural modes. In other words, we seek a method of inducing both asynchronous and synchronous quenching that simultaneously avoids any amplification of the forcing signal. In this study, we demonstrate on a prototypical hydrodynamic oscillator – a globally unstable low-density axisymmetric jet – that one such method is to exploit axisymmetry breaking by applying transverse acoustic forcing.
1.2. Axial forcing of globally unstable jets
The hydrodynamic response of a globally unstable low-density axisymmetric jet to axial acoustic forcing has been studied by Li & Juniper (Reference Li and Juniper2013a,Reference Li and Juniperc). These researchers found that when  $f_f$ is incommensurable with
 $f_n^\ast$ (i.e. when the dressed winding number,
 $f_n^\ast /f_f$, is irrational), the jet can be in one of three possible states depending on the forcing amplitude. When unforced, the jet oscillates periodically at
 $f_n$, with its phase trajectory evolving on a limit-cycle attractor. When forced weakly, the jet oscillates quasiperiodically at both
 $f_n^\ast$ and
 $f_f$, with its phase trajectory evolving on a two-frequency torus attractor. When forced strongly, the jet locks into the forcing by oscillating only at
 $f_f$ and its harmonics, with the phase trajectory evolving on another limit-cycle attractor but at
 $f_f$ instead of
 $f_n$. The minimum forcing amplitude required for lock-in increases as
 $f_f$ shifts away from
 $f_n$, producing a
 $\vee$-shaped lock-in boundary centred on
 $f_f/f_n=1$. The parameter space above this boundary is known as the
 $1:1$ Arnold tongue in synchronization theory (Pikovsky et al. Reference Pikovsky, Rosenblum and Kurths2003; Balanov et al. Reference Balanov, Janson, Postnov and Sosnovtseva2009). Such a tongue can be found not only in low-density jets (Sreenivasan et al. Reference Sreenivasan, Raghu and Kyle1989; Kyle & Sreenivasan Reference Kyle and Sreenivasan1993; Hallberg & Strykowski Reference Hallberg and Strykowski2008; Li & Juniper Reference Li and Juniper2013a,Reference Li and Juniperc; Murugesan, Zhu & Li Reference Murugesan, Zhu and Li2019) but also in other globally unstable flows, such as bluff-body wakes (Koopmann Reference Koopmann1967; Stansby Reference Stansby1976; Provansal, Mathis & Boyer Reference Provansal, Mathis and Boyer1987; Olinger & Sreenivasan Reference Olinger and Sreenivasan1988; Karniadakis & Triantafyllou Reference Karniadakis and Triantafyllou1989), capillary jets (Olinger Reference Olinger1992), jet diffusion flames (Juniper, Li & Nichols Reference Juniper, Li and Nichols2009; Li & Juniper Reference Li and Juniper2013b), and cross-flow jets (Davitian et al. Reference Davitian, Getsinger, Hendrickson and Karagozian2010a,Reference Davitian, Hendrickson, Getsinger, M'closkey and Karagozianb; Karagozian Reference Karagozian2010; Shoji et al. Reference Shoji, Harris, Besnard, Schein and Karagozian2020).
Li & Juniper (Reference Li and Juniper2013a,Reference Li and Juniperc) also found that as the forcing amplitude increases en route to lock-in, the jet follows either the phase-locking route if  $f_f$ is close to
 $f_n$, or the suppression route if
 $f_f$ is far from
 $f_n$. Crucially, asynchronous quenching was observed only along the suppression route (Li & Juniper Reference Li and Juniper2013a,Reference Li and Juniperc). All of these experimental observations are consistent with theoretical analyses of the classic (single-mode) VDP oscillator subjected to external periodic forcing (Dewan Reference Dewan1972; Balanov et al. Reference Balanov, Janson, Postnov and Sosnovtseva2009). This shows that these synchronization phenomena are not unique to a forced low-density jet, but are universal to forced self-excited oscillators in general.
1.3. Transverse forcing of jets
Compared with that of axial forcing, the effect of transverse forcing has been less well studied, despite its relevance to annular combustors in gas turbines (Hauser, Lorenz & Sattelmayer Reference Hauser, Lorenz and Sattelmayer2010; Bauerheim et al. Reference Bauerheim, Salas, Nicoud and Poinsot2014; Bourgouin et al. Reference Bourgouin, Durox, Moeck, Schuller and Candel2015; Ghirardo, Juniper & Moeck Reference Ghirardo, Juniper and Moeck2016). In such devices, multiple jet-stabilized flames are typically distributed around the annulus and can interact with the acoustics therein to produce azimuthal thermoacoustic instabilities in the form of spinning and standing modes (Ghirardo & Juniper Reference Ghirardo and Juniper2013; Noiray & Schuermans Reference Noiray and Schuermans2013b; Bothien, Noiray & Schuermans Reference Bothien, Noiray and Schuermans2015; Yang, Laera & Morgans Reference Yang, Laera and Morgans2019). From the local viewpoint of an individual flame, such modes appear as an approximately one-dimensional acoustic field, generating time-varying pressure gradients in a direction perpendicular (transverse) to the jet axis (O'Connor, Acharya & Lieuwen Reference O'Connor, Acharya and Lieuwen2015). Under certain conditions, a statistical preference can emerge for standing modes over spinning modes (Noiray, Bothien & Schuermans Reference Noiray, Bothien and Schuermans2011; Wolf et al. Reference Wolf, Staffelbach, Gicquel, Müller and Poinsot2012; Worth & Dawson Reference Worth and Dawson2013). Flames located at different points along the standing waveform would thus experience different pressure fields, causing some hydrodynamic modes to be excited preferentially over others, depending on the exact nozzle location (Lespinasse, Baillot & Boushaki Reference Lespinasse, Baillot and Boushaki2013).
Lieuwen's group (O'Connor & Lieuwen Reference O'Connor and Lieuwen2011, Reference O'Connor and Lieuwen2012b; Blimbaum et al. Reference Blimbaum, Zanchetta, Akin, Acharya, O'Connor, Noble and Lieuwen2012; O'Connor et al. Reference O'Connor, Acharya and Lieuwen2015; Smith et al. Reference Smith, Emerson, Proscia and Lieuwen2018a,Reference Smith, Douglas, Emerson and Lieuwenb) has investigated the response of swirling jets and swirl-stabilized flames to planar acoustic standing waves. At a pressure node, the acoustic perturbations are antisymmetric (out-of-phase by  ${\rm \pi}$) about the nodal line running through the nozzle centre, producing transverse velocity perturbations that preferentially excite the odd-
 $m$ helical hydrodynamic modes (
 $m=\pm 1, \pm 3, \ldots;$ O'Connor & Lieuwen Reference O'Connor and Lieuwen2012a,Reference O'Connor and Lieuwenb; Smith et al. Reference Smith, Douglas, Emerson and Lieuwen2018b); the superposition of a pair of counter-rotating
 $m=\pm 1$ modes of equal amplitude can induce a transverse flapping motion with staggered vortices in the shear layers. At a pressure antinode, the acoustic perturbations are symmetric (in-phase) about the antinodal line running through the nozzle centre, producing axial velocity perturbations that preferentially excite the bulging hydrodynamic mode (
 $m=0$), leading to the axisymmetric roll-up of vortical structures (O'Connor & Lieuwen Reference O'Connor and Lieuwen2012a,Reference O'Connor and Lieuwenb; Smith et al. Reference Smith, Douglas, Emerson and Lieuwen2018b). From these and other related studies (Hauser et al. Reference Hauser, Lorenz and Sattelmayer2010; Lespinasse et al. Reference Lespinasse, Baillot and Boushaki2013; Saurabh & Paschereit Reference Saurabh and Paschereit2017; Saurabh, Moeck & Paschereit Reference Saurabh, Moeck and Paschereit2017), it can be concluded that axial forcing (pressure antinode) preferentially excites axisymmetric flow structures, whereas transverse forcing (pressure node) preferentially excites flapping flow structures.
The hydrodynamic response of a globally unstable jet to transverse acoustic forcing has been studied by only a few researchers. In seminal experiments, O'Connor & Lieuwen (Reference O'Connor and Lieuwen2012b) applied transverse (out-of-phase) and axial (in-phase) forcing to a swirling annular jet featuring a central vortex breakdown bubble generated by global hydrodynamic instability. When unforced, the jet was found to be dominated by the  $m=-2$ and
 $-1$ helical modes, which were associated with large-scale undulations of the jet column and with coherent structures in the recirculation zone, respectively. Transverse forcing was found to alter the relative amplitudes of the two modes, without much affecting the axisymmetric mode (
 $m=0$). These findings are consistent with the trends discussed above, highlighting again how certain hydrodynamic modes can be preferentially excited over others, depending on the spatial symmetry of the applied forcing. Crucially, in this non-axisymmetric swirling jet, neither lock-in nor asynchronous/synchronous quenching was observed with either axial or transverse forcing, even at high forcing amplitudes (O'Connor & Lieuwen Reference O'Connor and Lieuwen2012b).
Other studies that have examined the effects of asymmetric forcing have done so with a focus on convectively unstable jets (Parekh, Reynolds & Mungal Reference Parekh, Reynolds and Mungal1987; Reynolds et al. Reference Reynolds, Parekh, Juvet and Lee2003; Suzuki, Kasagi & Suzuki Reference Suzuki, Kasagi and Suzuki2004; Tyliszczak & Geurts Reference Tyliszczak and Geurts2014; Tyliszczak Reference Tyliszczak2015; Gohil & Saha Reference Gohil and Saha2019). Unlike globally unstable jets, convectively unstable jets are not self-excited (Huerre & Monkewitz Reference Huerre and Monkewitz1990) and therefore cannot undergo asynchronous or synchronous quenching, regardless of the value of  $f_f$ (Minorsky Reference Minorsky1967). Studies on convectively unstable axisymmetric jets have examined how some of their characteristics – such as mixing, entrainment and spreading – can be enhanced via transverse forcing (Urbin & Métais Reference Urbin and Métais1997; Danaila & Boersma Reference Danaila and Boersma2000; Worth et al. Reference Worth, Mistry, Berk and Dawson2020; Douglas et al. Reference Douglas, Emerson, Hemchandra and Lieuwen2021) or via a combination of axial and transverse forcing applied at the same frequency (Æsøy et al. Reference Æsøy, Aguilar, Worth and Dawson2021) or at different frequencies (Da Silva & Métais Reference Da Silva and Métais2002). However, little is known about how such complex forcing patterns would affect a globally unstable axisymmetric jet, particularly its bifurcations en route to lock-in and its ability to undergo asynchronous and synchronous quenching. This is despite the fact that such a jet is a prototypical hydrodynamic oscillator (Huerre & Monkewitz Reference Huerre and Monkewitz1990) and that global instability has been detected in the open shear flows of various propulsion and power-generation devices (Juniper Reference Juniper2012; Oberleithner et al. Reference Oberleithner, Stöhr, Im, Arndt and Steinberg2015; Tammisola & Juniper Reference Tammisola and Juniper2016).
1.4. Contributions of the present study
It is well known that a low-density inertial jet discharging from a round nozzle can develop global axisymmetric oscillations at a discrete natural frequency  $f_n$. Previous experiments have shown that when such a jet is forced axially at an off-resonance frequency
 $f_f$, its self-excited oscillations can become suppressed via asynchronous quenching, without amplification of the forcing signal, resulting in a substantial reduction in the overall response amplitude (§§ 1.1 and 1.2). This is clearly a promising strategy for open-loop flow control, but it requires
 $f_f$ to be sufficiently far from
 $f_n$. In this study, we propose an alternative method of inducing both asynchronous and synchronous quenching, one that exploits axisymmetry breaking to avoid any amplification of the forcing signal, thus removing the need to worry about the exact detuning between
 $f_f$ and
 $f_n$. Specifically, we ask three research questions:
(i) Can breaking the axisymmetry of a globally unstable jet via transverse forcing lead to a more effective open-loop control strategy than preserving the axisymmetry via axial forcing?
(ii) If it can, how do the synchronization phenomena – such as the bifurcation routes, Arnold tongues and quenching mechanisms – differ between transverse and axial forcing?
(iii) Can these synchronization phenomena be modelled phenomenologically with a low-dimensional system based simply on a pair of coupled VDP oscillators?
The rest of this paper is organized as follows. In §§ 2 and 3, we introduce the experimental set-up and low-dimensional model, respectively. In §§ 4 and 5, we investigate experimentally the effects of axisymmetry breaking on a globally unstable low-density jet, and then we model the main synchronization phenomena, such as the bifurcation routes, Arnold tongues and quenching mechanisms. In § 6, we conclude with the key implications of this study for the open-loop control of globally unstable axisymmetric flows.
2. Experimental set-up
The experimental set-up consists of two main components (figure 1): a convergent nozzle from which a globally unstable axisymmetric jet is produced (§ 2.1), and a rectangular enclosure in which planar acoustic standing waves are established to perturb the jet (§ 2.2).
Diagram of the experimental set-up. The measurement diagnostics include four microphones mounted flush along the transverse wall of the enclosure, a hot-wire probe positioned on the jet centreline, and a particle image velocimetry system (not shown). MFC: mass flow controller. DAQ: data acquisition system.

2.1. Jet nozzle and velocity measurements
The nozzle has a round outlet whose exit diameter is  $D = 6$ mm. Its internal walls are defined by a fifth-order polynomial with a
 $34:1$ area contraction between the settling chamber and the nozzle outlet. The streamwise, transverse (radial) and cross-stream coordinates are denoted by
 $x$,
 $y$ and
 $z$, respectively, as shown in figure 1. The nozzle outlet can be moved along the transverse (
 $y$) direction, enabling the jet position to be varied relative to the standing acoustic waveform in the enclosure. However, the nozzle outlet always protrudes
 $1.67D$ into the enclosure itself so as to minimize wall effects. Helium gas is discharged from the nozzle into the enclosure air (at temperature 293 K), creating a jet whose density ratio is
 $S \equiv \rho _j / \rho _\infty = 0.14$, well below the upper limit for global instability (Monkewitz et al. Reference Monkewitz, Bechert, Barsikow and Lehmann1990; Kyle & Sreenivasan Reference Kyle and Sreenivasan1993). The helium is supplied from a compressed gas cylinder and is metered with a mass flow controller (Alicat MCR-500). Figure 2(a) shows radial profiles of the normalized time-averaged streamwise velocity,
 $\bar {u}/\bar {u}_{max}$, for a range of Reynolds numbers,
 $700 \leqslant Re \equiv U_j \rho _j D/\mu _j \leqslant 3990$, where
 $U_j$ is the jet centreline velocity, and
 $\mu _j$ is the jet dynamic viscosity. The data are acquired with a hot-wire anemometer positioned just beyond the nozzle outlet (
 $x/D \approx 0.1$); the measurement procedures are described further below. It can be seen in figure 2(a) that the velocity profile is top-hat with thin shear layers. This aids the detection of global instability by keeping the critical
 $Re$ low, thus limiting the ability of convective modes to amplify inherent disturbances (Hallberg et al. Reference Hallberg, Srinivasan, Gorse and Strykowski2007). Figure 2(b) shows that the velocity fluctuations in the jet core are weak (
 $u^{\prime }_{rms}/\bar {u} < 0.35\,\%$), while figure 2(c) shows that the transverse curvature – defined as
 $D$ normalized by the initial momentum thickness
 $\theta _0$ – scales linearly with
 $Re^{1/2}$. This linear scaling indicates that the initial shear layers are laminar, which further aids the detection of global instability.
Characterization of the jet base flow: (a) normalized time-averaged streamwise velocity, and (b) its local fluctuations, both as functions of the radial position. Also shown is (c) the transverse curvature as a function of the square root of the Reynolds number. The data are acquired with a hot-wire anemometer positioned just beyond the nozzle outlet ( $x/D \approx 0.1$).

The hydrodynamic response of the jet to acoustic perturbations is characterized with hot-wire anemometry (HWA) and particle image velocimetry (PIV). HWA is used when long time traces are needed to identify the topology of the jet attractor in its reconstructed phase space, whereas PIV is used when spatiotemporal information is needed to better understand the flow symmetry. The HWA system consists of a constant-temperature bridge operated at an overheat ratio of 1.8 and connected to a single-normal probe (Dantec 55P11) equipped with a platinum-plated tungsten wire (diameter  $5\,\mathrm {\mu }{\rm m}$, length 1.25 mm). Its frequency response is around
 $10^4$ Hz, well above the natural global frequency of the jet (§ 4:
 $f_n \sim 10^3$ Hz). Previous studies have shown that when an open shear flow becomes globally unstable, a large section of its domain becomes temporally synchronized such that its dynamics can be resolved with only local measurements taken at a single spatial location (Huerre & Monkewitz Reference Huerre and Monkewitz1990; Broze & Hussain Reference Broze and Hussain1994). In both the unforced (§ 4) and forced (§ 5) jet experiments, the HWA probe is positioned on the jet centreline,
 $1.5D$ downstream of the nozzle outlet, i.e. at
 $(x/D,y/D)=(1.5,0)$, with uncertainty
 $\pm 0.017D$ in each axis. This sampling location is chosen because it is far enough downstream for a nonlinear global mode to emerge and interact with the applied forcing (Hallberg & Strykowski Reference Hallberg and Strykowski2008), but it is not so far downstream as to be outside the potential core, where fluctuations in helium concentration could contaminate the HWA data (Li & Juniper Reference Li and Juniper2013a,Reference Li and Juniperc). Furthermore, sampling the HWA data in the potential core is preferred because it provides direct measurements of the wavemaker (Lesshafft et al. Reference Lesshafft, Huerre, Sagaut and Terracol2006; Qadri, Chandler & Juniper Reference Qadri, Chandler and Juniper2018), which is the flow region that prescribes the intrinsic dynamics of the global mode (Huerre & Monkewitz Reference Huerre and Monkewitz1990; Chomaz Reference Chomaz2005). The HWA probe wire itself is oriented parallel to the
 $z$ axis (see figure 1) so that it senses simultaneously both streamwise (
 $x$) and transverse (
 $y$) velocity components. This probe orientation enables both axisymmetric (
 $m=0$) and transverse flapping (
 $m=\pm 1$) oscillations in the jet to be resolved. For each test run, the HWA voltage is digitized at 25 600 Hz for 8 s on a 16-bit data acquisition system, generating a time trace of the local
 $x$–
 $y$ velocity,
 $\gamma (t)$. Here the conventional symbol for velocity,
 $u(t)$, is not used because it is reserved for the
 $x$ velocity component measured with PIV (see below) and because the HWA probe is sensitive to both the
 $x$ and
 $y$ velocity components. The
 $\gamma (t)$ data are examined via: (i) the power spectral density (PSD), as computed with the algorithm of Welch (Reference Welch1967); (ii) the instantaneous phase difference, as computed with the Hilbert transform; and (iii) the phase space, as reconstructed via nonlinear time series analysis based on the time-delay embedding theorem of Takens (Reference Takens1981) (Appendix A).
Planar stereoscopic time-resolved PIV measurements are performed to quantify the spatiotemporal evolution of the jet velocity under different forcing conditions. The PIV system consists of a high-speed dual-cavity Nd:YLF laser (Litron LDY303HE), a set of sheet-forming optics (Thorlabs), and two high-speed cameras (Photron FASTCAM SA1.1). Both cameras are fitted with Scheimpflug adapters and 180 mm lenses, with their axes aligned at 12.5 $^\circ$ to the measurement plane normal. The measurement plane itself is illuminated with a laser sheet (thickness 1 mm) positioned in the
 $x$–
 $y$ plane. Oil-droplet seeding is introduced into both the jet flow and the enclosure air via a Laskin nozzle. Image pairs are recorded at 5442 Hz, which is more than five times
 $f_n$; the image separation time is
 $\delta t = 12\,\mathrm {\mu }{\rm s}$. The image resolution is
 $768$ (height)
 $\times$
 $512$ (width) pixels at a depth of 12 bits, spread over a field-of-view measuring
 $4.44D \times 2.96D$. The image pairs are processed with the software DaVis 8.2.2 from LaVision. First, the image pairs are preprocessed with two filters: (i) a sliding background subtraction filter of width 32 pixels; and (ii) a particle intensity normalization filter of width 8 pixels. Next, the image pairs are processed with a multipass cross-correlation algorithm. The initial interrogation area contains
 $64 \times 64$ pixels, with a 50 % window overlap for the first two passes. The final interrogation area contains
 $32 \times 32$ pixels, which corresponds to
 $1.11 \times 1.11$ mm
 $^2$ in physical space; the window overlap for the last pass is 75 %, producing a final vector spacing of
 $0.046D$. The velocity components in the streamwise (
 $x$), transverse (
 $y$) and cross-stream (
 $z$) directions are denoted by
 $u$,
 $v$ and
 $w$, respectively, with the magnitude of the total velocity vector given by
 $V \equiv \sqrt {u^2 + v^2 + w^2}$. In each test run, 4000 image pairs are recorded, resulting in the same number of instantaneous vector fields. This represents over 650 cycles of the natural jet oscillation at
 $f_n$, which is sufficient for statistical convergence.
2.2. Acoustic pressure field
As mentioned earlier, the jet discharges into a rectangular enclosure, in which planar acoustic standing waves are established to perturb the jet. These waves arise from resonance between the natural acoustic modes of the enclosure and the pressure oscillations generated by a pair of loudspeakers (Monacor KU-516) mounted at opposite ends of the enclosure (figure 1). Each loudspeaker is fitted with its own acoustic resonance tube and is driven by a sinusoidal voltage signal sent from a function generator (Aim–TTi TGA1244) via a power amplifier (Crown CE1000). The frequency of the signal (i.e. the forcing frequency  $f_f$) is varied around the natural global frequency of the jet (
 $0.8 \leq f_f/f_n \leq 1.2$) in order to explore the
 $1:1$ Arnold tongue and its synchronization phenomena. The enclosure has width
 $W=0.22$ m (
 $z$ direction), height
 $H=0.59$ m (
 $x$ direction), and variable length
 $L=0.96$–
 $1.35$ m (
 $y$ direction) so that the acoustic resonance frequency can be tuned carefully to match
 $f_f$. The ratio of the enclosure width to the jet diameter (
 $W/D=36.7$) is large enough to keep confinement effects negligible in the near field,
 $0 \leqslant x/D \leqslant 4$. At every value of
 $f_f$, the enclosure contains three full standing waves. The wavelength of these transverse acoustic waves is much larger than the jet diameter (
 $\lambda /D > 53.5$), implying that the jet can be regarded as acoustically compact in the near field. The acoustic pressure fluctuations (
 $p^\prime$) in the enclosure are measured with four microphones (B&K Type 4939-A-011:
 $\pm 2.07 \times 10^{-5}$ Pa uncertainty,
 $4.13$ mV Pa
 $^{-1}$ sensitivity) mounted flush along the transverse wall (figure 1). The multiple microphone method is used to reconstruct the acoustic field in the enclosure from estimates of the incident (
 $p_i$) and reflected (
 $p_r$) planar acoustic waves (Seybert & Ross Reference Seybert and Ross1977; Jang & Ih. Reference Jang and Ih1998). The stationarity of the acoustic mode is verified by ensuring that the standing-wave ratio is sufficiently close to zero:
 $-0.01 < (|p_i|-|p_r|)/(|p_i|+|p_r|) < 0.01$. The jet is positioned at five discrete locations along the acoustic standing wave, producing a variety of forcing conditions: pure axial forcing (position
 $\mathbb {A}$ in figure 3, a pressure antinode), pure transverse forcing (position
 $\mathbb {E}$, a pressure node), and combinations of axial and transverse forcing (positions
 $\mathbb {B}$,
 $\mathbb {C}$ and
 $\mathbb {D}$, between a pressure antinode and a pressure node).
Decomposition of the acoustic pressure field in the jet enclosure. The modal amplitude is shown as a function of  $m$ at five different locations in a planar acoustic standing wave: a pressure antinode (position
 $\mathbb {A}$), a pressure node (position
 $\mathbb {E}$), and between a pressure antinode and node (positions
 $\mathbb {B}$,
 $\mathbb {C}$ and
 $\mathbb {D}$). At the pressure node (position
 $\mathbb {E}$), the superposition of the
 $m=\pm 1$ helical modes leads to a transverse flapping motion. In the experiments, three full standing waves are present in the jet enclosure, but for illustration purposes, only one is shown here.

As discussed in § 1.3, placing a jet in an acoustic standing wave can preferentially excite certain hydrodynamic modes, depending on the exact nozzle location. Following O'Connor et al. (Reference O'Connor, Acharya and Lieuwen2015), we use the Jacobi–Anger expansion to decompose the planar acoustic perturbations in the jet enclosure into a superposition of nozzle-centric modes:
 \begin{align} \textrm{e}^{\textrm{i}ky} + \textrm{e}^{-\textrm{i}ky} &= \sum_{m ={-}\infty}^{\infty} C_m(kr)\, \textrm{e}^{\textrm{i} m \theta} +\sum_{m ={-}\infty}^{\infty} C_m(kr)\,\textrm{e}^{-\textrm{i} m \theta} \end{align}
 \begin{align} &= \sum_{m ={-}\infty}^{\infty} \textrm{i}^{m}\,{\rm J}_m(kr)\,\textrm{e}^{\textrm{i} m \theta} +\sum_{m ={-}\infty}^{\infty} (-\textrm{i})^{m}\,{\rm J}_m(kr)\,\textrm{e}^{-\textrm{i} m \theta}, \end{align}
where  $k$ and
 $m$ are, respectively, the wavenumbers in the transverse (
 $y$) and azimuthal (
 $\theta$) directions,
 $r$ is the nozzle-centric radial coordinate,
 $C_m$ is the modal amplitude, and
 ${\rm J}_m$ is the Bessel function of the first kind. For an acoustically compact nozzle (
 $kr \ll 1$), a Taylor series expansion to leading order gives
 ${\rm J}_m(kr) = (kr)^m/2^m{m!}$. Figure 3 shows that the acoustic disturbances generated at the pressure antinode (position
 $\mathbb {A}$) are dominated by the
 $m=0$ mode, with no contribution from the
 $m=\pm 1$ modes (see inset), indicating pure axial forcing. Moving away from the pressure antinode (i.e. to positions
 $\mathbb {B} \rightarrow \mathbb {D}$), the
 $m=0$ mode gradually weakens, while the
 $m=\pm 1$ modes gradually strengthen. These variations, however, are not symmetric in space: the
 $m=0$ mode remains significantly stronger than the
 $m=\pm 1$ modes, even at positions
 $\mathbb {C}$ and
 $\mathbb {D}$. It is not until arriving fully at the pressure node (position
 $\mathbb {E}$) that the acoustic disturbances become dominated by the
 $m=\pm 1$ modes, with no contribution from the
 $m=0$ mode, indicating pure transverse forcing. Crucially, for a given amplitude of the acoustic standing wave, the axial forcing (
 $m=0$) produced at the pressure antinode (position
 $\mathbb {A}$) is more than an order of magnitude stronger than the transverse forcing (
 $m=\pm 1$) produced at the pressure node (position
 $\mathbb {E}$). Therefore, to provide representative comparisons between axial and transverse forcing, we adjust the amplitude of the acoustic standing wave such that the modal amplitude is kept constant across all five nozzle positions.
3. Low-dimensional model
One of the simplest low-dimensional models with self-excited temporal solutions is the VDP oscillator (van der Pol Reference van der Pol1926). This model has been used throughout science and engineering to study various nonlinear phenomena (Pikovsky et al. Reference Pikovsky, Rosenblum and Kurths2003; Balanov et al. Reference Balanov, Janson, Postnov and Sosnovtseva2009), such as the frictional dynamics of tectonic plates (Cartwright et al. Reference Cartwright, Eguíluz, Hernández-García and Piro1999), the interaction between vocal folds (Lucero & Schoentgen Reference Lucero and Schoentgen2013), and thermoacoustic instabilities in combustors (Noiray & Schuermans Reference Noiray and Schuermans2013a; Guan et al. Reference Guan, Gupta, Kashinath and Li2019a,Reference Guan, Gupta, Wan and Lib, Reference Guan, Moon, Kim and Li2021). Similarly, the forced VDP oscillator has been shown to be able to capture phenomenologically the forced synchronization dynamics of various globally unstable flows, such as cylinder wakes (Baek & Sung Reference Baek and Sung2000), jet diffusion flames (Li & Juniper Reference Li and Juniper2013b) and low-density jets (Li & Juniper Reference Li and Juniper2013a,Reference Li and Juniperc).
However, the classic VDP oscillator contains only a single natural mode, whereas the present study concerns the interactions between axisymmetric and transverse hydrodynamic modes. Therefore, we use two coupled VDP oscillators, each forced externally by a sinusoidal term, to model phenomenologically the forced synchronization of the jet:
 \begin{gather} \ddot{x}_{1} - \sigma_{1}\dot{x}_1 + \omega_{1}^2x_{1}+ \beta_{1}x_{1}^2 \dot{x}_{1} + \alpha_{12}x_{2}^2\dot{x}_{1}+ \kappa_{12}(x_{1} - x_{2}) = b_1\sin({\omega_{f}t}), \end{gather}
 \begin{gather} \ddot{x}_{2} - \sigma_{2}\dot{x}_2 + \omega_{2}^2x_{2}+ \beta_{2}x_{2}^2 \dot{x}_{2} + \alpha_{21}x_{1}^2\dot{x}_{2}+ \kappa_{21}(x_{2} - x_{1}) = b_2\sin({\omega_{f}t}), \end{gather}
where  $x_1$ is the dynamical variable of the oscillator (3.1) representing the axisymmetric mode (
 $m=0$), and
 $x_2$ is the dynamical variable of the oscillator (3.2) representing the transverse mode (
 $m=\pm 1$). Linear growth is controlled by
 $\sigma _{1}$ and
 $\sigma _{2}$, nonlinear saturation is controlled by
 $\beta _{1}$ and
 $\beta _{2}$, and the natural angular frequencies in the linear limit are given by
 $\omega _{1}$ and
 $\omega _{2}$. Each oscillator is forced sinusoidally with an independent amplitude (
 $b_1$ or
 $b_2$) but at a common frequency (
 $\omega _{f}$). Axial forcing is modelled by exciting the
 $m=0$ oscillator ((3.1),
 $b_1>0$), while transverse forcing is modelled by exciting the
 $m=\pm 1$ oscillator ((3.2),
 $b_2>0$). Although our aim is to model phenomenologically the experimentally observed jet dynamics, care must be taken when choosing the values of the coefficients in both (3.1) and (3.2). For the
 $m=0$ oscillator (3.1), we set
 $\sigma _1 = 0.07$ as per Lee et al. (Reference Lee, Zhu, Li and Gupta2019), who used the Fokker–Planck equation to perform system identification of a low-density jet similar to the one studied here. We set
 $\beta _1=4$ because this produces a self-excited oscillation waveform that matches that found in our jet experiments. For the
 $m=\pm 1$ oscillator (3.2), we allow it to be globally stable (
 $\sigma _2 = -0.15$,
 $\beta _2 = 4$), in accordance with the stability analyses of Monkewitz & Sohn (Reference Monkewitz and Sohn1988), Jendoubi & Strykowski (Reference Jendoubi and Strykowski1994), Lesshafft & Huerre (Reference Lesshafft and Huerre2007) and Coenen et al. (Reference Coenen, Sevilla and Sánchez2008). The behaviour of the model remains qualitatively unchanged so long as
 $\sigma _2$ remains small and negative (
 $-0.18 < \sigma _2 < -0.01$). However, when
 $b_2$ increases, the amplitude of the
 $m=\pm 1$ oscillator also increases, causing it to compete with the
 $m=0$ oscillator. We let
 $\omega _1=1$ and
 $\omega _2=1.04$, which is consistent with the analysis of Monkewitz & Sohn (Reference Monkewitz and Sohn1988) showing that the Strouhal number of the axisymmetric mode is slightly lower than that of the first helical mode. We use symmetric nonlinear coupling (
 $\alpha _{12} = \alpha _{21} = 3.6$) to model the stabilizing effect of base flow modifications induced by the growth of either of the two modes (Sipp & Lebedev Reference Sipp and Lebedev2007). We use symmetric linear reactive coupling (
 $\kappa _{12} = \kappa _{21} = 0.015$) to model mode competition (Balanov et al. Reference Balanov, Janson, Postnov and Sosnovtseva2009). We solve the coupled oscillator model ((3.1) and (3.2)) numerically for a wide range of forcing conditions (
 $b_1$,
 $b_2$,
 $\omega _f$) in order to reproduce the synchronization phenomena observed in the jet experiments.
4. Natural jet dynamics
Before examining the forced jet response, it is important to identify a suitable operating point at which to apply external forcing. Figure 4 shows the amplitude and PSD of the HWA velocity fluctuations in the unforced jet over a range of  $Re$. In this bifurcation diagram, we increase and decrease
 $Re$ so as to test for hysteresis and bistability. We define the jet amplitude as the root-mean-square velocity fluctuation normalized by the time-averaged velocity:
 $\gamma ^\prime _{rms}/\bar {\gamma }$. By examining both the jet amplitude and PSD (figure 4), we find four distinct flow regimes.
(i) In regime I (
 $148 < Re < 400$), the jet is globally stable but convectively unstable, as evidenced by the low amplitude of its oscillations and by the absence of sharp peaks in the PSD. Physically, this implies that the amplification of background disturbances by local convective modes is not strong enough to overcome the stabilizing influence of viscosity.
(ii) In regime II (
$400 < Re < 562$), the jet is hysteretic: along the forward path (increasing $Re$), the jet amplitude is initially low but then jumps when $Re$ reaches a critical value ($Re = 474$), coinciding with the emergence of a sharp peak in the PSD. This indicates an abrupt transition from a globally stable state (a fixed point) to a globally unstable state (a limit cycle) (Huerre & Monkewitz Reference Huerre and Monkewitz1990). These limit-cycle oscillations are sustained by a balance between dissipation and extraction of energy, the latter from the base flow via the baroclinic torque (Lesshafft & Huerre Reference Lesshafft and Huerre2007). Along the backward path (decreasing $Re$), the jet remains globally unstable throughout the entire regime; the PSD shown in figure 4(b) is for the forward path only. These differences between the forward and backward paths are characteristic of a subcritical Hopf bifurcation (Strogatz Reference Strogatz1994). Subcritical Hopf bifurcations can arise in various flow systems (e.g. plane Poiseuille flow, Taylor–Couette flow, a Rijke tube; Reynolds & Potter Reference Reynolds and Potter1967; Marques & Lopez Reference Marques and Lopez2006; Rigas et al. Reference Rigas, Jamieson, Li and Juniper2016), but they have only recently been discovered in low-density inertial jets (Zhu et al. Reference Zhu, Gupta and Li2017, Reference Zhu, Gupta and Li2019).(iii) In regime III (
$562 < Re < 695$), the jet amplitude increases sharply and then decreases with increasing $Re$, while the dominant frequency in the PSD remains roughly constant. This indicates that the global hydrodynamic mode of the jet has locked into a natural acoustic mode of the nozzle, resulting in hydroacoustic resonance at a constant Helmholtz number. This regime is to be avoided in our forced synchronization tests because the natural jet dynamics is no longer prescribed by global hydrodynamic instability.(iv) In regime IV (
$695 < Re < 888$), both the jet amplitude and frequency resume the upward trends that began in regime II, indicating that the global hydrodynamic mode is no longer locked into a natural acoustic mode of the nozzle. In regimes II and IV, the dominant frequency increases with $Re$ in accordance with the scaling proposed by Hallberg & Strykowski (Reference Hallberg and Strykowski2006) based on a viscous diffusion time scale. This confirms that the instability is caused by hydrodynamic mechanisms alone, rather than by hydroacoustic coupling.


(a) Normalized amplitude and (b) PSD of the HWA velocity fluctuations in the unforced jet over a range of  $Re$. Panel (b) is for the forward path only. In our forced synchronization tests (§ 5), we consider an operating point (regime IV:
 $Re = 800$) at which the jet is dominated by global hydrodynamic instability. The resultant self-excited oscillations are axisymmetric (
 $m=0$), as shown in the schlieren snapshot (see inset).

In our forced synchronization tests (§ 5), we consider an operating point in regime IV where  $Re = 800$ (
 $\pm 3.7\,\%$). We choose this particular point because it is far from regime II where hysteretic bistability occurs. It is also sufficiently far from regime III that, even at high forcing amplitudes, the instantaneous
 $Re$ remains high enough to keep the jet in a purely hydrodynamically self-excited state, without the risk of it locking into the nozzle acoustics. Moreover, the Mach number (
 $M \equiv U_j/c_j = 1.6\times 10^{-2}$, where
 $c_j$ is the speed of sound) and the Richardson number (
 $Ri \equiv g D (\rho _\infty - \rho _j) / \rho _j U_j^2 = 1.3\times 10^{-3}$) are both low enough to render the effects of compressibility and buoyancy insignificant. Finally, spatiotemporal stability analyses have shown that if the shear layers of a low-density axisymmetric jet are excessively thick, then the helical modes (
 $m=\pm 1$) can join the axisymmetric mode (
 $m=0$) in becoming locally absolutely unstable (Monkewitz & Sohn Reference Monkewitz and Sohn1988; Jendoubi & Strykowski Reference Jendoubi and Strykowski1994; Lesshafft & Huerre Reference Lesshafft and Huerre2007; Coenen et al. Reference Coenen, Sevilla and Sánchez2008). To prevent this, we ensure that the transverse curvature (
 $D/\theta _0 = 33.2$) at our chosen operating point (
 $Re = 800$) is in a range where local absolute instability exists in only the axisymmetric mode, and not in any of the helical modes (Jendoubi & Strykowski Reference Jendoubi and Strykowski1994). Consequently, the unforced jet is dominated by global hydrodynamic oscillations whose spatial mode structure is axisymmetric (
 $m=0$), as shown in the schlieren snapshot of figure 4 (see inset).
5. Forced jet response
Having identified a suitable operating point (§ 4), we proceed to explore the forced synchronization of the jet. We apply time-periodic acoustic forcing of different amplitudes, frequencies ( $0.8 < f_f/f_n < 1.2$) and symmetries (axial, transverse, and a mix of both). At each
 $f_f$, we increase the forcing amplitude incrementally to a value above that required for lock-in. We define the forcing amplitude as
 $a \equiv (a_1^2 + a_2^2)^{1/2}$, where
 $a_1$ is the maximum pressure oscillation amplitude at the nozzle outlet centreline and is a measure of the axial forcing amplitude, while
 $a_2$ is the maximum pressure gradient across the nozzle centreline and is a measure of the transverse forcing amplitude. We define the normalized response amplitude of the jet as
 $\eta _\gamma \equiv \gamma ^{\prime \ast }_{rms}/\gamma ^\prime _{rms}$, where
 $\gamma ^{\prime \ast }_{rms}$ and
 $\gamma ^\prime _{rms}$ denote the root-mean-square HWA velocity fluctuations in the forced and unforced jets, respectively. The HWA data will be supplemented by PIV data in § 5.2.
5.1. Synchronization maps
To provide an overview of the amplitude response and lock-in boundaries, we show in figure 5 the synchronization maps for the five jet positions examined in figure 3. These maps contain surfaces of  $\eta _\gamma$ in a parameter space defined by
 $a$ and
 $f_f/f_n$. The red and blue regions correspond, respectively, to amplification and attenuation of the self-excited jet oscillations. For each value of
 $f_f/f_n$, the minimum value of
 $a$ required for lock-in,
 $a_{loc}$, is indicated by circular markers. As noted in § 1.2, the region above these markers is known as the
 $1:1$ Arnold tongue (Balanov et al. Reference Balanov, Janson, Postnov and Sosnovtseva2009). The filled (black) markers denote a saddle-node bifurcation along the phase-locking route to lock-in, whereas the hollow (white) markers denote an inverse Neimark–Sacker bifurcation along the suppression route to lock-in; these two routes will be examined in §§ 5.3.1 and 5.3.2. In this study, we define lock-in as a completely synchronous state in which the instantaneous phase difference between the forcing signal and the forced self-excited system is constant in time; this state is known as phase locking in the synchronization literature and can be reached via either the phase-locking route or the suppression route (Pikovsky et al. Reference Pikovsky, Rosenblum and Kurths2003). Prior to lock-in (
 $a < a_{loc}$), the jet is either partially synchronized (phase trapping) or desynchronized (phase drifting), depending on its proximity to the Arnold tongue; these intermediate quasiperiodic states will also be examined in §§ 5.3.1 and 5.3.2.
Synchronization maps from the forced jet experiments. The surface colours denote the normalized response amplitude ( $\eta _\gamma \equiv \gamma ^{\prime \ast }_{rms}/\gamma ^\prime _{rms}$), shown in a parameter space defined by the forcing amplitude (
 $a$) and the normalized forcing frequency (
 $f_f/f_n$). The minimum value of
 $a$ required for lock-in,
 $a_{loc}$, is indicated by circular markers, which form the lower boundaries of the
 $1:1$ Arnold tongue. The filled (black) markers denote a saddle-node bifurcation along the phase-locking route to lock-in, whereas the hollow (white) markers denote an inverse Neimark–Sacker bifurcation along the suppression route to lock-in.

The synchronization maps in figure 5 reveal that  $a_{loc}$ increases as
 $f_f/f_n$ deviates from 1, producing a classic
 $\vee$-shaped Arnold tongue centred on the natural mode (
 $f_f/f_n = 1$). The shape and position of the Arnold tongue remain similar across all five jet positions, indicating that the jet always locks in at the same set of forcing amplitudes regardless of the symmetry of the imposed perturbations, i.e. regardless of whether the forcing is purely axial (position
 $\mathbb {A}$), purely transverse (position
 $\mathbb {E}$), or a mix of both (positions
 $\mathbb {B}$,
 $\mathbb {C}$ and
 $\mathbb {D}$).
An examination of the  $\eta _\gamma$ surfaces shows that when the jet is forced purely axially (figure 5, position
 $\mathbb {A}$), its oscillations within the Arnold tongue are amplified when
 $f_f/f_n < 1$ (red regions) but attenuated when
 $f_f/f_n > 1$ (blue regions). This is consistent with the experiments by Li & Juniper (Reference Li and Juniper2013a), who found the same asymmetry in a similar jet subjected to pure axial forcing from a loudspeaker mounted upstream of the nozzle outlet. In figure 5, the asymmetry in
 $\eta _\gamma$ also appears at all the jet positions between the pressure antinode and node (positions
 $\mathbb {B}$,
 $\mathbb {C}$ and
 $\mathbb {D}$). This is not surprising given that the acoustic perturbations at these intermediate jet positions are still dominated by the axial mode (figure 3), just as they are at the pressure antinode itself (figure 5, position
 $\mathbb {A}$). As § 5.4 will show, the asymmetry in
 $\eta _\gamma$ is caused by non-resonant amplification of the forcing signal when
 $f_f/f_n < 1$.
When the jet is forced purely transversely (figure 5, position  $\mathbb {E}$), its oscillations become suppressed across the full range of
 $f_f/f_n$. Crucially, this suppression occurs not just inside the Arnold tongue but also outside it, demonstrating the robustness of this control technique (i.e. axisymmetry breaking) to variations in both
 $f_f$ and
 $a$. The degree of suppression is generally high: the oscillation amplitude can be reduced to less than 10–15 % of that of the unforced jet in most of the parameter space (figure 5, position
 $\mathbb {E}$). As § 5.4 will show, this suppression of the self-excited jet oscillations occurs via asynchronous and synchronous quenching, both without any amplification of the forcing signal.
We have shown from a synchronization perspective that breaking the axisymmetry of a globally unstable jet via transverse forcing can lead to a more effective means of open-loop flow control than preserving the axisymmetry via axial forcing. In particular, although the shape and position of the Arnold tongue ( $a_{loc}$) are relatively insensitive to the symmetry of the imposed perturbations, the jet oscillations themselves are suppressed more readily with transverse forcing than with axial forcing. Compared with pure axial forcing (position
 $\mathbb {A}$) and axially dominated forcing (positions
 $\mathbb {B}$,
 $\mathbb {C}$ and
 $\mathbb {D}$), pure transverse forcing (position
 $\mathbb {E}$) can produce larger reductions in
 $\eta _\gamma$ with fewer limitations on the required values of
 $f_f$ and
 $a$. By contrast, when
 $f_f/f_n < 1$, axial forcing, even when combined with transverse forcing, can cause
 $\eta _\gamma$ to exceed unity. This amplification occurs because the axisymmetric global mode (
 $m=0$) is preferentially receptive to perturbations matching its own spatial structure, a phenomenon that will be examined further in § 5.4.
The synchronization maps for the model are shown in figure 6. As before, the surface colours denote the normalized response amplitude ( $\eta _x \equiv x_{rms}^{\prime \ast }/x_{rms}^\prime$), and the circular markers denote the onset of lock-in via a saddle-node bifurcation (filled black markers) or an inverse Neimark–Sacker bifurcation (hollow white markers). The forcing amplitude is defined as
 $b \equiv (b_1^2 + b_2^2)^{1/2}$, with the minimum value of
 $b$ required for lock-in denoted by
 $b_{loc}$. Comparing figures 5 and 6, we find many similarities but also some key differences between the jet and the model. In both systems, the minimum forcing amplitude required for lock-in (
 $a_{loc}$,
 $b_{loc}$) increases with detuning regardless of the symmetry of the imposed perturbations, resulting in a familiar
 $\vee$-shaped Arnold tongue centred on the natural mode (
 $f_f/f_n=1$,
 $\omega _f/\omega _n=1$). Furthermore, when forced purely transversely (figures 5 and 6, position
 $\mathbb {E}$), the self-excited oscillations in both systems become suppressed readily across a wide range of forcing frequencies and amplitudes, highlighting again the effectiveness of axisymmetry breaking as a quenching strategy. However, a notable feature of the jet that could not be captured by the model is the asymmetry in
 $\eta _\gamma$ about
 $f_f/f_n = 1$, which occurs whenever the imposed perturbations are axially dominated, i.e. at positions
 $\mathbb {A}$–
 $\mathbb {D}$ in figure 5. This discrepancy was also noted by Li & Juniper (Reference Li and Juniper2013a), but its origin has yet to be fully established. Nevertheless, it is encouraging to see how such a simple model can still accurately – albeit qualitatively – capture the extensive amplitude suppression observed in the purely transversely forced jet, including its insensitivity to both
 $f_f$ and
 $a$ (figures 5 and 6, position
 $\mathbb {E}$).

5.2. Amplitude suppression and symmetry breaking of the wavemaker region
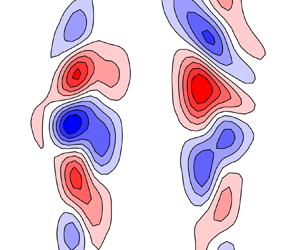
The extensive amplitude suppression observed in the purely transversely forced jet (figure 5) was established based on local measurements made with a spatially fixed HWA probe. To verify that the observed suppression is not simply an artefact of the nonlinear global mode shifting away from the HWA probe, we show in figures 7(a–c) the spatial distribution of the total velocity fluctuation (i.e. the root-mean-square of  $V^{\prime }$, or
 $V^{\prime }_{rms}$), as measured with stereoscopic time-resolved PIV, for both axial and transverse forcing as well as for no forcing at all. Our focus is on the potential core, rather than on the regions downstream, because that is where the wavemaker of the global mode is known to reside (Lesshafft et al. Reference Lesshafft, Huerre, Sagaut and Terracol2006; Qadri et al. Reference Qadri, Chandler and Juniper2018). We demarcate the potential core with a black line representing the regions where
 $\bar {V}$ exceeds 95 % of its value at the nozzle outlet centreline. In figures 7(d–f), we show the normalized PSD of
 $V^{\prime }$ along the jet centreline (
 $y/D=0$) at different axial stations.
Spatial distribution of the jet dynamics, as measured with stereoscopic time-resolved PIV: (a–c) the root-mean-square of the total velocity fluctuation  $V^\prime _{rms}$; (d–f) the normalized PSD of
 $V^{\prime }$ along the jet centreline (
 $y/D=0$); (g–i) the dominant DMD mode with contours of the out-of-plane vorticity fluctuation; and (j) the normalized histogram of the phase shift
 $\varTheta$ between the left and right shear layers. Three representative conditions are shown: (left) unforced, (middle) pure axial forcing at
 $a_{loc}$, and (right) pure transverse forcing at
 $a_{loc}$. With either axial or transverse forcing, the forcing frequency is fixed at
 $f_f/f_n = 1.09$.

When the jet is unforced (figure 7a),  $V_{rms}^{\prime }$ increases from around zero at the nozzle outlet (
 $x/D \approx 0$) to a local maximum within the potential core (
 $x/D \approx 1.5$, coinciding with the HWA probe location; § 2.1), before eventually decreasing downstream towards the tip. The corresponding PSD (figure 7d) shows that these self-excited oscillations occur at the fundamental frequency of the natural global mode (
 $f_n$). Farther downstream (
 $x/D > 2.3$), the subharmonic (
 $f_n/2$) overtakes the fundamental (
 $f_n$) to become the new dominant mode. This coincides with regions of large
 $V_{rms}^{\prime }$ outside the potential core. Such strong
 $f_n/2$ oscillations in the downstream region are known to arise from period doubling associated with vortex pairing, possibly aided by disturbance amplification from local convective modes (Kyle & Sreenivasan Reference Kyle and Sreenivasan1993). From these observations, we can conclude that the potential core of the jet is dominated by a global hydrodynamic mode at its natural fundamental frequency (
 $f_n$).
When the jet is forced purely axially at  $a_{loc}$ and
 $f_f/f_n = 1.09$ (figure 7b),
 $V_{rms}^{\prime }$ becomes lower than that of the unforced jet, particularly in the potential core, which is now noticeably shorter. This amplitude reduction for
 $f_f > f_n$ is consistent with the
 $\eta _\gamma$ data (figure 5) extracted from our local HWA measurements. The corresponding PSD (figure 7e) shows that, as is the case without forcing, most of the potential core oscillates at the fundamental frequency of the dominant mode, which is now at
 $f_f$ (not
 $f_n$) because the jet has locked into the forcing. For a similar reason, the regions downstream oscillate at the subharmonic of the forced mode (
 $f_f/2$), rather than at the subharmonic of the natural global mode (
 $f_n/2$).
When the jet is forced purely transversely at  $a_{loc}$ and
 $f_f/f_n = 1.09$ (figure 7c),
 $V_{rms}^{\prime }$ becomes even lower than that of the purely axially forced jet (figure 7b), with most of the decrease occurring in the potential core. Also decreasing is the streamwise extent of the potential core itself, although most of its spatial domain (
 $x/D < 2$) remains dominated by the
 $f_f$ mode, with the regions downstream dominated by the
 $f_f/2$ mode (figure 7f). Crucially, the fact that regardless of whether the forcing is axial (figure 7b) or transverse (figure 7c), the decrease in
 $V_{rms}^{\prime }$ occurs spatially throughout most of the potential core, where the wavemaker is known to reside (Lesshafft et al. Reference Lesshafft, Huerre, Sagaut and Terracol2006; Qadri et al. Reference Qadri, Chandler and Juniper2018), confirms that our single-point HWA measurements are indeed a reliable indicator of the jet response.
To assess the symmetry of the vortical structures in the jet, we show in figures 7(g–i) the dominant spatial modes extracted via dynamic mode decomposition (DMD; Schmid Reference Schmid2010; Rowley & Dawson Reference Rowley and Dawson2017) of the in-plane velocity field ( $u,v$) measured with PIV. These DMD modes are dominant in the sense that their amplitudes are the highest in their respective spectra; they correspond to the
 $f_n$ mode in the unforced jet (figure 7g) and to the
 $f_f$ mode in both the purely axially forced jet (figure 7h) and the purely transversely forced jet (figure 7i). Superimposed over the DMD modes are contours of the out-of-plane vorticity fluctuation. In all three cases (figures 7g–i), the jet dynamics are periodic, either naturally or due to lock-in, with each DMD mode featuring a train of counter-rotating vortical structures advecting along the shear layers on both sides of the jet centreline.
In both the unforced jet (figure 7g) and the purely axially forced jet (figure 7h), the vortical structures are antisymmetric about the jet centreline, which is consistent with the presence of an  $m=0$ global mode. To quantify the phase shift between the left and right shear layers (
 $\varTheta$), we apply the Hilbert transform to instantaneous streamwise profiles of vorticity extracted at
 $y/D = \pm 0.5$, and then plot the data in figure 7(j) as a normalized histogram of
 $\varTheta$. We find that the histogram peaks at
 $\varTheta \approx 0$ for both the unforced and axially forced jets, confirming that the left and right shear layers are rolling up in phase with each other. This is the classic behaviour of an axisymmetric jet dominated by an
 $m=0$ global mode.
In the purely transversely forced jet (figure 7i), however, the vortical structures are no longer antisymmetric about the jet centreline. Instead, they roll up and advect out-of-phase by  ${\rm \pi} /2$ (figure 7j), producing a transverse flapping motion that breaks the axisymmetry of the
 $m=0$ global mode. Put together, these findings provide compelling evidence that axial forcing preserves the inherent axisymmetry of the jet, whereas transverse forcing breaks that axisymmetry by inducing the staggered roll-up of vortical structures in the shear layers. The latter effect will prove to be crucial in achieving asynchronous and synchronous quenching of the natural global mode, without amplification of the forced mode.
5.3. Bifurcation routes to lock-in
Having examined the spatial characteristics of the forced jet response, we now turn to identifying the bifurcations responsible for lock-in. We first consider the purely axially forced jet (§ 5.3.1, position  $\mathbb {A}$) so as to establish a calibrated baseline against the axial forcing experiments of Li & Juniper (Reference Li and Juniper2013a,Reference Li and Juniperc). We then compare this to the purely transversely forced jet (§ 5.3.2, position
 $\mathbb {E}$) so as to determine the effects of axisymmetry breaking. In the interest of brevity, we do not show results for combined axial–transverse forcing (positions
 $\mathbb {B}$,
 $\mathbb {C}$ and
 $\mathbb {D}$) because they are qualitatively similar to those for pure axial forcing (position
 $\mathbb {A}$). This is expected because all four of these jet positions (positions
 $\mathbb {A}$,
 $\mathbb {B}$,
 $\mathbb {C}$ and
 $\mathbb {D}$) are dominated by axial perturbations (
 $m=0$), with little to no contribution from transverse perturbations (
 $m=\pm 1$), as was shown in figure 3. For each type of forcing, we consider two representative values of
 $f_f$, one close to
 $f_n$ and one far from
 $f_n$. This is so that we can investigate the full range of synchronization dynamics around the
 $1:1$ Arnold tongue.
5.3.1. Axial forcing: the jet at position $\mathbb {A}$

Figure 8 shows the synchronization dynamics of the jet when forced axially at a frequency close to its natural global frequency:  $f_f/f_n = 1.04$. We consider the time trace, the PSD, the instantaneous phase difference between the forcing signal and the forced self-excited jet,
 $\Delta \phi _{f,\gamma }$, and the one-sided Poincaré map, all extracted from the
 $\gamma (t)$ signal. For comparison, we show in figure 9 the same indicators but for the axially forced model. In both systems, we increase the forcing amplitude incrementally until reaching the onset of lock-in, which occurs at
 $A \equiv a/a_{loc} = 1$ for the jet and at
 $B \equiv b/b_{loc} = 1$ for the model.
Synchronization dynamics of the jet when forced axially (position  $\mathbb {A}$) at a frequency close to its natural global frequency:
 $f_f/f_n=1.04$. The (a) time trace, (b) PSD, (c) temporal evolution of
 $\Delta \phi _{f,\gamma }$, and (d) one-sided Poincaré map are shown for nine forcing amplitudes, including the unforced case (
 $A=0$). Lock-in occurs via the phase-locking route, which involves a Neimark–Sacker bifurcation at
 $A = 0 \rightarrow 0.25$ followed by a saddle-node bifurcation at
 $A = 0.93 \rightarrow 1$. The unforced state is shown in green, the quasiperiodic states are shown in blue, and the onset of lock-in is shown in red.

The same as in figure 8 but for the axially forced model at  $\omega _f/\omega _n=1.04$.

When unforced (figure 8,  $A = 0$), the jet is hydrodynamically self-excited, exhibiting a nonlinear global mode at
 $f_n$ with progressively weaker components at the subharmonic and superharmonics (both odd and even; figures 8a,b). In the absence of forcing,
 $\Delta \phi _{f,\gamma }$ is undefined, so we plot in the bottom row of figure 8(c) the instantaneous phase evolution of the unforced jet,
 $-\phi _{\gamma }$, which is seen to drift continuously in time without phase slips. This behaviour is consistent with the absence of pronounced amplitude modulation in the time trace (figure 8a) (Pikovsky et al. Reference Pikovsky, Rosenblum and Kurths2003). In the Poincaré map (figure 8d), the intercepts of the phase trajectory are concentrated at a single spot, indicating the presence of a closed repetitive orbit in the phase portrait, a signature feature of a period-1 limit-cycle attractor.
When forced at intermediate amplitudes (figure 8,  $A = 0.25$–
 $0.93$), the jet becomes quasiperiodic. This is evidenced by the appearance of amplitude modulation in the time trace (figure 8a) and by the emergence of sharp peaks at both the forced (
 $f_f$) and natural (
 $f_n^\ast$) modes in the PSD (figure 8b). The values of
 $f_f$ and
 $f_n^\ast$ are incommensurable and, through the action of nonlinear resonant three-wave interactions (Schmid, Henningson & Jankowski Reference Schmid, Henningson and Jankowski2002), they generate a train of spectral peaks at linear combinations of
 $f_f$ and
 $f_n^\ast$. Quasiperiodicity is also demonstrated by
 $\Delta \phi _{f,\gamma }$ drifting unboundedly in time (figure 8c) and by the formation of a closed ring of trajectory intercepts in the Poincaré map (figure 8d). Taken together, these observations indicate that the jet has transitioned from a period-1 limit-cycle attractor to an ergodic two-dimensional torus attractor
 $\mathbb {T}^2$ via a Neimark–Sacker bifurcation at
 $A = 0 \rightarrow 0.25$ (Pikovsky et al. Reference Pikovsky, Rosenblum and Kurths2003; Balanov et al. Reference Balanov, Janson, Postnov and Sosnovtseva2009). Several other features are worth noting in this quasiperiodic regime. As
 $A$ increases, the natural mode at
 $f_n^\ast$ gradually shifts towards the forced mode at
 $f_f$, whose value is dictated by the external forcing and is thus fixed. This temporal adjustment process, known as frequency pulling in the synchronization literature, is a hallmark feature of the phase-locking route to lock-in (Pikovsky et al. Reference Pikovsky, Rosenblum and Kurths2003; Balanov et al. Reference Balanov, Janson, Postnov and Sosnovtseva2009). As for the phase difference (figure 8c), frequency pulling causes the time-averaged slope of
 $\Delta \phi _{f,\gamma }$, or
 $\langle {\Delta \dot {\phi }_{f,\gamma }}\rangle$, to approach zero gradually as
 $A$ increases. Physically, this implies that the time scale of the natural mode is adjusting to match that of the forced mode. This process occurs without significant changes in the oscillation amplitude (figure 8a). Consequently, lock-in along the phase-locking route occurs via adjustments in the frequency rather than in the amplitude, which is physically consistent with this route arising only when
 $f_f$ is sufficiently close to
 $f_n$. Another notable feature is that at relatively high forcing amplitudes (figure 8c,
 $A = 0.74$–
 $0.93$),
 $\Delta \phi _{f,\gamma }$ drifts increasingly nonlinearly, spending long epochs at nearly constant values and then dropping abruptly by one complete cycle of
 $2{\rm \pi}$ (see insets of figure 8c). In synchronization theory, the sudden loss or gain of an integer number of complete cycles is known as phase slipping and is another defining feature of the phase-locking route (Pikovsky et al. Reference Pikovsky, Rosenblum and Kurths2003). As
 $A$ increases towards the value required for lock-in (
 $A=1$), the time between successive phase slips increases. Physically, this implies that the jet is spending more and more time oscillating at
 $f_f$, with fewer phase slips. Meanwhile, the Poincaré map shows that the phase trajectory continues to wrap around the ergodic
 $\mathbb {T}^2$ torus attractor, whose scale grows monotonically as
 $A$ increases (figure 8d). This confirms that the jet is still oscillating quasiperiodically at two incommensurable frequencies.
When forced at a critical amplitude (figure 8,  $A = 1$), the jet transitions from
 $\mathbb {T}^2$ quasiperiodicity to
 $1:1$ lock-in: it now oscillates at only
 $f_f$ and its harmonics, with no sign of the original natural mode at
 $f_n^\ast$ (figure 8b). As a result, the time trace is no longer modulated (figure 8a), and
 $\Delta \phi _{f,\gamma }$ no longer drifts or slips but instead remains constant in time (figure 8c), indicating phase locking (Pikovsky et al. Reference Pikovsky, Rosenblum and Kurths2003). As expected, this transition from
 $\mathbb {T}^2$ quasiperiodicity to
 $1:1$ lock-in sees the ring structure in the Poincaré map replaced by a single cluster of trajectory intercepts, indicative of a period-1 orbit (figure 8d). Crucially, the collapse of the ring structure occurs suddenly rather than gradually (figure 8d,
 $A = 0.93 \rightarrow 1$). According to synchronization analyses of the forced VDP oscillator (Balanov et al. Reference Balanov, Janson, Postnov and Sosnovtseva2009), the suddenness of this collapse indicates that the
 $\mathbb {T}^2$ attractor is still alive but has become resonant through a saddle-node bifurcation. Consequently, a pair of periodic orbits – one stable orbit and one saddle orbit – is born on the resonant
 $\mathbb {T}^2$ surface, with lock-in occurring when the phase trajectory snaps on to the stable orbit. This synchronization mechanism, involving a saddle-node bifurcation and frequency pulling, is intrinsic to the phase-locking route to lock-in (Balanov et al. Reference Balanov, Janson, Postnov and Sosnovtseva2009).
As mentioned earlier, figure 9 shows the same four indicators as in figure 8 but for the axially forced model. We find that the model can reproduce qualitatively the main synchronization phenomena exhibited by the jet. These include: (i) a Neimark–Sacker bifurcation from a period-1 limit cycle to  $\mathbb {T}^2$ quasiperiodicity when axial forcing is first applied; (ii) amplitude modulation of the time trace, along with phase drifting and slipping during
 $\mathbb {T}^2$ quasiperiodicity; (iii) a gradual pulling of
 $f_n^\ast$ towards
 $f_f$ as the forcing amplitude increases, causing
 $\langle {\Delta \dot {\phi }_{f,\gamma }}\rangle$ to approach zero gradually; and (iv) a saddle-node bifurcation from
 $\mathbb {T}^2$ quasiperiodicity to
 $1:1$ lock-in at a critically high forcing amplitude. However, the model cannot reproduce the train of spectral peaks observed at and around the subharmonic and superharmonics of
 $f_n$. This is because the VDP kernel used in the model contains only cubic nonlinearity, thus generating only odd harmonics (Nayfeh & Mook Reference Nayfeh and Mook1995). Although incorporating other forms of nonlinearity may improve the comparison, doing so is not a priority here. Our primary aim is to use the simplest possible model to capture phenomenologically the most salient synchronization phenomena of the jet, such as its Arnold tongue, bifurcation routes to lock-in, phase dynamics, and oscillation quenching mechanisms.
Next we increase  $f_f$ so that it is far from
 $f_n$ (figure 10,
 $f_f/f_n = 1.17$). We find several important differences relative to the earlier case where
 $f_f$ is close to
 $f_n$ (figure 8,
 $f_f/f_n = 1.04$). In particular, lock-in now occurs not through a gradual pulling of
 $f_n^\ast$ towards
 $f_f$, but through a gradual reduction in the amplitude of the natural mode. This fundamental change in the synchronization mechanism can be seen in the PSD (figure 10b), where the frequency (
 $f_n^\ast$) of the spectral peak corresponding to the natural mode remains constant as
 $A$ increases. The difference can also be seen in the temporal evolution of the phase difference (figure 10c), where
 $\langle {\Delta \dot {\phi }_{f,\gamma }}\rangle$ remains constant as
 $A$ increases, until it eventually snaps to zero at the onset of phase trapping (
 $A=0.78$) (Aronson, Ermentrout & Kopell Reference Aronson, Ermentrout and Kopell1990; Thévenin et al. Reference Thévenin, Romanelli, Vallet, Brunel and Erneux2011).
Synchronization dynamics of the jet when forced axially (position  $\mathbb {A}$) at a frequency far from its natural global frequency:
 $f_f/f_n=1.17$. The (a) time trace, (b) PSD, (c) temporal evolution of
 $\Delta \phi _{f,\gamma }$, and (d) one-sided Poincaré map are shown for nine forcing amplitudes, including the unforced case (
 $A=0$). Lock-in occurs via the suppression route, which involves a Neimark–Sacker bifurcation at
 $A = 0 \rightarrow 0.18$ followed by an inverse Neimark–Sacker bifurcation at
 $A = 0.91 \rightarrow 1$. The unforced state is shown in green, the quasiperiodic states are shown in blue, and the onset of lock-in is shown in red.

As  $A$ increases from the onset of phase trapping, the ring structure in the Poincaré map shrinks gradually (figure 10d,
 $A = 0.78 \rightarrow 1$), indicating that the underlying
 $\mathbb {T}^2$ attractor is collapsing gradually to its death via an inverse Neimark–Sacker bifurcation (Balanov et al. Reference Balanov, Janson, Postnov and Sosnovtseva2009). This gradual collapse stands in stark contrast to the sudden collapse seen in figure 8(d), where the detuning is small. According to synchronization analyses of the forced VDP oscillator (Balanov et al. Reference Balanov, Janson, Postnov and Sosnovtseva2009), this difference is consistent with the jet locking into the forcing via the suppression route, rather than the phase-locking route. In other words, instead of adjusting its phase dynamics (i.e. advancement or retardation of its temporal rhythm) to match that of the forcing, the jet experiences a suppression of its natural amplitude dynamics (Pikovsky et al. Reference Pikovsky, Rosenblum and Kurths2003). Because in this example
 $f_f/f_n$ is sufficiently larger than 1, the suppression of the natural mode occurs without resonant amplification of the forced mode, resulting in the oscillation amplitude at lock-in (figure 10a,
 $A=1$) being lower than that in the unforced state (figure 10a,
 $A=0$). In synchronization theory, a suppression of the natural mode by non-resonant forcing is often referred to as asynchronous quenching (Bogoliubov & Mitropolsky Reference Bogoliubov and Mitropolsky1961; Minorsky Reference Minorsky1967, Reference Minorsky1974), which will be examined further in § 5.4.
For comparison, we show in figure 11 the same four indicators as in figure 10 but for the axially forced model. As is the case when  $f_f$ is close to
 $f_n$ (figures 8 and 9), we find that the model can reproduce qualitatively the main synchronization phenomena exhibited by the jet. Crucially, these include features specific to the suppression route to lock-in, such as: (i) a gradual reduction in the amplitude of the natural mode as
 $A$ increases, without a simultaneous pulling of
 $f_n^\ast$ towards
 $f_f$; (ii) a constant value of
 $\langle {\Delta \dot {\phi }_{f,\gamma }}\rangle$ followed by an abrupt snap to zero at the onset of phase trapping; and (iii) a gradual reduction in the size of the ring structure in the Poincaré map, indicating an inverse Neimark–Sacker bifurcation from
 $\mathbb {T}^2$ quasiperiodicity to
 $1:1$ lock-in at a critically high forcing amplitude.
The same as in figure 10 but for the axially forced model at  $\omega _f/\omega _n=1.17$.

In summary, we have investigated the forced synchronization of a prototypical hydrodynamic oscillator – a globally unstable low-density axisymmetric jet – located at the pressure antinode of a planar acoustic standing wave, where axial (symmetric,  $m=0$) perturbations were produced at different amplitudes and frequencies. We found that around the
 $1:1$ Arnold tongue, the jet exhibits a complex range of synchronization phenomena, such as: (i) phase drifting, slipping and trapping during quasiperiodicity on a
 $\mathbb {T}^2$ attractor at intermediate
 $A$ values; (ii) phase locking on a periodic orbit at critically high
 $A$ values; and (iii) two bifurcation routes to lock-in – the phase-locking route when the detuning is small, and the suppression route when the detuning is large. We then showed that these synchronization phenomena could be captured qualitatively by the simple VDP model proposed in § 3. These findings are broadly consistent with the experiments conducted by Li & Juniper (Reference Li and Juniper2013a,Reference Li and Juniperc) on a similar hydrodynamically self-excited jet forced axially from upstream with a loudspeaker mounted in the nozzle plenum. This further validates the present experimental methodology and data analysis, paving the way for an exploration of the effects of axisymmetry breaking via transverse forcing.
5.3.2. Transverse forcing: the jet at position $\mathbb {E}$

Figure 12 shows the synchronization dynamics of the jet when forced transversely at a frequency close to its natural global frequency:  $f_f/f_n = 1.04$. Comparing this with figure 8, we find that switching from axial to transverse forcing at small detuning leads to a dramatic change in the jet response. In particular, although the jet still transitions from unforced periodicity to
 $\mathbb {T}^2$ quasiperiodicity via a Neimark–Sacker bifurcation when forcing is first applied (figure 12,
 $A = 0 \rightarrow 0.14$), the subsequent transition to
 $1:1$ lock-in no longer occurs via a saddle-node bifurcation, as would be expected from figure 8 and from weakly nonlinear analyses of the classic (single-mode) VDP model when
 $f_f$ is close to
 $f_n$ (Pikovsky et al. Reference Pikovsky, Rosenblum and Kurths2003; Balanov et al. Reference Balanov, Janson, Postnov and Sosnovtseva2009). Instead, we find in figure 12 that as
 $A$ increases in the quasiperiodic regime, the frequency (
 $f_n^\ast$) of the natural mode remains constant but its amplitude decreases gradually, indicating asynchronous quenching without frequency pulling. In turn, this causes
 $\langle {\Delta \dot {\phi }_{f,\gamma }}\rangle$ to remain constant with increasing
 $A$, until it eventually snaps to zero at the onset of phase trapping (figure 12c,
 $A=0.92$). By tracking the ring structure in the Poincaré map (figure 12d), we find a gradual shrinkage of the
 $\mathbb {T}^2$ attractor en route to lock-in, providing evidence of an inverse Neimark–Sacker bifurcation (Balanov et al. Reference Balanov, Janson, Postnov and Sosnovtseva2009). Put together, these observations reveal that when its axisymmetry is broken via transverse forcing, the jet locks in via the suppression route, even when the detuning is small. This is strikingly different from the phase-locking route taken by the axially forced jet (figure 8). An intrinsic feature of the suppression route is a marked reduction in the oscillation amplitude en route to lock-in (Balanov et al. Reference Balanov, Janson, Postnov and Sosnovtseva2009). Here, such a reduction is indeed observed, both in the time trace (figure 12a) and in the synchronization map (figure 5). Figure 13 shows that the main synchronization phenomena exhibited by the transversely forced jet – such as the amplitude reduction, phase trapping, and suppression route to lock-in via an inverse Neimark–Sacker bifurcation – are well captured by the transversely forced model.
Synchronization dynamics of the jet when forced transversely (position  $\mathbb {E}$) at a frequency close to its natural global frequency:
 $f_f/f_n=1.04$. The (a) time trace, (b) PSD, (c) temporal evolution of
 $\Delta \phi _{f,\gamma }$, and (d) one-sided Poincaré map are shown for nine forcing amplitudes, including the unforced case (
 $A=0$). Lock-in occurs via the suppression route, which involves a Neimark–Sacker bifurcation at
 $A = 0 \rightarrow 0.14$ followed by an inverse Neimark–Sacker bifurcation at
 $A = 0.92 \rightarrow 1$. The unforced state is shown in green, the quasiperiodic states are shown in blue, and the onset of lock-in is shown in red.

The same as in figure 12 but for the transversely forced model at  $\omega _f/\omega _n=1.04$.

Next we increase  $f_f$ so that it is far from
 $f_n$ (figure 14,
 $f_f/f_n = 1.17$). We find that the jet responds qualitatively similarly to when
 $f_f$ is close to
 $f_n$ (figure 12,
 $f_f/f_n = 1.04$). Specifically, lock-in still occurs via the suppression route: (i) the natural mode becomes quenched without its frequency
 $f_n^\ast$ being pulled towards
 $f_f$; (ii) phase trapping occurs just before the onset of lock-in; and (iii) the
 $\mathbb {T}^2$ attractor shrinks gradually to its death via an inverse Neimark–Sacker bifurcation. For comparison, we show the corresponding model response in figure 15. As is the case for small detuning (figures 12 and 13), we find that the model can reproduce qualitatively the main synchronization phenomena exhibited by the jet, including the substantial reduction in the oscillation amplitude en route to lock-in (figure 15a).
Synchronization dynamics of the jet when forced transversely (position  $\mathbb {E}$) at a frequency far from its natural global frequency:
 $f_f/f_n=1.17$. The (a) time trace, (b) PSD, (c) temporal evolution of
 $\Delta \phi _{f,\gamma }$, and (d) one-sided Poincaré map are shown for nine forcing amplitudes, including the unforced case (
 $A=0$). Lock-in occurs via the suppression route, which involves a Neimark–Sacker bifurcation at
 $A = 0 \rightarrow 0.49$ followed by an inverse Neimark–Sacker bifurcation at
 $A = 0.95 \rightarrow 1$. The unforced state is shown in green, the quasiperiodic states are shown in blue, and the onset of lock-in is shown in red.

The same as in figure 14 but for the transversely forced model at  $\omega _f/\omega _n=1.17$.

5.4. Asynchronous quenching
In § 5.3.1, we showed that when forced axially, the jet locks in via the phase-locking route when the detuning is small, but via the suppression route when the detuning is large. In § 5.3.2, we showed that when forced transversely, the jet locks in exclusively via the suppression route, regardless of whether the detuning is small or large. According to synchronization theory based on a self-excited oscillator with a single natural mode (Balanov et al. Reference Balanov, Janson, Postnov and Sosnovtseva2009), only the suppression route can cause asynchronous quenching of the natural mode without resonant amplification of the forced mode. The findings of §§ 5.3.1 and 5.3.2 thus suggest that transverse forcing would be more effective than axial forcing in suppressing the global axisymmetric oscillations of a low-density jet. Below, we provide definitive evidence of this and show that, like most other synchronization phenomena observed in the jet, asynchronous quenching can be qualitatively reproduced by the coupled oscillator model of § 3.
Figure 16 shows the spectral power of the natural mode ( $P_n^{\prime \ast }$), of the forced mode (
 $P_f^{\prime \ast }$), and of the total
 $\gamma ^\prime$ signal (
 $P_t^{\prime \ast }$), all as functions of the forcing power (
 $A^2$) for both axial and transverse forcing. We consider two representative non-resonant values of
 $f_f$, one below
 $f_n$ (figure 16a,c,
 $f_f/f_n = 0.82$) and one above
 $f_n$ (figure 16b,d,
 $f_f/f_n = 1.17$). Both
 $f_f$ values are sufficiently far from
 $f_n$ for lock-in to occur via the suppression route (figure 5). We compute the spectral power by integrating the PSD around each respective mode (
 $\pm 5$ Hz) and then normalizing the result by the total power of the unforced system (
 $P_t^{\prime }$). We compute the total power by integrating the PSD across the entire bandwidth, with verification that it obeys Parseval's theorem, i.e. that it is equal (within
 $0.22\,\%$) to the mean squared fluctuation.
Evidence of asynchronous quenching in the jet: spectral power as a function of the forcing power for (a,b) axial forcing, and (c,d) transverse forcing. For both types of forcing, lock-in occurs via the suppression route. Two representative values of  $f_f$ are shown: (a,c) one below
 $f_n$, and (b,d) one above
 $f_n$.

5.4.1. Axial forcing: the jet at position $\mathbb {A}$

Figures 16(a,b) show that, regardless of whether  $f_f/f_n < 1$ or
 $f_f/f_n>1$, the axially forced jet undergoes a suppression of its natural mode en route to lock-in (grey shading). This is demonstrated by
 $P_n^{\prime \ast }$ decaying to zero as
 $A^2$ increases to 1 and beyond, providing clear evidence of asynchronous quenching (Bogoliubov & Mitropolsky Reference Bogoliubov and Mitropolsky1961; Minorsky Reference Minorsky1967, Reference Minorsky1974). Meanwhile,
 $P_f^{\prime \ast }$ increases, but in two different ways. When
 $f_f/f_n > 1$ (figure 16b),
 $P_f^{\prime \ast }$ increases linearly with
 $A^2$ up to and beyond lock-in. When
 $f_f/f_n < 1$ (figure 16a), however,
 $P_f^{\prime \ast }$ increases linearly at first but then nonlinearly at higher
 $A^2$ values, jumping sharply at the onset of lock-in (
 $A^2 = 1$). This accelerated growth in
 $P_f^{\prime \ast }$ is indicative of an amplification of the forced mode via nonlinear interactions with the natural mode (Odajima et al. Reference Odajima, Nishida and Hatta1974; Abel et al. Reference Abel, Ahnert and Bergweiler2009). Because here the forcing is non-resonant (figure 16a,
 $f_f/f_n = 0.82$), this phenomenon is referred to as non-resonant amplification (Nayfeh & Mook Reference Nayfeh and Mook1995). Such an amplification of the forced mode causes
 $P_t^{\prime \ast }$ to rise above that of the unforced system (
 $P_t^{\prime \ast }/P_t^{\prime } > 1$). Consequently, if the control objective is to suppress the global axisymmetric oscillations of a low-density jet using axial forcing, then it is not simply enough for
 $f_f$ to be sufficiently far from
 $f_n$ to activate the suppression route; one must also ensure that
 $f_f/f_n > 1$, as this enables asynchronous quenching to occur without resonant or non-resonant amplification en route to lock-in (figure 16b). If
 $f_f$ is somehow allowed to fall below
 $f_n$, then asynchronous quenching still occurs, but its effect is counteracted by non-resonant amplification of the forced mode, resulting in the total power increasing above that of the unforced system as lock-in is approached (figure 16a). We believe that this is the first time that asynchronous quenching has been observed alongside non-resonant amplification in a forced self-excited hydrodynamic system. As § 5.4.2 will confirm, this discovery provides a compelling incentive to consider axisymmetry breaking, via transverse forcing, as an alternative method of suppressing a nonlinear global mode.
Figures 17(a,b) show the spectral power of the axially forced model at the two forcing frequencies shown in figures 16(a,b):  $\omega _f/\omega _n = 0.82$ and
 $1.17$. For both values of
 $\omega _f/\omega _n$, the model can capture qualitatively the asynchronous quenching observed in the jet:
 $P_n^{\prime \ast }$ decays to zero as
 $B^2$ increases to 1 and beyond. However, the model cannot capture the non-resonant amplification of the forced mode, regardless of whether
 $\omega _f/\omega _n < 1$ or
 $\omega _f/\omega _n> 1$. Instead, it exhibits a proportional relationship between
 $P_f^{\prime \ast }$ and
 $B^2$, resulting in
 $P_t^{\prime \ast }$ remaining well below that of the unforced state en route to and at the onset of lock-in (
 $B^2 = 1$). The inability of the model to capture non-resonant amplification when the forcing frequency is below the natural frequency is why the asymmetry about
 $f_f/f_n = 1$ in the
 $\eta _{\gamma }$ data from the jet (figure 5) is absent in the
 $\eta _{x}$ data from the model (figure 6). Nevertheless, in both the jet and the model, continuing to increase the forcing amplitude (or forcing power) after lock-in eventually causes the total amplitude to rise above that of the unforced state (figure 5).
The same as in figure 16 but for the axially or transversely forced model.

5.4.2. Transverse forcing: the jet at position $\mathbb {E}$

Turning now to the transversely forced jet (figures 16c,d), we find that in some ways it behaves similarly to the axially forced jet (figures 16a,b). For example, for both  $f_f/f_n < 1$ (figure 16c) and
 $f_f/f_n > 1$ (figure 16d),
 $P_n^{\prime \ast }$ decays to zero as
 $A^2$ increases. As before, this is clear evidence of asynchronous quenching, consistent with the suppression route to lock-in. However, we find that
 $P_n^{\prime \ast }$ decays more rapidly here, indicating that transverse forcing is more effective than axial forcing in disrupting the natural global mode of the jet. Moreover, we find that
 $P_n^{\prime \ast }$ decays to negligible values well before
 $A^2$ reaches 1, implying that the onset of natural-mode suppression (
 $P_n^{\prime \ast } \approx 0$) precedes the onset of lock-in (
 $A^2 = 1$). This occurs because the onset of lock-in is defined as when the attractor topology changes from
 $\mathbb {T}^2$ to a periodic orbit. A strong subharmonic mode at
 $f_n^\ast /2$ (e.g. see figure 14b) can thus cause the jet to remain quasiperiodic, even when the fundamental mode at
 $f_n^\ast$ itself is relatively weak.
Another difference relative to the axially forced jet is that not only is  $P_f^{\prime \ast }$ not amplified but it does not even increase in proportion to
 $A^2$ (figures 16c,d). Instead, it remains negligible over the entire range of
 $A^2$. The complete absence of a response at
 $f_f$ is in stark contrast to the proportional increase (figure 16b) and the non-resonant amplification (figure 16a) seen in the axially forced jet. These differences suggest that the jet is more receptive to axial perturbations that reinforce the axisymmetry of its natural global mode (
 $m=0$) and is less receptive to transverse perturbations that break its axisymmetry (
 $m=\pm 1$), as expected from the helical hydrodynamic modes (
 $m=\pm 1$) being only globally stable. Given that
 $P_f^{\prime \ast } \approx 0$ over the entire range of
 $A^2$,
 $P_t^{\prime \ast }$ decays similarly to
 $P_n^{\prime \ast }$ for both
 $f_f/f_n < 1$ and
 $f_f/f_n> 1$ (figures 16c,d), implying that the overall jet oscillations are quenched well before the onset of lock-in.
Figures 17(c,d) show that the transversely forced model can capture qualitatively the spectral power characteristics of the transversely forced jet (figures 16c,d). This includes: (i) asynchronous quenching of the natural mode; (ii) the absence of any response at the forced mode; and (iii) quenching of the overall jet oscillations to a quiescent state.
5.5. Synchronous quenching
To examine the amplitude response at small detuning, we show in figure 18 the spectral power of the jet and of the model for a range of forcing frequencies, both close to and far from the natural frequency. The forcing is either axial or transverse, but always at a relatively low amplitude (see the caption of figure 18).
Evidence of synchronous quenching in (a,c) the jet, and (b,d) the model: spectral power as a function of the normalized forcing frequency for (a,b) axial forcing, and (c,d) transverse forcing. The forcing amplitude is (a)  $a = 0.998$ Pa, (b)
 $b = 0.019$, (c)
 $a = 1.320$ Pa, and (d)
 $b = 0.049$.

In the axially forced jet (figure 18a), we find that as  $f_f/f_n$ approaches 1 from either the low side or the high side,
 $P^{\prime \ast }_n$ decays to zero whilst
 $P^{\prime \ast }_f$ grows to a maximum. This indicates that synchronous quenching of the natural mode is occurring alongside resonant amplification of the forced mode (Keen & Fletcher Reference Keen and Fletcher1969; Odajima et al. Reference Odajima, Nishida and Hatta1974; Abel et al. Reference Abel, Ahnert and Bergweiler2009; Mondal et al. Reference Mondal, Pawar and Sujith2019). Here the degree of resonant amplification is strong enough to enable
 $P^{\prime \ast }_f$ to counterbalance the quenching of
 $P^{\prime \ast }_n$, resulting in
 $P^{\prime \ast }_t$ exceeding
 $P^{\prime }_t$ just below
 $f_f/f_n = 1$. In the axially forced model (figure 18b), we find the same qualitative behaviour involving the simultaneous occurrence of synchronous quenching and resonant amplification when
 $f_f/f_n$ is close to 1. Similar behaviour has been observed recently in self-excited thermoacoustic systems subjected to similar resonant forcing (Guan et al. Reference Guan, Gupta, Kashinath and Li2019a,Reference Guan, Gupta, Wan and Lib; Mondal et al. Reference Mondal, Pawar and Sujith2019). However, we believe that this is the first time that synchronous quenching has been observed alongside resonant amplification in a self-excited hydrodynamic system, reinforcing the universality of such synchronization phenomena in physically disparate systems.
In the transversely forced jet (figure 18c), we find markedly different behaviour: although synchronous quenching of the natural mode still occurs ( $P^{\prime \ast }_n \rightarrow 0$), the forced mode is not amplified to a degree sufficient to cause
 $P^{\prime \ast }_t$ to exceed
 $P^{\prime }_t$, implying the absence of resonant amplification. The same qualitative behaviour is observed in the transversely forced model (figure 18d). This demonstrates that synchronous quenching of the natural mode occurring without resonant amplification of the forced mode is the primary mechanism by which transverse forcing is able to reduce the overall response amplitude when
 $f_f$ is close to
 $f_n$.
6. Conclusions
In this study, we have adopted a forced synchronization framework to answer three research questions (§ 1.4) on the open-loop control of period-1 limit-cycle oscillations in a prototypical hydrodynamic oscillator, namely a globally unstable low-density axisymmetric jet.
(i) Can breaking the axisymmetry of the jet via transverse forcing lead to a more effective open-loop control strategy than preserving the axisymmetry via axial forcing?
We have shown experimentally that breaking the
$m=0$ axisymmetry of the nonlinear global mode of the jet, by applying transverse acoustic forcing (flapping perturbations), can cause lock-in to occur exclusively via the suppression route, regardless of whether $f_f$ is close to or far from $f_n$. This insensitivity to detuning enables both asynchronous and synchronous quenching of the natural mode to occur without resonant or non-resonant amplification of the forced mode. The result is a substantially greater reduction in the overall response amplitude across all tested values of $f_f/f_n$, as compared with the baseline case of axial forcing. This shows that simply switching from symmetric to asymmetric perturbations can lead to a more effective open-loop control strategy, in the sense that stronger amplitude suppression can be achieved without the need to worry about the exact detuning between $f_f$ and $f_n$.(ii) How do the synchronization phenomena – such as the bifurcation routes, Arnold tongues, and quenching mechanisms – differ between transverse and axial forcing?
We have shown experimentally that when applied at low
$A$, transverse forcing, like axial forcing, causes the jet to transition from a period-1 orbit on a limit-cycle attractor to $\mathbb {T}^2$ quasiperiodicity on a torus attractor via a Neimark–Sacker bifurcation. When $A$ increases, however, we find that the subsequent transition, from $\mathbb {T}^2$ quasiperiodicity to $1:1$ lock-in, depends on the spatial symmetry of the applied perturbations. Specifically, we find that axial forcing induces a saddle-node bifurcation at small detuning but an inverse Neimark–Sacker bifurcation at large detuning, whereas transverse forcing always induces an inverse Neimark–Sacker bifurcation irrespective of the detuning. Nevertheless, we find that the shape and position of the Arnold tongue remain similar for both types of forcing. This shows that although transverse and axial forcing are equally capable of causing lock-in, only transverse forcing can ensure that it occurs via the suppression route rather than the phase-locking route. It is partly through this specific route selection that transverse forcing can suppress the natural mode via synchronous quenching at small detuning and asynchronous quenching at large detuning, without ever incurring a significant amplification of the forcing signal.(iii) Can these synchronization phenomena be modelled phenomenologically with a low-dimensional system based simply on a pair of coupled VDP oscillators?
We have shown that the main synchronization phenomena exhibited by the jet can be modelled qualitatively with just two generic VDP oscillators coupled to each other and forced externally by sinusoidal terms. The success of such a simple low-dimensional model in capturing the complex nonlinear dynamics of a multi-modal hydrodynamic system opens up the possibility that, with further development, such a model could be used to explore the forced synchronization of other hydrodynamically self-excited flows subjected to axisymmetric and non-axisymmetric mode excitation. As well as offering new insight into the interactions between different hydrodynamic and acoustic modes, this could facilitate the discovery of novel control strategies for the suppression of nonlinear global modes.


Regarding future work, one aspect that deserves further attention is the asymmetry in  $\eta _{\gamma }$ about
 $f_f/f_n = 1$, which was detected in the axially forced jet (figure 5). We believe that this asymmetry may be due to the different spatial-mode structures generated at different values of
 $f_f$, with higher frequency modes experiencing stronger viscous damping and thus stronger amplitude attenuation. One of our next steps is to explore this further by extending the present temporal analysis to a spatiotemporal analysis involving a more detailed modal decomposition of the PIV images and low-order modelling via the Ginzburg–Landau equation.
Funding
This work was supported by the Research Grants Council of Hong Kong (grant nos 16210418, 16210419 and 16200220) and the Guangdong–Hong-Kong–Macao Joint Laboratory for Data-Driven Fluid Mechanics and Engineering Applications (project no. 2020B1212030001). VG was supported by the National Natural Science Foundation of China (grant nos 91752201, 12002147 and 12050410247), the Department of Science and Technology of Guangdong Province (grant nos 2019B21203001 and 2020B1212030001), and the Key Special Project for Introduced Talents Team of Southern Marine Science and Engineering Guangdong Laboratory, Guangzhou (grant no. GML2019ZD0103).
Declaration of interests
The authors report no conflict of interest.
Appendix A. Nonlinear time series analysis
Forced synchronization is an inherently nonlinear process (Pikovsky et al. Reference Pikovsky, Rosenblum and Kurths2003; Balanov et al. Reference Balanov, Janson, Postnov and Sosnovtseva2009). As such, it is often studied in phase space (i.e. state space) using methods from nonlinear time series analysis (Kantz & Schreiber Reference Kantz and Schreiber2003). In general, the phase space of a continuous dynamical system is a  $Q$-dimensional hyperspace in which all
 $Q$ state variables reside. Within this hyperspace, the temporal evolution of the system is represented by its phase trajectory, whose characteristics can reveal useful information about the topology of the dominant attractors. In most real-world systems, however, it is difficult to determine the phase space directly because not all of its state variables are known or accessible. Nevertheless, owing to intrinsic coupling between different state variables, it is possible to reconstruct the phase space from only a single scalar observation function, by using the time-delay embedding theorem of Takens (Reference Takens1981). Here we use this theorem to reconstruct the dominant attractors as a Euclidean vector of time-delayed elements of dimension
 $q$:
 \begin{equation} \boldsymbol{\xi}(t) = [\gamma^{\prime}(t),\gamma^{\prime}(t-\tau),\gamma^{\prime}(t-2\tau),\ldots, \gamma^{\prime}(t-(q-1)\tau)], \quad \boldsymbol{\xi} \in \mathbb{R}^q, \end{equation}
where  $\gamma ^\prime$ is the velocity fluctuation in the jet (this is replaced by
 $x^\prime$ in the model of § 3),
 $\tau$ is the embedding time delay, and
 $q$ is the embedding dimension. We set the value of
 $\tau$ to be the time taken by the average mutual information function to attain its first local minimum (Fraser & Swinney Reference Fraser and Swinney1986). This ensures that the time-delayed vector elements are optimally decorrelated such that the attractors unfold maximally in the embedding space, enabling their fine structures to be identified readily (Kantz & Schreiber Reference Kantz and Schreiber2003). We determine the minimum value of
 $q$ using the algorithm of Cao (Reference Cao1997). After reconstructing the phase space, we visualize the attractors within it in two ways: (i) via the three-dimensional phase portrait; and (ii) via a two-dimensional slice through the phase portrait, which is known as the Poincaré map (Kantz & Schreiber Reference Kantz and Schreiber2003).


 Open access

