Introduction
Owing to their high mobility within the Earth’s crust, magmatic volatiles act as efficient indicators of magmatic rising and offer the scientific community working within volcano monitoring effective tools to reduce the uncertainty inherent in the precursory signals of episodes of volcanic unrest. Measurement of volcanic gas emissions aids the evaluation of the state of a volcano, and also provides an early warning of eruption because significant changes are observed in the chemical composition and/or the fluxes of the volcanic gases emitted before an eruption (Hernández et al. Reference Hernández, Notsu, Salazar, Mori, Natale, Okada, Virgili, Shimoike, Sato and Pérez2001, Aiuppa et al. Reference Aiuppa, Federico, Giudice, Giuffrida, Guida, Gurrieri, Liuzzo, Moretti and Papale2009). In recent decades, the development of theoretical models and the application of analytical instrumentation in volcanic gas geochemistry have contributed greatly to multidisciplinary volcano monitoring techniques. Within the geochemical methods used in volcano monitoring, diffuse degassing studies have revealed that volcanoes release large amounts of gas in a non-visible, diffuse degassing form, during both repose and active periods (Hernández et al. Reference Hernández, Notsu, Salazar, Mori, Natale, Okada, Virgili, Shimoike, Sato and Pérez2001, Chiodini et al. Reference Chiodini, Caliro, Cardellini, Avino, Granieri and Schmidt2008, Burton et al. Reference Burton, Sawyer and Granieri2013). CO2 has been the most studied species in diffuse emissions because of its low solubility in silicate melts (Pan et al. Reference Pan, Holloway and Hervig1991), and among volcanic gases, it is a major component after water vapour, acting as an effective tracer of subsurface endogenous degassing (Gerlach & Graeber Reference Gerlach and Graeber1985). Diffuse emission studies of other non-reactive and/or highly mobile gases, such as He, have recently provided promising results in the detection of changes in magmatic gas components at the surface related to episodes of volcanic unrest (Padrón et al. Reference Padrón, Pérez, Hernández, Sumino, Melián, Barrancos, Nolasco, Padilla, Dionis, Rodríguez, Hernández, Calvo, Peraza and Nagao2013). Furthermore, the isotopic composition of He (3He/4He ratio) is a ubiquitous signal of mantle-derived fluids and has been used historically as an excellent indicator of deep magma injections (Graham Reference Graham2002).
Discrete surveys of diffuse degassing of volcanic gas covering large areas of the volcano have provided important precursory increases of the emission rate prior to volcanic eruption or accompanying injection of fresh magma into volcanic systems (Hernández et al. Reference Hernández, Notsu, Salazar, Mori, Natale, Okada, Virgili, Shimoike, Sato and Pérez2001, Arpa et al. Reference Arpa, Hernández, Padrón, Reniva, Padilla, Bariso, Melián, Barrancos, Nolasco, Calvo, Pérez and Solidum2013, Padrón et al. Reference Padrón, Pérez, Hernández, Sumino, Melián, Barrancos, Nolasco, Padilla, Dionis, Rodríguez, Hernández, Calvo, Peraza and Nagao2013). As a complementary and important part of diffuse degassing studies, continuous monitoring of diffuse CO2 emissions in active volcanic areas have provided an effective tool to investigate the dynamics of magma supply (Carapezza et al. Reference Carapezza, Inguaggiato, Brusca and Longo2004, Pérez et al. Reference Pérez, Padilla, Padrón, Hernández, Melián, Barrancos, Dionis, Nolasco, Rodríguez, Calvo and Hernández2012, De Gregorio et al. Reference De Gregorio, Camarda, Gurrieri and Favara2014). This technique is based on hourly or half-hourly measurements of the diffuse CO2 emission rate by automatic stations in a static site, most commonly following the accumulation chamber method (Parkinson Reference Parkinson1981), during both repose and active periods. Evidence linking diffuse CO2 emissions and seismicity, mainly as precursory increases of diffuse CO2 emissions prior to seismic events, suggest that such monitoring could be a potential geochemical tool for earthquake research (Salazar et al. Reference Salazar, Pérez, Hernández, Soriano, Barahona, Olmos, Cartagena, López, Lima, Melián, Galindo, Padrón, Sumino and Notsu2002, Padrón et al. Reference Padrón, Melián, Marrero, Nolasco, Barrancos, Padilla, Hernández and Pérez2008, Padilla et al. Reference Padilla, Hernández, Pérez, Pereda, Padrón, Melián, Barrancos, Rodríguez, Dionis, Calvo, Herrera, Strauch and Muñoz2013). Salazar et al. (Reference Salazar, Pérez, Hernández, Soriano, Barahona, Olmos, Cartagena, López, Lima, Melián, Galindo, Padrón, Sumino and Notsu2002) reported anomalous increases in diffuse CO2 emissions days before a 5.1 magnitude earthquake and co-seismic emission changes related to a seismic swarm beneath San Vicente volcano, El Salvador. In a similar geotectonic environment, Padilla et al. (Reference Padilla, Hernández, Pérez, Pereda, Padrón, Melián, Barrancos, Rodríguez, Dionis, Calvo, Herrera, Strauch and Muñoz2013) observed anomalous changes in diffuse CO2 emissions in Masaya caldera (Nicaragua) related to two seismic events that occurred several kilometres from the observation site. In a different tectonic environment, Padrón et al. (Reference Padrón, Melián, Marrero, Nolasco, Barrancos, Padilla, Hernández and Pérez2008) measured significant increases at an automatic diffuse CO2 station hours before various seismic events, which occurred around El Hierro, Canary Islands. These precursory diffuse CO2 increases are probably caused by the intrusion of fluid and its migration through porous rock that may initiate changes in pore pressure and trigger the seismicity (Salazar et al. Reference Salazar, Pérez, Hernández, Soriano, Barahona, Olmos, Cartagena, López, Lima, Melián, Galindo, Padrón, Sumino and Notsu2002, Padrón et al. Reference Padrón, Melián, Marrero, Nolasco, Barrancos, Padilla, Hernández and Pérez2008). Furthermore, they suggest that terrestrial fluids may play an important role in the generation of earthquakes.
The main motivation for this work was to provide a multidisciplinary vision for the volcano monitoring at Deception Island volcano through the installation of the first automatic geochemical station designed for continuous monitoring of CO2 emissions. This research was expected to strengthen and complete the efforts made by mainly Spanish and Argentine volcanologists who have sporadically monitored the seismic activity and gases at Deception Island. Diffuse degassing studies are particularly useful for monitoring the seismo-volcanic activity of Deception Island volcano, since the biogenic contribution to the CO2 effluxes is almost negligible. We also wanted to test the geochemical station in the extreme weather conditions of the Antarctic climate. Here, we present the first detailed analysis of the CO2 diffuse degassing time series from Deception Island volcano during an episode of seismic unrest. The continuous monitoring of CO2 and the elemental and isotopic composition of noble gases in the main hydrothermal discharge were used to infer the source of the seismicity and its relationship with the seismic-volcanic activity at Deception volcano.
Geological settings
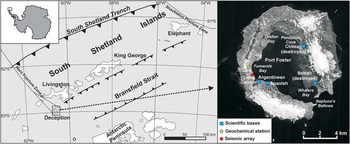
Deception Island (62°57'S, 60°38'W) is an almost circular volcanic island and the most active volcano situated in Bransfield Basin between the Antarctic Peninsula and the South Shetland Islands (Fig. 1) (Smellie Reference Smellie2001). Deception Island rises ~1400 m from the seafloor and forms the rim of a volcano crater that encircles a bay known as Port Foster, a 190 m deep caldera filled by sea water, which occupies the central part of the caldera. The caldera was formed during a massive emptying of a shallow magma chamber that caused the collapse of a ~640 m high volcano (Martí et al. Reference Martí, Geyer and Aguirre-Diaz2013, Torrecillas et al. Reference Torrecillas, Berrocoso, Felpeto, Torrecillas and García2013). It has a maximum height of 540 m a.s.l. and is open to the sea through a narrow (230 m) entrance called Neptune’s Bellows (Fig. 1). Faults that have originated from regional tectonics have controlled highly explosive and hydrovolcanic post-caldera eruptions at low elevations and less explosive eruptions at higher elevations (Smellie Reference Smellie2001, Martí et al. Reference Martí, Geyer and Aguirre-Diaz2013). Zandomeneghi et al. (Reference Zandomeneghi, Barclay, Almendros, Godoy, Wilcock and Ben-Zvi2009) and Pedrera et al. (Reference Pedrera, Ruiz-Constán, Heredia, Galindo-Zaldívar, Bohoyo, Marín-Lechado, Ruano and Somoza2012) have reported the presence of an extensive magma chamber that extends downward from ~2 km beneath Port Foster. Prudencio et al. (Reference Prudencio, De Siena, Ibáñez, Del Pezzo, García-Yeguas and Díaz-Moreno2015) suggest the presence of sedimentary and volcanoclastic deposits, hydrothermal interactions and highly fractured materials in the first 2 km beneath the centre of the island. According to these authors, the deeper structure of Deception volcano is complex because of hydrothermal system effects and the existence of a partially molten magmatic body. Kusakabe et al. (Reference Kusakabe, Nagao, Ohba, Seo, Park, Lee and Park2009) reported that magma emplaced beneath the island was derived from a wedge mantle geochemically similar to mid-ocean ridge basalt (MORB) that is contaminated by a slab that is subducting beneath the Bransfield back-arc basin. Evidence of hydrothermal activity is present at the surface of the volcano as fumaroles and hot spring waters in several locations, which represent the shallow part of a hydrothermal system with subsurface temperatures in the range of 150–300°C (Kusakabe et al. Reference Kusakabe, Nagao, Ohba, Seo, Park, Lee and Park2009). The most obvious hydrothermal discharges in Deception are low temperature (~100°C) fumaroles present in the Fumarole Bay area, with a CO2/H2O ratio of ~0.16 and H2S as the main sulphur species (~0.18 mol.%) (Caselli et al. Reference Caselli, Badi, Bonatto, Bengoa, Agusto, Bidone and Ibáñez2007). Intense seismic swarms occasionally shake Deception Island (Carmona et al. Reference Carmona, Almendros, Serrano, Stich and Ibáñez2012). The seismic activity of Deception volcano includes long-period (LP) events, volcanic tremor episodes and volcano-tectonic earthquakes. Several periods of intense LP activity have been registered in summer field surveys at Deception volcano, the last one reported during December 2009–January 2010 (Carmona et al. Reference Carmona, Almendros, Serrano, Stich and Ibáñez2012). The LP events are generally low-amplitude signals linked to alterations in the shallow hydrothermal system (Ibáñez et al. Reference Ibáñez, Carmona, Almendros, Saccorotti, Del Pezzo, Abril and Ortiz2003, Carmona et al. Reference Carmona, Almendros, Serrano, Stich and Ibáñez2012).
Geographical location of Deception Island in the South Shetlands Islands archipelago and an orthophotomap of Deception Island (http://lagc.uca.es/web_lagc/orto.jpg). The yellow star and red circle indicate the locations of the automatic geochemical station and seismic array, respectively.

Methods
On 7 December 2009, an automatic geochemical station (West Systems, Italy) was installed at Fumarole Bay (62°58.119'S, 60°42.622'W; Fig. 1), where the most obvious geothermal manifestations occur, and was operational until 13 February 2010. The volcano-hydrothermal gas discharges at Fumarole Bay area were evidenced by the presence of several steaming ground areas near the shoreline. Less intense steaming ground was also present on Whalers Bay beach during the study period. The installation site was selected ~50 m from the shoreline, following a small diffuse CO2 efflux survey in the Fumarole Bay beach area. A mechanical arm automatically placed a chamber over the ground every hour, and the diffuse CO2 efflux was measured according to the accumulation chamber method (Parkinson Reference Parkinson1981). Additionally, to avoid a possible influence of external parameters from endogenous CO2 emissions, soil water content and temperature at a depth of 40 cm and atmospheric parameters (wind speed and direction, air temperature and humidity, rainfall, and barometric pressure 1m above the ground) were recorded simultaneously. A double-beam infrared gas detector (Dräger Polytron IR CO2) was used to monitor CO2, with a solid state sensor to compensate for temperature. All data were stored on an SD memory card. Additionally, concentrations of He and Ar, and their isotopic composition (3He/4He, 4He/20Ne, 40Ar/36Ar), were analysed in the gases discharged by the fumaroles at Fumarole Bay, in a bubbling spring on the beach near the shoreline and in hot spring water sampled on the beach in Whalers Bay. In all cases, a funnel was inverted over the fumarole, bubbling or hot spring area channelling and obligating the gas or water/gas mixture to flow through lead-glass bottles using a double-mouth syringe connected to the other end of the bottle. He and Ar compositions and isotope analysis were carried out following the method described by Sumino et al. (Reference Sumino, Notsu and Nagao2001). Air standards were measured frequently during analyses to determine sensitivities of the mass spectrometer. The correction factor for He isotope ratios was determined by measurement of an inter-laboratory He standard (HESJ) with a recommended 3He/4He ratio of 20.63±0.10 times the atmospheric 3He/4He ratio (RA) (Matsuda et al. Reference Matsuda, Matsumoto, Sumino, Nagao, Yamamoto, Miura, Kaneoka, Takahata and Sano2002) (RA=1.384×10⁻⁶, Clarke et al. Reference Clarke, Jenkins and Top1976). Non-atmospheric 40Ar* was calculated by correcting the measured 40Ar/36Ar value for atmospheric contamination assuming that all 36Ar originates from the atmosphere (Porcelli & Ballentine Reference Porcelli and Ballentine2002). The 4He and 40Ar* concentrations in the hydrothermal discharges were compared with data from 2006 reported by Kusakabe et al. (Reference Kusakabe, Nagao, Ohba, Seo, Park, Lee and Park2009). In 2006, 4He and 40Ar* concentrations were within the range of 0.3–16.5 ppm and 0.5–5.5 ppm, respectively.
During the study period, a seismic array was deployed in Fumarole Bay close to the geochemical station (Fig. 1) as part of a long-term seismo-volcanic monitoring project at Deception Island operated by University of Granada, Spain (Carmona et al. Reference Carmona, Almendros, Serrano, Stich and Ibáñez2012, Carmona et al. Reference Carmona, Almendros, Martín, Cortés, Alguacil, Moreno, Martín, Martos, Serrano, Stich and Ibáñez2014). It was composed of eight short-period, vertical-component seismometers, connected to a 24-bit data acquisition system sampling at 100 sps. The array aperture was ~200 m. The analysis of seismic array data was used to distinguish different sources of LP activity. The analysis used the waveform similarity at nearby stations to determine the propagation characteristics of the seismic wavefronts. The low amplitudes of the LP events prevent their location or analysis using conventional network techniques. The analysis was based on the estimate of the apparent slowness vectors of the wavefronts propagating across the array (Goldstein & Chouet Reference Goldstein and Chouet1994, Almendros et al. Reference Almendros, Chouet and Dawson2001). The apparent slowness is a horizontal vector whose magnitude is the inverse of the apparent velocity and direction represents the propagation azimuth of the seismic waves. Apparent velocity is related to source depth; therefore, the apparent slowness vector contains information about the source back-azimuth and depth. The zero-lag cross-correlation method was used to obtain estimates of the apparent slowness vectors of the seismic wavefield (Frankel et al. Reference Frankel, Hough, Friberg and Busby1991, Almendros et al. Reference Almendros, Ibanez, Alguacil and Del Pezzo1999). The seismograms were filtered in the 2–6 Hz band and a moving window of 1 s advancing 0.25 s each step was used. Only estimates with a maximum average cross-correlation >0.7 (which is more than twice the seismic noise correlation) were considered in this analysis.
Results
Geochemistry
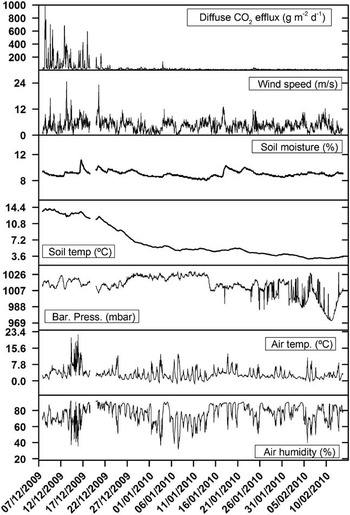
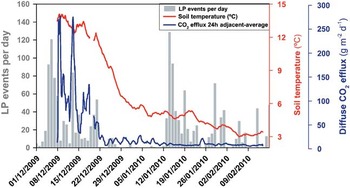
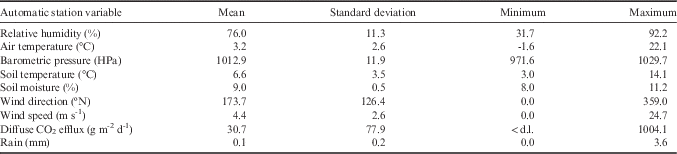
A time series of 1601 observations of diffuse CO2 and atmospheric and soil variables were recorded at the automatic station between 7 December 2009 and 13 February 2010 (Fig. 2). Table I shows a descriptive summary of the parameters measured during the study period. Throughout the time series, the observed CO2 efflux values ranged from non-detectable (<1 g m-2 d-1) up to 1004.1 g m-2 d-1 with an average of 30.7 g m-2 d-1. The time series depicted two different behaviours or periods (Fig. 3). In the first period, from the beginning of the observation time to the end of December 2009, soil CO2 efflux was characterized by high variance (15 274 g m-2 d-1) and showed a median of 69.6 g m-2 d-1. The second period, which corresponded to the remaining study period, was characterized by a much lower variance (53.8 g m-2 d-1) and a median of 10.3 g m-2 d-1. During the first period, the CO2 emission reached the highest values of the time series, especially on 8 December when the maximum value was measured (Fig. 3). Another significant characteristic observed in the recorded variables was the descending trend in the soil temperature. The maximum soil temperature (14.1°C) was measured on 8 December, concurrently to maximum CO2 efflux, and decreased gradually until it reached the minimum value (~3.0°C) in mid-February (Fig. 3).
Time series of the parameters recorded by the automatic geochemical station at Fumarole Bay.

Time series of soil temperature and 24 hour adjacent average of diffuse CO2 emissions measured by the automatic geochemical station at Fumarole Bay, and the daily LP events reported by Carmona et al. (Reference Carmona, Almendros, Serrano, Stich and Ibáñez2012).

Summary of the parameters recorded by the automatic geochemical station at Fumarole Bay, 7 December 2009 to 13 February 2010

<d.l.: below the detection limit of the instrument.
Table II shows elemental and isotopic compositions of He and Ar in thermal fluids from fumarolic and bubbling gas in Fumarole Bay and a hot spring in Whalers Bay. The 3He/4He ratios were very similar between samples: 7.48±0.11, 7.50±0.12 and 7.14±0.10 RA for the two fumaroles and the bubbling area, respectively, in Fumarole Bay, and 7.30±0.17 RA for the hot spring water in Whalers Bay. Samples were almost free of atmospheric contamination based on the high 4He/20Ne values measured: 1240, 375, 123 and 57, respectively (Table II). Average 4He and 40Ar* concentrations in the hydrothermal discharges were ~50 ppm and 8.6 ppm, respectively. These concentrations were increased relative to data collected in 2006.
Elemental and isotopic compositions of He and Ar in thermal fluids from Deception Island.

# Units for concentrations in water samples: ccSTP gH2O-1.
* Non-atmospheric 40Ar, calculated assuming that all 36Ar is atmospheric in origin (Porcelli & Ballentine Reference Porcelli and Ballentine2002).
Seismicity
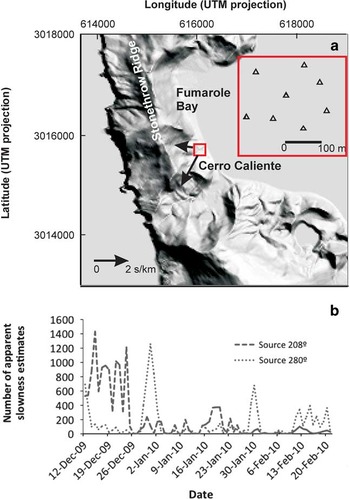
The results of the time series of the apparent slowness, back-azimuth and maximum average cross-correlation of the seismic array data showed at least two dominant apparent slowness vector solutions. The first solution of the seismic array data was very well defined, and was characterized by an apparent slowness of 2.2±0.1 s km-1 and a back-azimuth of 208±3°N. The large apparent slowness indicates a very shallow source. The direction to the source pointed to the Cerro Caliente area (Fig. 4a). The second solution had apparent slowness of 0.9±0.3 s km-1 and a back-azimuth of ~280±30°N. The moderate apparent slowness suggests a slightly deeper source, although it could also originate from a shallow but distant source. The direction of the second source pointed to the Stonethrow Ridge (Fig. 4a). Figure 4b shows the temporal distribution of high-quality apparent slowness estimates for the two solutions. The first source was most active during December 2009, with lower peaks of activity in the following months (e.g. 18–20 January). In contrast, the second source acted intermittently, with noteworthy peaks on 12 December, 29 December to 2 January, 29–31 January and 11–20 February.
a. Map of the Fumarole Bay area, showing the dominant apparent slowness vectors identified in the seismic array analysis. The vectors have been reversed to indicate the directions of the sources. The sizes of the arrows are proportional to the apparent slowness. Red inset shows the configuration of the seismic array. b. Daily number of high-quality apparent slowness estimates with maximum average cross-correlations >0.7 for the two dominant sources.

Discussion
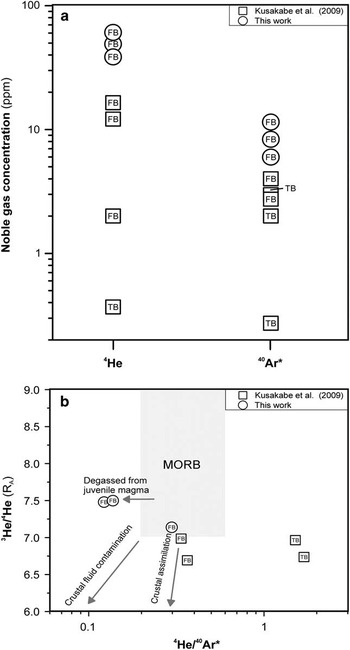
The observed descending trend in soil temperature and diffuse CO2 emissions did not appear to be driven by either atmospheric temperature or other meteorological factors because these variables did not show the same behaviour during the studied period (Fig. 2). Therefore, the excellent correlation between the CO2 efflux and soil temperature time series suggests that the soil was heated by the condensation of H2O gas moving from a volcano-hydrothermal reservoir that released mainly CO2 and H2O. The amount of hydrothermal gases released in the Fumarole Bay area was higher at the beginning and gradually decreased over the study period. The observed 3He/4He ratios in the samples from Fumarole and Whalers bays (7.14–7.50 RA) are within the canonical MORB range (8±1 RA; Graham Reference Graham2002) and confirm a predominant contribution of He of mantle origin. The values are ~0.5 RA higher than those measured in December 2006 by Kusakabe et al. Reference Kusakabe, Nagao, Ohba, Seo, Park, Lee and Park2009 during a seismic quiescence period (Carmona et al. Reference Carmona, Almendros, Serrano, Stich and Ibáñez2012), which were in the range of 6.69–6.99 RA. This represents a significant increase in magmatic He emissions and suggests the occurrence of a deep magmatic intrusion that has affected the volcano-hydrothermal system of Deception Island volcano since December 2006.
The observed increase in the 4He and 40Ar* concentrations in the hydrothermal discharge from Fumarole Bay, with respect to the values measured in 2006, also supports the injection of magmatic gases into the hydrothermal system that feeds the fumaroles in Fumarole Bay. The 4He and 40Ar* content of the fumaroles exceeded ~3.5 and ~2.2 times, respectively, the values measured in 2006 by Kusakabe et al. (Reference Kusakabe, Nagao, Ohba, Seo, Park, Lee and Park2009) (Fig. 5a). Figure 5b depicts the 3He/4He ratios versus 40Ar*/4He ratios measured in 2006 (Kusakabe et al. Reference Kusakabe, Nagao, Ohba, Seo, Park, Lee and Park2009) and 2009. The 40Ar*/4He ratio in fumarole gas is one of the most sensitive indicators of magmatic degassing because the solubility of He and Ar in silicate melts differ by more than one order of magnitude (Yamamoto & Burnard Reference Yamamoto and Burnard2005). We have assumed an end-member of MORB-source-like magma with 3He/4He=8±1 RA and 40Ar*/4He ~0.2–0.6 (Graham Reference Graham2002). The 3He/4He increase associated with an 40Ar*/4He decrease between 2006 and 2009 cannot be explained by permeability change in the shallow hydrothermal system, in which the ratio of magmatic to crustal He slightly increased, because the trend shown in Fig. 5b is not a simple mixing between magmatic and crustal fluids. This increase has to be attributed to a new injection of magmatic gases into the hydrothermal system caused by deep intrusion of less-degassed magma. The lower 3He/4He values measured in the Fumarole Bay fumaroles in 2006 with higher 40Ar*/4He values would originate from old magma with lowered 3He/4He by crustal assimilation. Due to the short timescale, the effect of crustal assimilation of the new magma intruded in 2009 had not been observed. The different 40Ar*/4He ratios between 2006 and 2009 in Fumarole Bay can be attributed to different 40Ar*/4He of the magma source. The 40Ar*/4He ratio from the bubbling gas was higher than from the fumaroles. This ratio in bubbling gas may have been modified by multiple-stage solubility-controlled fractionation during migration in seawater. When magmatic gas is dissolved in unsaturated seawater, the 40Ar*/4He ratio of the water is higher than the original ratio of magmatic gas because Ar is more soluble than He in water. When a bubble separates from the water, it acquires to some extent the 40Ar*/4He water ratio. Since this process cannot explain the significantly lower 3He/4He ratio in the bubbling gas sampled on the beach at Fumarole Bay. The bubbling gas may be a mixture of magmatic gas, which has similar 3He/4He and 40Ar*/4He ratios to the fumaroles, and crustal gas, and may have experienced solubility-controlled fractionation during dissolution and separation.
a. 4He and 40Ar* content in the Fumarole Bay fumarolic and bubbling gases (FB) and Telefon Bay bubbling gas (TB). b. 3He/4He versus 4He/40Ar* plot of the Fumarole Bay fumarolic gases (FB) and Telefon Bay bubbling gases (TB). Samples collected in December 2009 (circles, this work) and December 2006 (squares, Kusakabe et al. Reference Kusakabe, Nagao, Ohba, Seo, Park, Lee and Park2009).

Carmona et al. (Reference Carmona, Almendros, Serrano, Stich and Ibáñez2012) reported significant LP dominant seismicity between December 2009 and February 2010 indicating the activation of a new source of seismicity with smaller dimensions or different fluid properties. The time series of LP events per day are depicted in Fig. 3 as vertical bars, and show two different temporal clusters. The first event showed an excellent temporal agreement with the diffuse CO2 emissions and soil temperature time series recorded in the geochemical station. The absence of such a temporal correlation with the second LP seismicity cluster recorded in January 2010 suggests a different source for seismicity. This hypothesis was postulated after the analysis of the geochemical data and was supported by information obtained by the seismic array. The good temporal agreement between the diffuse CO2 emissions, soil temperature and LP seismicity exclude other possible mechanisms to explain the LP events.
The LP seismicity observed in the seismic array data had the same characteristics (waveform, duration, frequency) throughout the study period suggesting a similar mechanism for the two sources. The high apparent slowness of the vector solutions indicates a very shallow source, but it was not possible to know how far away the sources are from each other. Large apparent slowness has been measured previously for LP seismicity at Deception Island (e.g. ~2 s km-1 in Ibáñez et al. Reference Ibáñez, Del Pezzo, Almendros, La Rocca, Alguacil, Ortiz and García2000). The circulation of hot fluids through cracks and fissures within a highly fractured medium may account for the generation of both LP temporal clusters. Our results indicate that during the first LP cluster this anomalous hot fluid leakage occurred mainly from the hydrothermal system that feeds the Fumarole Bay fumaroles. The second source of LP seismicity probably had the same origin and affected a second hydrothermal system distant from Fumarole Bay in the direction of Stonethrow Ridge.
Conclusions
Analysis of the continuous monitoring of diffuse CO2 emissions showed a clear descending trend in the discharge of hydrothermal gases at Deception volcano between December 2009 and February 2010. The CO2 emissions reached the highest variance and values in December 2009, and temporally correlated with an important LP activity cluster. The absence of similar temporal correlation in January 2010 suggested a different source for the second LP seismicity burst, which was confirmed by seismic array data analysis. Thus, diffuse CO2 degassing data have provided evidence of the activation of at least two different sources of seismicity during the study period at Deception volcano. The LP seismicity observed at Deception volcano during the first period was probably caused by fluid-driven cracks that originated from pressure fluctuations in the volcano-hydrothermal systems beneath Deception volcano. The increase in magmatic He emissions suggest a deep magmatic intrusion that probably occurred before December 2009 that injected magmatic gases, disturbed the hydrothermal system and caused the pressure fluctuations. Since there was no evidence of deep seismic sources, such deep magma intrusions may have occurred through a previously rifted area or below the seismogenetic zone.
The use of the waveform similarity of the LP activity at nearby stations to determine the propagation characteristics of the seismic wavefronts has enabled us to distinguish between two sources of LP seismicity and characterizes their origin, postulated by the dynamics of diffuse CO2 emissions. The results reported here highlight the usefulness of seismic arrays for volcano seismology and the advantages of continuous monitoring of diffuse CO2 emissions, not only for volcano monitoring purposes, but also to improve our understanding of volcano seismic activity.
Acknowledgements
This research was financially supported by CGL2007-29839-E complementary action from the Spanish National R&D&i Plan 2008–11 of the Spanish Government and Cabildo Insular de Tenerife. We are grateful to the personnel of the Spanish Army in charge of the Spanish Antarctic base Gabriel de Castilla, specially to Cdr José Gonzálvez, the crew of the RV BIO La Palmas, from the Spanish navy, and Unidad de Tecnología Marina (UTM-CSIC) for their assistance. We are also grateful to Dr Daniel Stich for providing the seismic counting in the first stage of the paper and Laboratorio de Astronomía, Geodesia y Cartografía of University of Cadiz for the orthophotomap of Deception volcano. We thank two anonymous reviewers for their constructive comments.
Author contribution
Eleazar Padrón installed the geochemical station in Deception Island volcano and wrote the paper. Pedro A. Hernández, Minoru Kusakabe and Hiroshi Wakita installed the geochemical station in Deception Island volcano, and participated in data analysis and writing the article. Hirochika Sumino analysed the concentration and isotopic composition of noble gases in the fluid samples and participated in writing the article. Enrique Carmona and Javier Almendros analysed the seismic array data and participated in writing the article. Nemesio M. Pérez, Gladys Melián and Germán D. Padilla participated in data analysis and writing the article.