Introduction
Due to the soil-plant interaction, the development of fruit trees and their production capacity are affected by the spatial variability of soil properties (Pedrera-Parrilla et al., 2016; Khan et al., Reference Khan, Zaman, Chang, Farooque, Schumann and Madani2016). Soil sensors for mapping the apparent soil electrical conductivity (ECa) are increasingly used to assess the spatial variability (Corwin and Lesch, Reference Corwin and Lesch2003; Fulton et al., Reference Fulton, Schwankl, Lynn, Lampinen, Edstrom and Prichard2011), and to delineate management zones according to the concept of precision agriculture (Moral et al., Reference Moral, Terrón and Marques da Silva2010; Peralta and Costa, 2013). Those management zones can also be delimited in combination with spectral vegetation indices (De Benedetto et al., Reference De Benedetto, Castrignano, Diacono, Rinaldi, Ruggieri and Tamborrino2013; Ortega-Blu and Molina-Roco, Reference Ortega-Blu and Molina-Roco2016). This last approach allows identifying homogenous sub-field areas related to the intrinsic properties of soil and crop response. In this respect, the combination of ECa and vegetation indices for field zoning is preferred, since ECa by itself may not be a good estimator of the most commonly measured soil properties, and under irrigation conditions, the vegetation status may be more affected by water management than soil properties (De Benedetto et al., Reference De Benedetto, Castrignano, Diacono, Rinaldi, Ruggieri and Tamborrino2013).
ECa and/or spectral vegetation indices have been mainly applied in field crops or vineyards (Priori et al., Reference Priori, Martini, Andrenelli, Magini, Agnelli, Bucelli, Biagi, Pellegrini and Costantini2013), but fewer studies refer to their use in fruit plantations, and even less in Mediterranean latitudes. One important reason could be the small size orchards usually have there. Nevertheless, and as pointed out by Käthner and Zude-Sasse (Reference Käthner and Zude-Sasse2015), even in small orchards there may be differences in soil properties affecting tree growth and fruit quality.
In addition, spatial variability of soil and/or vegetation vigour can be particularly accentuated in plots that have been modified to enlarge and to adapt orchards to modern technology. Those transformations have been mainly made by means of land movements, removing terraces and/or field margins that actuated as soil conservation measures (Martínez-Casasnovas and Ramos, Reference Martínez-Casasnovas and Ramos2009). This is the case of many orchards that have been planted in the last decades, which have been transformed in response to market and, to some extent, subsidies (Cots-Folch et al., Reference Cots-Folch, Martínez-Casasnovas and Ramos2009; Nainggolan et al ., Reference Nainggolana, de Vente, Boix-Fayos, Termansen, Hubacek and Reed2012). For this reason, it is currently of great interest for fruit growers knowing where these changes within orchards can be a major constraint for their management (Fulton et al., Reference Fulton, Schwankl, Lynn, Lampinen, Edstrom and Prichard2011).
In this context, the present work investigated the application of detailed airborne images and a resistivity soil sensor (Veris 3100) to detect soil and crop spatial variability to assist in orchard management. The case study was carried out in a peach orchard (Prunus persica) located in Lleida (Catalonia), which is the leading peach production area in Spain and also one of the most important in Europe (Pascual et al., Reference Pascual, Urbina, Dalmases and Nolla2006). The study area suffered land transformations in the 80s decade to enlarge fields and changed from rainfed arable crops to irrigated orchards.
Material and methods
Study area
The research was carried out in a commercial peach tree plantation of 2.24 ha located 20 km south from Lleida (Catalonia, NE Spain) (Lat 41.477157°, Long 0.509500° WGS84). It was planted in 2012 with white peach (Prunus persica L., var. Patty), which is early harvested. The training system was the so-called ‘Catalan’ vase or vessel shape, with a plantation pattern of 5×2 m. Peach trees were fertirrigated by means of a drip irrigation system. The elevation ranges from 156–167 m a.s.l. The slope is gentle to moderate, with an average of 5.3%. The current morphology is the result of land clearing and levelling carried out during the 1980 decade. Previously, the relief was composed of low hills and crops in terraces protected with stone walls. Soils of the area are classified as Typic Xerorthent, coarse-silty, mixed (calcareous), thermic (Soil Survey Staff, 2014). They have a typical sequence of horizons Ap-Bw-C (lutites), with lutites usually presenting a moderate salt content.
ECa survey and soil sampling
An ECa survey was conducted on March 1st, 2016 to analyse the relationship with soil properties and vegetation vigour. It was done with a Veris 3100 ECa surveyor implement (Veris Technologies Inc. Salina, Kansas, USA). Veris 3100 uses two EC arrays to map the 0–30 cm (shallow ECa) and 0–90 cm (deep ECa) soil depths simultaneously. Data was georeferenced by means of a Trimble AgGPS332 receiver with EGNOS differential correction in geographic coordinates WGS84 (EPSG 4326). ECa above or below ±2.5 SD were considered outliers and were removed from the original data file according to the criteria of Taylor et al. (Reference Taylor, McBratney and Whelan2007). The final ECa data set consisted of 1668 points with shallow and deep readings. For interpretation and comparison purposes, ECa values were standardized at the reference temperature of 25°C. In order to do that, a polynomial function was used as proposed by Sheets and Hendrickx (Ma et al., Reference Ma, McBratney, Whelan, Minasny and Short2010). The adjusted ECa values were then renamed to EC25 and expressed in dS/m at 25°C. These data were interpolated to a 1-m grid by means of ordinary kriging using the exponential semivariogram model. In addition, anisotropy was considered. This was because semivariance values presented a clear directional distribution in the NW to SE direction, perpendicular to the tree rows. For this purpose, ArcGIS Geostatistical Analyst 10.4 (ESRI, Redlands, California, USA) was used.
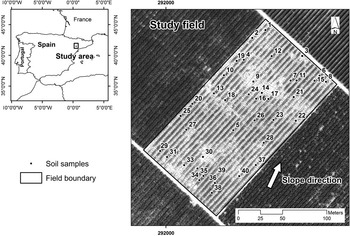
The EC25 map was clustered in 5 different classes, according to an unsupervised classification algorithm. In those zones, 40 sampling points were randomly distributed with 8 points per zone (Figure 1). Soils were sampled with an auger up to 90 cm or up to the depth of the limiting layer. This limiting layer was composed of Tertiary lutites. The following properties were analysed for the 0–30 cm layer: pH, EC1:5, equivalent calcium carbonate, organic matter content, cationic exchange capacity, particle-size (texture), and water holding capacity at −33 and −1500 kPa.
Location of the study area. Field boundary and soil sample points.

Multispectral data acquisition and vegetation vigour
A 4-band multispectral image was acquired on May 16th, 2016 (approximately one month before harvest) by means of a Digital Multi-Spectral Camera (DMSC) (Specterra Services-Australia). The platform was an airplane operated by RS Servicios de Teledetección (Lleida, Spain). The DMSC captured four spectral bands 20 nm width and centred at 450 nm (blue), 550 nm (green), 675 nm (red) and 780 nm (short wave near infrared). The image was pre-processed by the provider’s software to compensate for miss-registration due to lens distortion, less than 0.2 pixels, and for scene brightness due to the bi-directional reflectance distribution function (Canci et al., Reference Canci, Wallace, Mattiske and Malcolm2004). Absolute radiometric calibration was not carried out since the purpose of the study was not a multi-temporal analysis of the tree vigour.
Only pixels with presence of vegetation in peach trees (NDVI >0.4) were mapped. Those pixels were then used to define the tree canopy cover. This was converted to a polygon layer to individualize each tree as an object. The polygons were used to calculate the NDVI zonal statistics per tree (min, max, mean and standard deviation). These basic statistics were joined to the tree canopy layer and then the polygons were converted to points (at its centroid). From the trees represented by their centroids, an ordinary kriging with an exponential semivariogram was performed to interpolate a surface with the NDVI continuous spatial distribution.
Management zones and statistical analysis
Different types of potential management zones were delineated according to the shallow EC25 or NDVI surface data. The deep ECa data were not used since only soil samples of the 0–30 cm layer were analysed. To do this, the ISODATA algorithm implemented in the Image Analyst of ArcGIS 10.4 was applied. The ISODATA is a k-means algorithm that uses minimum Euclidean distance to assign a cluster to each candidate pixel in an iterative process (Jensen, Reference Jensen1996), removing redundant clusters or clusters to which not enough pixels are assigned. Several types of statistical analysis (simple linear regression and ANOVA) were carried out to describe and analyse the different acquired variables (EC25, soil properties and NDVI). The software JMP Pro 12 (SAS Institute Inc.) was used for that purpose.
Results and discussion
Soil properties
The soils of the study area were characterised by a basic pH of 8.2 and an EC1:5 between 0.19–3.58 dS/m at 25°C, with an average of 1.59 dS/m at 25°C. These values were indicative of non-saline soils,<2 dS/m at 25°C, or slightly saline soils, 2–4 dS/m at 25°C. However, this classification refers to salinity in saturated extracts of soil, but not to the 1:5 extract analysed in this work. Therefore, this interpretation may not be conclusive. In addition, soils had a high content of calcium carbonate, 33%. The average CEC was low to moderate, 10.35 meq/100 g. The organic matter content was low to moderate, 2.16% and the WHC of the top soil layer was 9.77%. If this value were extrapolated to the average depth of the soil, 61.15 cm, the WHC would be 58.86 mm, indicating a very low or low WHC. The most frequent soil texture was loam, clay loam or silty clay loam. Those textures do not represent particular limitations for crop development.
EC25 and NDVI: spatial distribution and comparison with former landforms
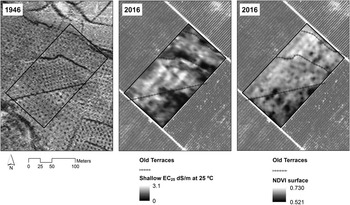
The top soil volume explored by Veris 3100 with the shallow reading, presented an average value of 1.51 dS/m at 25°C. As described in the Study area section, land levelling works were carried out in this area to remove stone-wall terraces to enlarge fields. Figure 2 shows the comparison between the location of the old stone-wall terraces in 1946 and the apparent electrical conductivity surface data of the present research. Lower EC25 values seemed to follow the pattern of the lower part of the terraces, which were filled with marls and calcareous rocks. Between the terraces there were higher EC25 values, due to deeper soils. In the highest part of the field, there were mainly low EC25 values, due to the higher slope degree of this zone and lower soil depth. Regarding NDVI, average values per tree ranged from 0.40–0.75. Two main zones could be distinguished: one with high NDVI values, in the NW of the plot, and one with low NDVI values, in the SE of the plot. To some extent, the pattern was similar to the EC25 distribution but with some relevant differences. NDVI showed a more continuous distribution, without big changes where the old terraces were located (Figure 2).
Comparison between the location of old stone-wall terraces in the 1946 orthophoto and the apparent electrical conductivity (Shallow EC25 dS/m at 25°C) in the study plot. Source: Own elaboration. 1946 orthophotos were downloaded from the Institut Cartogràfic i Geològic de Catalunya).

Relationship between soil properties, EC25, and NDVI
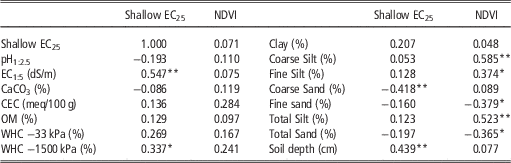
Table 1 shows the correlation coefficients between the shallow EC25 and soil properties of the top layer, up to 30 cm. The results indicate a positive and significant correlation of the shallow EC25 with the EC1:5 (p-value<0.01) and with the WHC at 1500 kPa (p-value<0.05). The EC25 values also showed a negative correlation with the coarse sand fraction. The results are in line with the theoretical basis for the relationship between ECa and soil properties developed by Rhoades (Reference Rhoades1999). However, and unexpectedly, there was no correlation with clay content, in contrast to the results reported in other studies (Sudduth et al., Reference Sudduth, Kitchen, Wiebold, Batchelor, Bollero and Bullock2005). That relationship is more frequent in non-saline soils, where electrical conductivity variations are primarily a function of soil texture, moisture content, and CEC (Rhoades, Reference Rhoades1999). In our study area there were lightly saline soils that could be masking the relationship between EC25 and clay. Soil depth also showed a positive correlation (p-value<0.01) with the shallow EC25.
Correlation coefficients between soil properties (0–30 cm) with shallow EC25 and NDVI, N=40

*p-value<0.05; ** p-value<0.01
Differently from the relationships with the EC25, NDVI was not related to properties as EC1:5, water holding capacity or soil depth. Only textural fractions coarser than clay were correlated. The CEC also showed a certain positive relationship, although not significant. The cause could be the influence of the fertirrigation system (drip irrigation), which maintains the root area free of salts, keeping the soil with certain levels of salts that are tolerated by the peach trees. This is in line with the findings of De Benedetto et al. (Reference De Benedetto, Castrignano, Diacono, Rinaldi, Ruggieri and Tamborrino2013), who stated that under irrigation conditions vegetation may be more affected by water management than by soil properties.
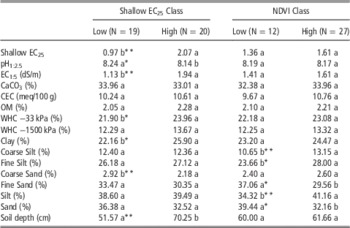
Table 2 shows the results of the ANOVA tests for soil properties according to shallow EC25 classes. The objective was to prove the correspondence of EC25 classes with the measured soil properties, and check if in each class there were significantly different mean values of the different properties. The results confirm the relationships found between the continuous values of the shallow EC25 and soil properties, but there were also other properties that could be distinguished in the shallow EC25 classes. This was the case of pH, which was negatively correlated, and also WHC −33 kPa. In addition, clay content of the top horizon could be differentiated by zones of shallow EC25, with a positive relationship: the higher the EC25, the higher the clay content. This is in agreement with the theoretical background about the nature of the ECa exposed above, although the direct relationship between clay content and EC25 was not significant, possibly because of the salinity of the soils.
ANOVA tests of the soil sampled properties according to shallow EC25 or NDVI (2 classes). Different letters per row and per class indicate statistically significant differences

*p-value<0.05; ** p-value<0.01
Table 2 also shows the results of the ANOVA tests of sampled soil properties checking the possible effect of NDVI classes (factor under analysis). Only a correlation with some texture fractions was found. In particular, the relationship was with coarse silt and total silt (p-value<0.01); and with fine silt, fine sand and, consequently, with total sand (p-value<0.05). However, possible expected relationships between the NDVI classes and EC25 or EC1:5 were not found. There was also no correlation with soil depth. It was expected that NDVI might be related to depth since higher vigour trees are usually located in deeper soils.
One question that arises from the above results is that the shallow EC25 classes were not able to differentiate NDVI values within the zones and vice versa. However, both classifications were related to some soil textural fractions in the same way. This suggests that part of the EC25 classes may be coincident with NDVI classes, but there could be something altering the relationship that makes it non-significant. The main different zones were located where the old terraces had been in the past, before land transformation. The removal of the terraces and the levelling influenced or broke the continuity of soil properties, when regarding the map (Figure 2). Because of this and of the drip irrigation system, there was not a better correspondence of classes since in the low EC25 class trees were well maintained thanks to the irrigation system.
Conclusions
The present work constitutes a contribution to the application of precision agriculture (PA) techniques in fruticulture, precision fructiculture, which are not so extensively used as in arable crops. It was demonstrated that, in a relatively small orchard, an important spatial variation of soil properties and plant vigour can be found, which can justify the application of PA techniques.
The results of the ECa survey and soil sampling showed that the land transformation carried out starting in the 1980 decade to enlarge fields could have altered the spatial distribution and continuity of soil properties. In this respect, although a relationship between apparent electrical conductivity and peach tree vigour could be expected, it was not found, even in the case of trees planted in soils with salt content above the tolerance threshold. This could be due to the drip irrigation system used in the orchard, which keeps the trees free of high salt contents in the root-explored region.
Overall, the results suggest that PA strategy may be appropriate because of the spatial structures of EC25 and NDVI variables. Nevertheless, and because of the lack of relationship between EC25 and NDVI, it is better to propose two types of management zones, depending on the objective of the action to be carried out. One type of management zones would be delineated according to the shallow EC25 classes, which would mainly serve to improve water retention capacity through amendments with organic matter and more frequent irrigation; and to improve natural drainage. And the second type of management zones would be delineated according NDVI classes, which would serve as reference to regulate tree vigour and yield through different actions such as pruning, application of growth regulator or fruit thinning.
Acknowledgements
This work was funded by the Spanish Ministry of Economy and Competitiveness through the project AgVANCE (AGL2013-48297-C2-2-R). We are also grateful to Frutas Hermanos Espax SL for the possibility to carry out the research in its property.