1. Introduction
Current estimates for England indicate that more than one in six deaths of adults aged 35 years and above are caused by smoking (The NHS Information Centre for Health and Social Care, 2008). As well as reducing life expectancy, smoking can be associated with years of mild-to-severely debilitating ill-health, the trauma of associated medical procedures and dependence on medication. This represents an individual cost to smokers that is hard to quantify. In this paper, we focus on the financial cost of smoking to the National Health Service (NHS).
In 1998, the UK Department of Health published ‘Smoking Kills’, the first Government White Paper specifically on tobacco control, setting out a plan of action for reducing smoking prevalence, and hence the burden of smoking-attributable diseases (Department of Health, 1998). The report estimated that the cost of smoking to the NHS in England was between £1.4 and £1.7 billion in 1996 (Buck et al., Reference Buck, Godfrey, Parrott and Raw1997; Parrott et al., Reference Parrott, Godfrey, Raw, West and McNeill1998). As part of a continuing review of progress, we estimate the cost of smoking to the NHS 10 years later, in 2006. These are the costs of treating smokers for diseases caused by their smoking, taking account of hospital admissions, general practitioner (GP) consultations and prescriptions, practice nurse consultations and outpatient attendances.
Direct comparisons with 1996 estimates are ruled out by methodological differences and NHS developments in service provision and costing in the intervening 10 years. Instead, using the same approach as for 2006, we produce a hypothetical estimate of the costs had smoking prevalence remained at 1996 levels.
2. Method
The methodology builds on that used to estimate mortality, morbidity and hospital costs for London (Callum and White, Reference Callum and White2004). Health service use among current and ex-smokers is compared with that of never-smokers and the excess attributed to smoking (except conditions associated with pregnancy, which are based solely on risks of current smoking). For hospital admissions we used a disease-based approach; for primary care and outpatients, this was not possible and a simple measure of excess service use was used. The excess is measured in the form of a relative risk, current or ex-smokers’ health service use relative to that of never-smokers. Together with exposure to these risks – the proportion who are current or ex-smokers – an estimate of the proportion attributable to smoking can be obtained from the following standard formula:

where pcur = proportion who are current smokers; rcur = relative risk for current smokers compared with never-smokers; pex = proportion who are ex-smokers; and rex = relative risk for ex-smokers compared with never-smokers [where relative risk is for a disease (hospital admissions), or of having had a GP or practice nurse consultation, prescription or outpatient attendance].
This proportion is then applied to total numbers of hospital admissions by disease, GP consultations, etc, yielding an estimate of the number attributable to smoking. The cost to the NHS is then obtained by multiplying the attributable number by estimates of unit cost.
Alternative approaches have been concerned with costs over the lifetime of an individual (the life cycle approach) in which case the impact of reductions in mortality, that is, increased life expectancy as a result of lower levels of smoking would need to be taken into account (Sloan et al., Reference Sloan, Ostermann, Conover, Taylor and Picone2004). In other words, if life expectancy increases, ceteris paribus, more will be spent on health care in total over a lifetime, although the annual spend per individual may well fall. Our focus is on the extra cost to the NHS in a particular year associated with smoking, that is, we take a cross-sectional approach. Account is not taken of any savings that may occur in that year as a result of excess deaths of smokers in previous years.
To estimate the costs therefore involves identifying: (i) diseases caused by smoking (for hospital admissions); (ii) current and ex-smokers’ relative risks for these diseases and for primary care consultations, prescriptions and outpatient visits; (iii) admitted patient care totals for diseases and total numbers of primary care consultations, prescriptions issued and outpatient visits; (iv) NHS unit costs for admitted patient care by disease and for primary care and outpatient visits; and (v) the proportion of current and ex-smokers.
2.1 Hospital admission costs
2.1.1 Diseases and relative risks
Hospital admission costs are based on diseases with an established causal link; diseases that are thought to be exacerbated by smoking are not included. Potentially fatal diseases caused by smoking are those listed in the 2004 report of the US Surgeon General (US Department of Health and Human Services, 2004), including several cancers, cardiovascular disease, respiratory disease and peptic ulcer; we additionally included cancers with site unspecified.
Relative risks for each disease, separate for current and ex-smokers, are based on the Cancer Prevention Study II (CPS-II), an American Cancer Society prospective study started in 1982 of 1.2 million adults across the United States (Stellman and Garfinkel, Reference Stellman and Garfinkel1986). The relative risks used here are those derived for the estimation of mortality in 1995 in the United Kingdom (Callum, Reference Callum1998) and in light of more recent evidence, including in our estimates, those for cervical cancer, other heart and arterial diseases. Following the approach of Peto et al. (Reference Peto, Lopez, Boreham, Thun and Heath1992), the relative risks are based on the years 1984–1988 and estimated from current, ex- and never-smokers’ deaths and exposure for men and women in five-year age groups using the Mantel–Haenszel pooling method (Rothman, Reference Rothman1986). This is an age-standardised approach that takes account of the very few or zero deaths occurring in some cells, especially those related to never-smokers. The method assumes a uniform effect within the age range for which it is calculated. The first two years were excluded on account of the bias in short-term results of prospective studies; a tendency to exclude people who are sick at the outset means lower mortality rates than in the general population, with the result that the effects of smoking are accentuated and relative risks elevated. The disadvantage of excluding the first two years is that the measurements of exposure, obtained at the start of the study, become less accurate with duration of follow-up; current smokers who quit smoking continue to be recorded as current smokers and ex-smokers who relapse continue as ex-smokers.
Non-fatal diseases were identified from an overview (Wald and Hackshaw, Reference Wald and Hackshaw1996), and relative risks obtained from a number of sources (Independent Scientific Committee on Smoking and Health, 1988; Logan, Reference Logan1990; Cole et al., Reference Cole, Hill, Farzad, Bouchard, Moher, Rody and Shea1993; Law and Hackshaw, Reference Law and Hackshaw1997; Christen et al., Reference Christen, Glynn, Ajani, Schaumberg, Buring, Hennekens and Manson2000; Tomar and Asma, Reference Tomar and Asma2000). Age-related cataract risks for women are set equal to those estimated for men (Christen et al., Reference Christen, Glynn, Ajani, Schaumberg, Buring, Hennekens and Manson2000). Ex-smokers’ relative risks for hip fracture are assumed to be the same as those of current smokers at the age at which they quit smoking (Law and Hackshaw, Reference Law and Hackshaw1997). For this, distributions by sex and age for ex-smokers according to the age at which they quit were derived using data from the Health Survey for England 2006 (National Centre for Social Research and University College London Department of Epidemiology and Public Health, 2008).
To present a balanced assessment, we included diseases that can be prevented by smoking. Relative risks were obtained for current and ex-smokers, separately when available, otherwise combined. Risks for potentially fatal diseases were again based on CPS-II, in the case of endometrial cancer, during 1984–1992 and in the case of Parkinson’s disease on the CPS-II Nutrition Cohort, a follow-up study of CPS participants started in 1992–1993 (Thacker et al., Reference Thacker, O’Reilly, Weisskopf, Chen, Schwarzschild, McCullough, Calle, Thun and Ascheno2007). Risks for non-fatal diseases were obtained from a number of sources (Logan, Reference Logan1990; Ross et al., Reference Ross, Bernstein, Vessey and Henderson1990; Hall and Harper, Reference Hall and Harper1992).
The complete list of diseases with ICD-10 (International Classification of Diseases, 10th Revision) codes is provided in Appendix 1.
2.1.2 Hospital admissions and costs
Hospital admission estimates are based on April 2006–March 2007 Hospital Episode Statistics (HES) for the whole of England. For ICD-10-coded disease as primary diagnosis, hospital admissions and bed-days by sex, 10-year age group and Healthcare Resource Group (HRG) were provided by the London Health Observatory. This excludes diseases that appear only as a secondary diagnosis on the hospital admission record. However, since primary diagnosis is defined as the main reason why the patient is in hospital, whereas secondary diagnosis is defined merely as relevant to the episode of care – although in some cases this may add to the complexity of care – we believe most of the costs will be captured through the use of episodes with appropriate primary diagnosis. Moreover, the quality of coding of secondary diagnosis in HES data has been historically poor, and so would add a greater degree of uncertainty.
Admissions are either day cases (i.e. not staying overnight) or ordinary inpatient admissions (i.e. staying at least one night). During a stay (also known as a spell) in a hospital, the care of a patient may transfer from one consultant (specialist) to another, for example, from an orthopaedic consultant to the care of an elderly consultant, and these are recorded separately as Finished Consultant Episodes (FCEs) within that one hospital stay. Hence, each hospital stay or spell consists of one or more FCEs, most stays involving only one (88% in 2006–2007). Costings used within the NHS are spell-based, and therefore a spell-based approach was used in this paper for the purpose of the costing exercise. Day cases by definition are completed spells and cost estimates are based on day case data from the admission record. Inpatient costs are based on the overall length of stay in bed-days, or spell duration, as recorded in the discharge record for the last FCE in the spell. Hence, inpatient costs are based on primary diagnosis for the discharge episode. Discharge episodes include 2005–2006 admissions for spells stretching into 2006–2007, and it is assumed here that they are balanced out by unfinished spells for admissions in 2006–2007 stretching into 2007–2008.
Day case and bed-day unit costs for diseases were derived from the NHS FCE reference costs (Department of Health, 2006). Reference costs are not disease-coded but based instead on HRGs. We mapped these to ICD-10 using day case and bed-day tables of HRG by ICD-10. The disease-specific cost estimates are a weighted sum of constituent HRG costs using proportionate distributions of HRG within ICD-10 as weights. Day and bed-day costs for smoking-attributable diseases were calculated for the age group to which the smoking-attributable risks apply. Reference costs for disease groups and for the group of all causes (i.e. all ICD codes including non-smoking related) were calculated separately.
Reference costs for inpatient admissions are published separately for elective and non-elective admissions. These include basic FCE costs and excess bed-day costs, the latter associated with a longer than expected length of stay and defined as the number of bed-days over and above pre-determined ‘trim points’. Average costs per bed-day were calculated by combining FCE and excess bed-day elective and non-elective reference costs.
Published reference costs for 2006–2007 use the most recent HRG coding, HRG4. Hospital episode data, however, are coded according to the previous version, HRG 3.5. In the absence of an HRG 3.5 to HRG 4 mapping, reference costs for 2005–2006 were used, inflated to 2006–2007 prices using the Hospital and Community Health Services pay and prices index. Using 2005–2006 reference costs means that 2005–2006 elective/non-elective and bed-days/excess bed ratios are assumed to apply in 2006–2007.
For each disease, the total cost was obtained by summing day case costs (number of day cases multiplied by average day case cost) and total bed-day costs (number of bed-days multiplied by average cost per bed-day).
2.2 Primary care and outpatient attendances
Primary care consultation and outpatient attendance costs are not disease-based but are based on generic NHS service use data, and relate to all adults (aged ⩾16 years).
2.2.1 Relative risks
Relative risk estimates were derived from data for England on the number of GP consultations in the past two weeks, and the number involving prescriptions, number of practice nurse consultations in the past two weeks and number of outpatient visits in the past three months as reported in the 2006 General Household Survey (GHS) (Office for National Statistics Social and Vital Statistics Division, 2008).
Respondents were asked the number of times they had talked to a doctor in the past two weeks, and follow-up questions for each occasion ascertained whether it was an NHS or private doctor, where the consultation had taken place, on whose behalf, and for which household member if not on their own behalf, and whether a prescription had been issued. The analysis is based on the number of NHS GP consultations made on behalf of the respondent. This consists of ‘own behalf’ consultations and consultations made on their behalf by another household member, the latter constructed by re-allocating all ‘other person’s behalf’ consultations to the appropriate household member. For the very small number in which it seemed that the respondent had simply accompanied the household member, consultations were not reassigned.
Relative risks for prescriptions are based on the number of GP consultations involving a prescription. Repeat prescriptions are said to account for more than 70% of all prescriptions, and most are issued without talking to a GP, and hence not counted in reports based on GP consultations. While understating the scale of prescriptions issued, the assumption made here is that the relative risks for current and ex-smokers derived from GP consultations are applicable to all prescriptions issued.
For practice nurse consultations, respondents were asked to report only those consultations made on their own behalf. Relative risks for outpatient attendances are based on the reported number of visits during the previous three months. These reports are less reliable than primary care reports on two main accounts. First, three months retrospective reporting is less reliable than two weeks. Second, misreporting can arise from the possible confusion of outpatient attendances with other patient care – day case admissions or non-admitted patient care such as regular day attendance or rehabilitation services, for example.
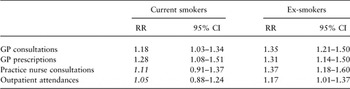
Current and ex-smokers’ relative risks for men and women aged 16 years and above were estimated using negative binomial regression, including age, sex, region, National Statistics Socio-Economic Classification (NS SEC) of household reference person and marital status including cohabitation. A negative binomial model was selected as appropriate for these count data. Estimates and 95% confidence intervals can be seen in Table 1. Estimates significantly greater than 1 (value 1 outside the confidence interval) are used to estimate attributable proportions; otherwise, the relative risk is set equal to 1. Higher ex-smokers’, than current smokers’, relative risks suggest considerable post-diagnosis smoking cessation or reporting as such. Therefore, it is important to emphasise that the risks presented are a means to estimate the overall impact of smoking and should not be seen as a reflection of risks of current smoking relative to ex-smoking.
Regression-based relative risk estimates for reports of health service use, England, General Household Survey, 2006

GP = general practitioner; RR = relative risk; 95% CI = 95% confidence interval.
Note: Values in italics indicate not significant at 0.05 level, substitute RR = 1, to estimate attributable proportions.
2.2.2 Total numbers and costs
GP and practice nurse consultations: Total consultations were based on QRESEARCH regression estimates for England, 2006 (Hippisley-Cox et al., Reference Hippisley-Cox, Fenty and Heaps2007), using GP consultation rates by age to estimate numbers for those aged ⩾16 years. Unit consultation costs are those, not including qualification costs, calculated by the Personal Social Services Research Unit (Curtis and Netten, Reference Curtis and Netten2007).
Prescriptions: Total prescriptions and average prescription costs came from the PACT (Prescribing Analysis and Cost) data on general practice prescribing in England (Horner, Reference Horner2007). The estimate of prescriptions for patients aged ⩾16 years assumes the Prescription Cost Analysis age structure of all prescriptions dispensed in the community (The NHS Information Centre for Health and Social Care, 2007).
Outpatients: Total outpatient attendances were derived from the HES 2006–2007 tables (The NHS Information Centre for Health and Social Care, 2009), the number involving patients aged ⩾16 years estimated pro rata. Outpatient attendance unit cost is the weighted sum, using HES attendances as weights, of first and follow-up attendance 2005–2006 NHS reference costs (Department of Health, 2006), inflated to 2006–2007.
2.3 Smoking prevalence in 2006
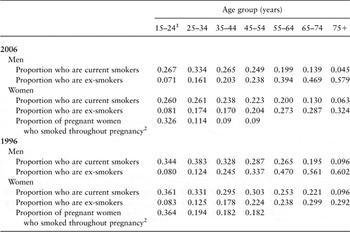
Prevalence by sex and age of adult current and ex-smokers used in the estimation of hospital admission costs was derived from the GHS 2006 data for England (Office for National Statistics Social and Vital Statistics Division, 2008). Since hospital admissions are based on individuals aged ⩾15 years, whereas the lower age limit for GHS is 16 years, we produced estimates for the age group 15–24 years by combining GHS (age: 16–24 years) with the 2006 Smoking, Drinking and Drug Use among Young People in England Survey (age: 15 years) data (Fuller, Reference Fuller2007). For smoking in pregnancy, prevalence was based on the 2005 Infant Feeding Survey (IFS) proportions who smoked throughout pregnancy – England figures (Bolling et al., Reference Bolling, Grant, Hamlyn and Thornton2007). Smoking prevalence figures by sex and age for those aged 15 years and above are shown in Table 2.
Cigarette smoking by sex and age, England 2006 and 1996

Source: General Household Survey 2006 and 1996.
1Age 15 is based on 2006 Smoking, Drinking and Drug Use among Young People in England Survey and 1996 Smoking among Secondary Schoolchildren Survey. The age group for pregnant women is all those under 25 years and hence may include some aged under 15 years.
2Based on Infant Feeding Surveys 2005 and 1995. Age groups 35–44 and 45–54 are figures for women aged 35 years and above.
Primary care and outpatients costs are based on prevalence among all those aged 16 years and above– 21.8% current smokers and 23.9% ex-smokers.
2.4 Cost estimates assuming 1996 smoking prevalence
Costs assuming prevalence had remained at 1996 levels were obtained by keeping unit costs and diseases the same but substituting 2006 with 1996 attributable proportions. With prevalence at 1996 levels, we might expect there to have been more admissions overall. We therefore adjusted totals to include a small increment based on the difference between 1996 and 2006 attributable proportions. Smoking prevalence in 1996 was derived from weighted GHS 1996 data for England (Office for National Statistics Social and Vital Statistics Division, 2002), using weights added retrospectively to the data set. Prevalence among 15-year-olds was obtained from the 1996 Smoking among Secondary Schoolchildren Survey (Office for National Statistics Social Survey Division, 2000) and for smoking in pregnancy from the 1995 IFS (Office of Population Censuses and Surveys Social Survey Division, 1998). Smoking prevalence in 1996 by sex and age is shown in Table 2. Altogether, 28.5% of those aged 16 years and above were current smokers and 24.7% ex-smokers.
3. Results
Treating diseases caused by smoking cost the NHS an estimated £2.7 billion in 2006, equivalent to more than £50 million each week (hospital admission and outpatient costs are actually based on activity during the financial year 2006–2007). Costs are distributed approximately equally between secondary (45%) and primary care (55%), with £1.02 billion spent on hospital admissions, £193 million on outpatient attendances, £532 million on GP consultations, £903 million on prescriptions and £54 million on practice nurse consultations.
3.1 Hospital admissions
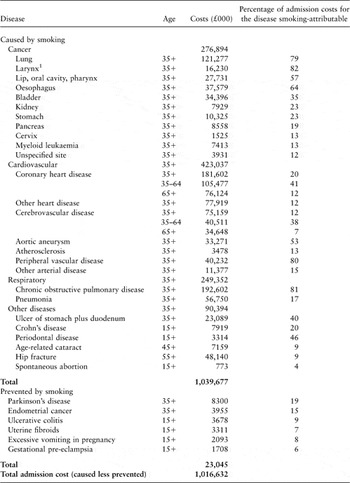
Hospital admission costs by disease are shown in Table 3. As expected, where smoking is the major risk factor for a disease, it accounts for most of the treatment costs, for example, lung cancer (79%) and chronic obstructive pulmonary disease (COPD; 81%). Where smoking is one of several risk factors, treatment costs for high-prevalence diseases may be equally high, but the proportions are lower (e.g. coronary heart disease (CHD), 20%). Although most admission costs are for treating cancer, cardiovascular and respiratory disease, there are notable costs for non-fatal diseases less often linked with smoking, including hip fracture (£48.1 million) and cataracts (£7.2 million).
Hospital admission costs attributable to smoking by disease: England 2006–2007

1Artificially high due to relatively small number of women, who have lower relative risks than men, admitted for cancer of the larynx. Attributable proportions separately for men and women lower than those for lung cancer.
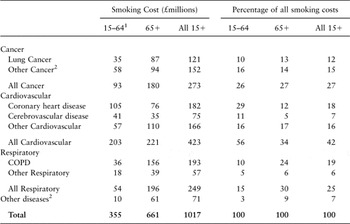
Lung cancer, CHD, stroke and COPD account for 56% of net smoking-attributable admission costs, rising to 93% including other cancers, cardiovascular and respiratory diseases (Table 4). Cardiovascular disease is most costly, at £423 million, followed by cancer and respiratory disease at £273 million and £249 million, respectively.
Hospital admission costs due to smoking and percentage distribution by disease and age: England, 2006–2007

Note: Values are rounded to the nearest million and hence may not sum to total.
1All cancer, cardiovascular and respiratory costs refer to the age group 35+, for other diseases costs refer to age groups as listed in Table 3.
2Net costs, after allowing for diseases prevented by smoking.
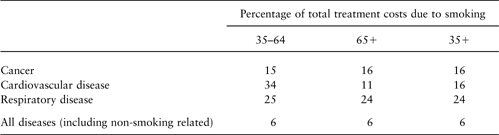
Compared with overall treatment costs, smoking impacts most on respiratory disease, 24% of the total treatment costs (age ⩾35 years) attributable to smoking compared with 16% for cancer or cardiovascular disease (Table 5).
Percentage of total admission treatment costs by age that are due to smoking; cancer, cardiovascular and respiratory disease and all diseases, England 2006–2007
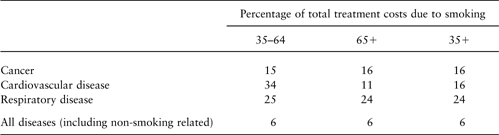
Just over a third of the smoking costs occur in the care of people aged <65 years. More than half of these costs are for treating cardiovascular disease. In fact, for CHD the burden of costs lies with people aged 35–64 years, where smoking is a more prominent risk factor than at older ages and accounts for 41% of total CHD treatment costs. However, a greater proportion of the costs of treating cancer and respiratory diseases occur in people aged ⩾65 years.
The cost avoided due to the protective effect of smoking for some diseases is approximately £23 million, not a negligible sum but by comparison a small proportion (2.2%) of the costs incurred by diseases caused by smoking. Altogether, smoking accounted for 5% of all adult admission costs (aged ⩾15 years).
3.2 Primary care and outpatients
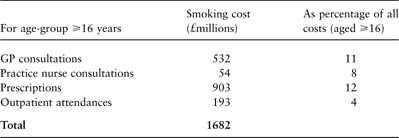
The estimated cost of GP consultations attributable to smoking was £532 million, 11% of all adult consultation costs (aged ⩾16 years), and GP prescriptions cost an estimated £903 million, 12% of all costs (Table 6). Thus, one in nine pounds of NHS expenditure on adult GP consultations and one in eight pounds on GP prescriptions were due to smoking. Smoking accounted for an estimated 8% of practice nurse consultation and 4% of outpatient attendance costs.
Primary care and outpatient costs due to smoking: England 2006 (primary care), 2006–2007 (outpatients)

GP = general practitioner.
Note: Values are rounded to nearest million.
3.3 NHS costs assuming smoking prevalence had remained at 1996 levels
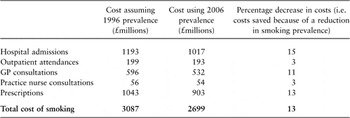
Assuming that smoking prevalence had not changed since 1996 and using 2006 unit costs, the cost to the NHS could have been almost £3.09 billion, compared to £2.70 billion (Table 7) – a difference of £388 million (13%). The largest impact (15%) is associated with hospital admissions.
Comparison of the costs of smoking in 2006 based on smoking prevalence in 2006 and assuming 1996 prevalence: England

GP = general practitioner.
Note: Values are rounded to the nearest million.
4. Discussion
This study estimates the cost of smoking to the NHS in England in 2006 to be £2.7 billion, accounting for 5% of adult hospital admission costs, 11% of GP consultation and 12% of GP prescription costs, 8% of practice nurse consultation and 4% of outpatient costs. This represents a significant use of NHS resources, requiring a major investment in services and patient support. Applying 1996 smoking prevalence levels, in effect comparing the costs at a single point in time of treating people with smoking-attributable diseases, suggests that NHS costs could have been up to £388 million more.
The past decades have witnessed significant changes in smoking prevalence as the detrimental health consequences of smoking became widely recognised, fewer people becoming smokers and more smokers quitting, each of these contributing to the overall impact on health costs. Based on the GHS data, in 1976 in England, for example, 46% of those aged 45–64 years were smokers; 70% had ever been smokers and 35% of these ever-smokers had quit smoking. By 1996, current smoking among the 45–64-year-olds had fallen to 28%; 59% were ever-smokers and significantly more, 52%, had quit. Ten years later in 2006, 22% were smokers and 49% were ever-smokers, 56% of whom had quit.
Any change in the use of NHS resources reflects the effects of changes in prevalence over many years; for diseases with long lead times, such as lung cancer and especially those least susceptible to the reverse effects of quitting, ongoing reductions are largely explained by changes in smoking behaviour decades earlier. For diseases such as CHD where quitting can reverse the risks within a few years, the impact on costs is realised sooner.
Costs presented here address the direct effects of smoking, that is, the cost of treating smokers for diseases caused by their smoking, and no attempt has been made to take account of the effects of passive smoking or of maternal smoking during pregnancy. Treatment of fire injuries due to smoking were likewise omitted from hospital admission costs as they can include injuries of non-smokers.
NHS costs represent only a small part of the total costs to society of smoking, taking no account of related costs such as the need to provide continuing care for people suffering from chronic diseases as a result of smoking. The most obvious exclusions are costs of social care and informal care for people with debilitating heart conditions, stroke, COPD, etc. The cost of private medical care is also not included. In addition, the full economic cost would include societal benefit payments such as disability living allowance, attendance allowance and incapacity benefit as well as indirect costs such as the resulting loss of life or outputs. Where the economic costs of individual diseases have been estimated, the cost to the NHS has been shown to be a relatively small part of the total; for example, the most recent estimate of the cost of stroke for the United Kingdom is £9 billion, of which just 17% is the cost to the NHS (Saka et al., Reference Saka, McGuire and Wolfe2009).
The estimates in this paper reflect what is possible with the available data. The CPS-II relative risk data used in estimation of hospital costs, although developed in the 1980s, remain the best available for this purpose. Admittedly, the sample over-represents the more educated white population, but it could be argued that this brings the advantage of greater homogeneity in composition of smokers and non-smokers and hence estimates of relative risk are less likely to be confounded by social class (Callum, Reference Callum1998).
We are aware of issues concerning what is included in attributable health service use as well as how primary and secondary care are costed: both of these merit further consideration. Thus, hospital admission estimates were based on diseases with established evidence of causality. We did not include those for which there is accumulating evidence of a causal link such as type II diabetes and Alzheimer’s disease, or those associated with reproduction such as infertility (Hackshaw, Reference Hackshaw2004), or those exacerbated by smoking such as asthma, and may therefore have slightly understated the burden of smoking on hospital admission costs. In addition, data considerations precluded using this disease-specific approach for primary care and outpatient estimates. Instead, they rely on generic excess service use and thus include all diseases, covering those such as age-related macular degeneration and psoriasis, which, though debilitating, are unlikely to require hospitalisation, and also milder health symptoms that may be precursors to disease. However, they also include diseases such as asthma, exacerbated rather than caused by smoking. Furthermore, basing excess use solely on a statistical association does risk including effects that are not all directly attributable to smoking; the direction of causality between smoking and mental health, for example, is complex.
As for the costs, some components of admitted and outpatient care were costed separately and not included in the basic reference costs used here – for example, critical care services and specialist care such as chemotherapy and radiotherapy. In addition, some secondary care costs are not included, notably accident and emergency and paramedic/ambulance costs. Reference costs are published for these but the service delivery data do not readily lend themselves to producing estimates comparable to those already included. And finally, our estimates of primary care costs do not include dental health services, although smoking is a major risk factor for periodontal disease. This was because the banding scheme for costing dental treatments does not allow identification of numbers and unit costs of specific treatments.
Many of these costing issues may be addressed in future through the programme budget analysis being developed by the Department of Health. This attempts to allocate all NHS costs including those omitted in our analysis to ICD-based programme budget categories (PBCs) on the basis of mapping indicative provider costs; however, these are still at an early developmental stage. The usefulness of these programme budget data will be enhanced as their reliability and scope increase, although as they stand, the PBCs do not uniquely identify each smoking-attributable disease.
Nevertheless, to illustrate and compare their use, we derived PBC-based estimates of secondary care costs for the three disease groups that accounted for 93% of hospital admission costs (i.e. cancer, cardiovascular disease and respiratory disease; see Appendix 2 for the method). The estimated smoking-attributable secondary care cost of treating these diseases is £1.6 billion; this would imply an overall cost of smoking to the NHS of £3.1 billion. Adding more tenuous PBC-based estimates for other diseases does not affect this total. However, this secondary care cost estimate required the strong assumption that proportions of PBC hospital admissions that are for smoking-related diseases can be extrapolated for that category to all other aspects of secondary care.
5. Conclusion
We have shown that although smoking continues to represent a substantial cost throughout the NHS, there have been significant savings associated with a reduction in prevalence. Much of this is due to the considerable reductions in prevalence during the 1960s and between the mid-1970s and early 1980s, and on this account we can expect to see further savings in the coming years. However, with prevalence levelling out around the mid-1990s and resuming only a slow decline since 2000, the outlook beyond this could be less promising.
Recent government policy has introduced a range of controls on the sale and use of tobacco including the banning of smoking in enclosed work and public places, banning various forms of advertising and increasing the age of sale for tobacco products from 16 to 18 years. In addition, there has been emphasis on cessation activities through a network of NHS Stop Smoking Services and provision of pharmaceutical stop-smoking aids. (Department of Health, 2008).
Nevertheless, maintaining the present rate of decline in prevalence is not enough to secure additional savings on the scale already seen; this urgently requires new policies aimed at discouraging people from becoming smokers and getting more smokers to quit. To this end, and in the longer term, it is particularly important to focus on children and young people to prevent them from taking up smoking in the first place. The Health Bill before Parliament in 2009 takes some steps in this direction by introducing further controls, namely the removal of point-of-sale displays in shops, which have increasingly been used as advertising to lure consumers, and the restriction of access to vending machines either by location or mode of operation so that only people aged ⩾18 years can use them. Unfortunately, these measures are unlikely to be fully enacted until 2013 at the earliest (The Stationery Office, 2009).
Acknowledgements
The Hospital Episode Statistics were made available by the NHS Health and Social Care Information Centre and supplied by the London Health Observatory. Material from the General Household Survey, Smoking among Secondary Schoolchildren, 1996 and Infant Feeding Survey, 1995 is crown copyright, has been made available by the Office for National Statistics (ONS) through the UK Data Archive and has been used by permission. Neither the ONS nor the Data Archive bear any responsibility for the further analysis or interpretation of the data reported here. The Health Survey for England, 2006 is crown copyright, has been made available by the National Centre for Social Research and University College London Department of Epidemiology and Public Health, sponsored by the Department of Health, and supplied by the UK Data Archive.
Appendix 1 Diseases included in the estimate of smoking-attributable hospital admission costs

1Except I173.9 peripheral vascular disease.
Appendix 2 Programme budget category-based secondary care costs
Here, we attempt, using the Department of Health PBC costs, to obtain a rough idea of the scale of secondary care smoking costs had we been able to include costs currently precluded by data limitations. For programme budgeting, all secondary care costs are mapped to PBCs. However, these are fairly broad ICD-based categories, and though there are PBC subcategories, it is often the case that costs cannot be uniquely allocated and instead are recorded within a residual ‘other’ subcategory. This exercise is based on the broad PBCs.
Provider returns for primary and secondary care PBC costs were obtained via the Program Budget Guidance Manual excel workbook link (Department of Health, 2007a). Final PBC costs, primary and secondary care combined, are published in the resource accounts of the Department of Health (Department of Health, 2007b). Resource accounts-based estimates of secondary care costs were obtained by assuming the same proportion secondary as for provider returns.
On the basis of our cancer, cardiovascular disease and respiratory disease hospital admission costs and PBC cancers and tumours, problems of circulation and problems of the respiratory system secondary care costs, we obtain disease group secondary care cost estimates. First, disease group and PBC ICD-10 codes were compared. PBCs are on the whole broader groupings than disease groups, including more ICD codes. By matching PBC and disease group ICD to HES primary diagnosis coded data, we obtained disease group hospital admissions as a proportion of PBC hospital admissions. Making the strong assumption that proportions of PBC hospital admissions, which are for smoking-related diseases, can be extrapolated to all other aspects of secondary care, these proportions multiplied by PBC costs provided disease group estimates of secondary care costs. In the case of cardiovascular disease, some ICDs (10% of cardiovascular admissions) are allocated to PBCs other than problems of circulation, and for these the proportions of admissions they represent in their respective PBCs were obtained. The total cardiovascular cost is the sum of constituent PBC costs. Smoking-attributable costs were obtained by multiplying these totals by all-age disease group smoking-attributable proportions.
Estimates for other diseases were obtained in similar manner, basing total costs on their proportionate admissions profile in the respective budget category. Diseases in the same PBC were grouped together in the calculations. These estimates are more tenuous than disease group estimates as applying this method to individual diseases within PBCs stretches the assumptions about proportionate costs even further. However, an alternative approach, uprating hospital admission costs by the same factor as for the three disease groups combined was considered inappropriate as initial indications are that these, especially cardiovascular disease, would overstate additional costs.
Finally, for an estimate of the total cost of smoking, our hospital admission and outpatient costs are replaced by these secondary care cost estimates.