Milk is a basic aliment during growth and development in mammals. Dairy products represent, however, one of the principal sources of cholesterol in human diet, especially in children (Royo-Bordonada et al. Reference Royo-Bordonada, Gorgojo, Oya, Garces, Rodriguez-Artalejo, Rubio, Del Barrio and Martin-Moreno2003), and a direct relationship between the level of consumption of these products and the prevalence of cardiovascular disease in the adult age, probably as a consequence of hypercholesteremia, has been shown (Lawlor et al. Reference Lawlor, Ebrahim, Timpson and Davey Smith2005).
Despite of the extensive knowledge in other species (Horton et al. Reference Horton, Goldstein and Brown2002; Kalaany & Mangelsdorf, Reference Kalaany and Mangelsdorf2006), the homeostasis of cholesterol in dairy cows remains almost unknown until now. Feed of ruminants contains negligible amounts of cholesterol. Despite that, having in mind daily milk yields of up to 50 l and a mean cholesterol content of 200–300 mg/100 g milk fat (Precht, Reference Precht2001), as much as 5 g cholesterol are released by the bovine mammary gland per day. Nowadays many of the regulatory processes that may affect cholesterol concentrations in milk (i.e. biosynthesis regulation, transport processes) are still not completely understood. During the last years, our group has focussed on the identification of candidate genes to develop cholesterol transport functions in the bovine mammary gland. The active transporters ABCA1, ABCG5 and ABCG8 were designed as main candidates (Farke et al. Reference Farke, Viturro, Meyer and Albrecht2006; Viturro et al. Reference Viturro, Farke, Meyer and Albrecht2006). Among other tissues, mammary gland showed expression of these three candidate genes.
In dairy cows, blood cholesterol concentrations increase from 1–3 mm during the first weeks of lactation up to the 6–7 mm reached roughly eight weeks post partum (Guretzky et al. Reference Guretzky, Carlson, Garrett and Drackley2006; Mohebbi-Fani et al. Reference Mohebbi-Fani, Nafizi, Shekarforoush and Rahimi2006). However, the relation between blood and milk cholesterol concentration remains unclear. The inter-individual variation of both parameters is huge. The transfer process of cholesterol between blood and milk as one of the main pieces of the complex regulation mechanism needs to be assessed. It is even unclear whether local production and functional differences in udder compartments may affect cholesterol transfer into the milk.
The lack of knowledge about involved processes is mainly due to the problems related to the analysis of cholesterol in milk. While cholesterol concentration in blood can be easily and reliably determined applying a colorimetric technique after a simple centrifugation step for plasma separation, a direct application of this technique is not possible for raw milk due to its colour and turbidity. Thus, the existing method is based on the extraction of the milk fat and its posterior analysis using high-sensitive chromatographic techniques (Lin et al. Reference Lin and Wu2007). These methods are, however, extremely time-consuming. The costs and equipment requirements make it not accessible for large-scale studies. For such projects, a reliable, fast and economic method for determining milk cholesterol concentration is urgently needed. As the milk fat extract is a slightly yellow-coloured product very similar to plasma, we considered this as a suitable substrate for a colorimetric technique as suggested already by a previous work (Saldanha et al. Reference Saldanha, Mazalli and Bragagnolo2004).
The main objective of this study was the validation of the colorimetric technique for measurement of cholesterol concentration in bovine milk samples, as well as the optimization of the sampling conditions. In addition, variation of milk and blood cholesterol levels during the lactating cycle of dairy cows was investigated.
Materials and Methods
Animals and sample collection
Milk was obtained from 47 Brown Swiss cows (4·6±1·4 years; mean±SD) in all stages of lactation, fed a standard diet (silage, hay and concentrates) and free of clinical udder health problems. Representative samples of the total milking of each cow were collected between 15·00 and 16·00 h directly in the milking parlor (2×2 tandem; Westfalia Surge GmbH, Biomilker cluster, Oelde, Germany) and analysed within 24 h for fat, protein, lactose and urea (Fourier transform Infrared (FTIR) spectroscopy, Milchprüfring Bayern e.V., Wolnzach, Germany) and their cholesterol content (see below).
Milk fat extraction
Milk fat was extracted by an established routine methodology based on direct saponification (Fletouris et al. Reference Fletouris, Botsoglou, Psomas and Mantis1998; Saldanha et al. Reference Saldanha, Mazalli and Bragagnolo2004). Ten milliliters KOH (0·5 N) methanolic solution was added to 4 ml raw milk and mixed for 15 s. Mixture was incubated in a water bath at 80°C for 15 min. Thereafter, 2 ml distilled water and 3 ml hexane were added. The mixture was mixed by vortexing for 10 sec and centrifuged (2000×g, 1 min) achieving two clearly distinguishable phases. The upper hexane phase containing the milk fat was pipetted into a glass vial and placed in a water bath at 80°C until complete evaporation and the residue was reconstituted with 4 ml isopropanol to achieve the initial raw milk volume. Each milk lipid extraction was run in duplicate, and the absence of cholesterol from the discarded aqueous solutions was proven by posterior colorimetric analysis.
Colorimetric determination
An enzymatic kit (Thermo Electron Co., Vantea, Finland) developed for the determination of cholesterol in biological fluids was used. Thereby, cholesterol and its esters were transformed in a series of reactions catalised by cholesterol esterase, cholesterol oxidase and peroxidase into a coloured product, whose intensity is directly proportional to the concentration of cholesterol in the sample (Allain et al. Reference Allain, Poon, Cicely, Richmond and Paul1974). The optical density can be measured in a spectrophotometer (TECAN Sunrise™, Tecan Group AG, Männedorf, Germany) at 490 to 550 nm and plotted against a standard curve to obtain the concentration value of the sample.
The optimal reaction parameters (sample:reaction proportion, incubation time, sample dilution during extraction) were tested and used during the whole study. Reaction was performed in 96-well microtiter plates in triplicates for each sample, using a sample:reagent proportion of 1:20 (for 96-well plate: 10 μl sample+200 μl reagent) and measuring the optical density at 500 nm after 2 h incubation of the plate at 37°C. Because of its physical properties, the milk fat extract is an optimal sample for this protocol and could be analyzed without any further problem.
Standard curve
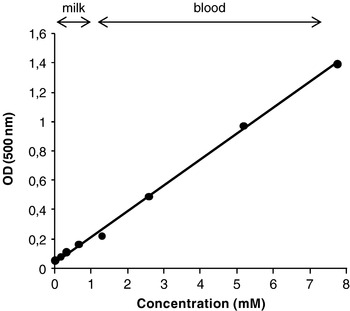
To establish a standard curve, cholesterol standard solutions (Cholesterol, Art. Nr. C3045, Sigma Aldrich Co.) with known concentrations (0, 0·18, 0·32, 0·64, 1·29, 2·58, 5·1, 7·75 mm; 0 to 300 mg/dl) were measured in duplicate in every plate. The standard curve concentration range was aimed at including both milk and blood usual cholesterol levels (Fig. 1).
Example of a cholesterol concentration standard curve (y=0·1758 x+0·0413; R2=0·998), arrows show typical cholesterol concentration ranges reported in bovine milk and blood.

Sample stability
The stability at 4°C of the raw milk (without addition of any conservation solution) was tested by measuring five different milk samples during a period of seven days. Milk samples were aliquoted on the first day in six sub-samples and stored at 4°C. Each experiment day, a fat extraction was carried out and directly thereafter the cholesterol concentration was assessed. The stability of the milk fat extract was tested on three extracts stored at 4°C by additional analyses for two months.
Intra- and inter-assay variation
For calculation of the intra-assay coefficient of variation (CV), three milk samples containing 0·28, 0·38 and 0·51 mm-cholesterol were extracted and each milk fat extract was measured ten times in series. For calculation of the inter-assay CV, the same three milk samples were extracted and cholesterol in the milk fat extract was measured on ten consecutive days using each time a different plate with its respective corresponding standard curve.
Methodology validation
For validation of the methodology, three milk samples were extracted and measured five times as described above and the results (mean, sd and CV) were compared against those obtained by GC-FID according to accredited methods for food analysis in Germany (DAP-PL-2268·00, § 64 LFGB, L 18·00/10 2006–12). In brief, after acidic and alkaline hydrolysis of the sample the lipids were extracted with diethylether. The extract was concentrated and the produced TMS derivative was quantified via GC-FID. 5α-Cholestane was used as internal standard.
Recovery study
Linearity of the method was studied by spiking 0·27 and 0·56 mm-cholesterol (C 3045, Sigma Aldrich Co.), respectively, to 20 milk samples, whose cholesterol concentrations were measured beforehand. The initial values (milk without addition of external cholesterol) ranged from 0·19 to 0·33 mm, so the cholesterol spikes were aimed to approximately duplicate (0·46–0·60 mm) and triplicate (0·73–0·87 mm) the initial amounts of cholesterol.
Factors affecting milk cholesterol concentration
Udder quarters
Raw milk from the four different quarters was separately sampled during milking using a single quarter milking claw. After volume measurement, two aliquots were separated for the composition analysis as described. To study whether the observed differences were individual and time-constant, the procedure was performed for five individuals during five consecutive days.
Milk fraction
Based on the actual milk yield for each animal, the milking procedure was divided in four fractions corresponding to 25, 50, 75 and 100% of removed milk. Milk samples were obtained from five cows during five consecutive days.
Intra-individual variation
The intra-individual variation of milk cholesterol concentration during a period of time was tested on five individuals, from which a milk sample was obtained and analysed on five consecutive days.
Calculations
The amount of cholesterol in the milk fat [mg/100 g fat] was calculated as cholesterol [mg/dl]×100/raw milk fat [%].
The statistical evaluation was carried out using the statistic package SIGMASTAT 3.0 (Jandel Scientific, Los Angeles, CA). Results not differing significantly from a normal distribution as indicated by the Kolmogorov-Smirnov-test are presented as means and standard deviations. Comparisons of means were done by ANOVA and one way repeated ANOVA in the case of repeated measurements on the same individuals. The coefficient of variation was calculated as sd/mean×100. The recovery of spiked concentrations was calculated as analysed value/expected value×100. Differences were classified as significant if P<0·05.
Results and Discussion
Standard curve
The standard curve had a high linearity (R2=0·97−0·99) and could be precisely replicated between assays (Fig. 1). Very rare experiments with an R2 less than 0·95 were discarded and repeated.
Sample stability
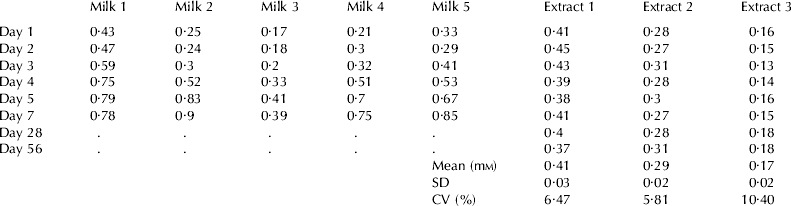
Unless the raw milk sample is stored frozen, the separation of the fat extract within the first 48 hours after milking is a crucial step. Apparent levels of the analyte increased from the third day after sampling probably due to chemical modifications in the natural process of raw milk degradation (Table 1). However, when the milk fat portion was extracted within the first 48 h no significant variation was observed even when measuring the fat extract after a period of eight weeks.
Sample stability. Five milk samples, stored at 4°C and three milk fat extracts, prepared within 48 h of milking, were separated into aliquots and measured during a period of 7 and 56 days respectively

Intra- and inter-assay coefficient of variation
Satisfactory mean intra-assay and inter-assay coefficients of variation (CV) of 4·8±1·2% (n=3) and 9·1±1·7% (n=3), respectively, were obtained.
Methodology validation
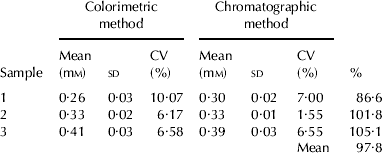
Comparison between the purposed colorimetric technique and gas chromatography showed acceptable results (Table 2). Obtained mean values were highly comparable (97·8% mean deviation between both methodologies) and the intra-assay sd and CV were on very similar ranges.
Methodology validation. Three different milk samples were each extracted five times and cholesterol (mm) was measured by colorimetric technique and gas chromatography in parallel

Recovery study
The recovery of 0·27 mm spiked cholesterol was 98·1±14·9%. After spiking 0·56 mm cholesterol, a recovery of 106·3±11·8% was found. Thus, a mean linearity value of 0·976 was obtained (n=20).
Factors affecting milk cholesterol concentration
Udder quarters
Milk composition did not show any statistically significant difference between the four udder quarters of an animal. The mean variance of milk cholesterol concentration based on means from 5 d was indicated by a CV of 8·5±1·0%; the corresponding CVs for milk fat, milk protein and amount of cholesterol in the milk fat were 2·9±0·5%, 0·9±0·2% and 10·7±0·9%, respectively.
Milk fraction
As known from the literature (Ontsuoka et al. Reference Ontsuoka, Bruckmaier and Blum2003), total fat content increased during the milking procedure, in contrast to protein and lactose content, which were lowest in the last milking fractions (Table 3). As expected for a lipophilic molecule, milk cholesterol increased in parallel to fat percent and was more concentrated in the last than in the initial fractions of the milking, with a 2- to 4-fold significant increase from start to end (P<0·001). However and interestingly, the cholesterol/fat relationship (measured as mg cholesterol per 100 g fat) showed a significant decrease from the first to the fourth milking fraction (P<0·001) suggesting that, even when cholesterol behaves as a lipid molecule, its mechanisms of transport into milk may differ at some point from those known for other lipids.
Composition differences between the four different milking fractions (n=5)
Values are mean±standard deviation. The CV is depicted in brackets.

a,b,c,d Different superscripts indicate significant differences (P<0·05) between different milk fractions
Intra-individual variation
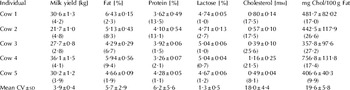
Five animals were tested for variation of milk parameters during a period of five consecutive days (Table 4). The fat concentrations in the raw milk from five cows during five consecutive days were high compared with breed standards; results may be due to the advanced lactation stage of some cows tested. Mean day-to-day variation was low for the fat concentration (CV 5·7±2·9%) as well as protein and lactose concentration (CV 6·2±5·6% and CV 1·3±0·5%). The variation of cholesterol levels and amount of cholesterol in the fat fraction were markedly larger (CV 18±4·4%; CV 19·6±5·8%). Milk cholesterol was shown to be on a 10-fold lower range of concentration than blood cholesterol, normally ranging 2 to 7 mm. All these results reinforce the hypothesis that the cholesterol molecule may be affected by more specific mechanisms of transport and level regulation.
Variation of the milk parameters of 5 individual animals during a period of five days (n=5)
Values are mean±standard deviation. The CV is depicted in brackets.

In summary, the presented method for measurement of cholesterol concentrations in milk samples was demonstrated to be a fast and reliable alternative to established standard methods and useful for the investigation of a high number of samples in routine analysis. All parameters reflecting the quality of the method (inter- and intra-assay CV, linearity, standard curve adjustment) were on well satisfactory margins. As well, the comparison of this methodology against gas chromatography showed very satisfactory results, leading us to purpose this methodology as an easier, faster and more economic alternative to traditional chromatographic procedures. The separation of the milk fat portion demonstrated to be a crucial step that has to occur within the two first days following sampling, but once the extract is isolated, analysis of samples performed within long periods of time demonstrated to achieve reliable results. Milk cholesterol concentration did neither vary between udder quarters nor between days of sampling. However, a representative sub-sample from the total milking is required as fat and cholesterol concentrations increase drastically during the milking process, with the highest cholesterol content appearing at the end.
The authors thank Stefanie Dommel for the technical expertise.