Introduction
Blue-ice areas are, together with the dry valleys and some coastal regions, the only regions in Antarctica where the surface mass balance is negative. Since they are located on the leeward sides of mountain ridges or nunataks, they cover only a small part of Antarctica. The principal causes for their existence are: (1) low accumulation rates due to reduced snow-drift divergence in the wind shadow of mountains and surface smoothness, and (2) high ablation rates through sublimation(Reference Orheim and LucchittaOrheim and Lucchitta,1990). Blue-ice areas have been observed invarious mountainous regions in Antarctica (Reference SchyttSchytt,1961;Van Autenboer, 1964; Reference Takahashi, Naruse, Nakawo and MacTakahashi and others,1988).
As part of the SWEDARP (Swedish Antarctic Research Program) expedition to Antarctica, the authors stayed at the Swedish research station Svea (74˚35'S, 11˚13' W, 1250 m a.s.l.) from 23 December 1992 until 12February 1993. Svea is located in a U-shaped, north west south east oriented valley called Scharflenbergbotnen(Fig. 1). Inside this valley a large blue-ice area (2 x5 km2) is located. Scharffenbergbotnen is located in Heimefrontfjella, a northeast--southwest orientated mountain range that reaches a maximum height of approximately 2500 m. During the 7 week measuring period, detailed observations of the meteorological conditions in and around the valley were carried out.
Map showing the location of Heime front Jella in Antarctica. The measuring sites are shown in the lower panel

The purpose of the present study is to reveal differences in energy balance and sublimation rates between the blue-ice area and the surrounding snowfields. Furthermore, typical flow types and boundary-layer profiles are discussed. Since changes in the blue-ice area's extent are possibly related to climate change(Reference Orheim and LucchittaOrheim and Lucchitta, 1990), this study can be seen as a first step towards understanding the complex relation between local climate and blue-ice area extent
Instrumentation and Location of measuring Sites
In the vicinity of this blue-ice area, meteorological quantities and surface-energy fluxes vary on a spatial scale of 1–5 km. Therefore, measurements were carried out on seven sites in and around Scharffenbergbotnen within an area of 3 × 18km2 (Fig. 1, lower panel). Site 2 is located on blue ice at the south eastern most part of the valley where the sublimation rates arc at a maximum(Reference Jonssonjonsson, 1992). Site 3 is situated near the north west entrance of the valley on a snow ridge dividing the two major blue-ice fields inside the valley. Both sites 4 and 5 are situated outside the valley and are assumed to represent conditions typical for the plateau Ritscherflya. Site I should represent conditions for the higher plateau Pionerflaket. Two additional measuring sites (6 and 7) are situated on smaller blue-ice fields on the western side of the valley.
At all sites masts were placed containing sensors for wind direction, wind speed, temperature (ventilated,relative humidity (ventilated; only at sites 2, 3 and 7),short-wave incoming and reflected radiation (sites 1, 2, 3,5 and 7), and total downward and upward radiation(sites 2 and 3). Temperature, humidity and wind-speed measurements were carried out at two or three heights (6,2 and 0.5 m). At site 3, snow temperatures were taken at five levels (5 10,20,40 and 80cm depth). The sampling frequency of all sensors was 2 min. Data were transmitted about every hour to the computer at Svea where they were stored. This allowed on-line graphical display of the data with the advantage of good insight into on-going physical processes. Some electronic problems were encountered, probably related to drifting snow and low temperatures, causing some gaps in the data sets of sites 1and 5. The accuracy of the temperature, relative humidity, wind-speed and wind-direction sensors are 0.2˚C, 3%, 0.2 ms1 and 4˚, respectively. The components of short-wave and all-wave radiation are accurate to 2 and 3W m2, respectively.
To study vertical profiles in the atmospheric boundary layer, cable-balloon soundings were carried out near Svea up to a height of approximately 2250 m. A tethersonde connected to the balloon measured wind speed, wind direction, temperature, relative humidity and pressure. Soundings were undertaken regularly (every 6 h) when wind speed did not exceed 10ms1. On nine selected days, soundings were taken every 3 h.
Synoptic observations were also made during the measuring period. Every 3 h, cloud type and cloud amount were observed. For more details concerning the equipment and data-acquisition routine we refer to Reference Bintanja, van den Broeke and PortangerBintanja and others (1993).
Meteorological Conditions
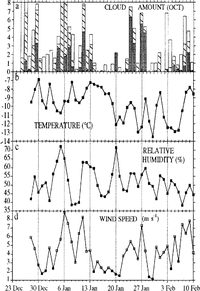
The daily mean meteorological parameters measured at site 3 are shown in figure 2. A slight cooling trend can be detected, indicating that the summer period is ending. Periods of bad weather passed through, characterized by high winds from casterly directions and large amounts of low cloud and occasionally precipitation. These periods are clearly associated with cyclonic activity near the coast, when humid air is advected inland. However, most of the time fair weather, characterized by light winds and small amounts of cloud, occurred. During these periods, a local circulation could develop within the valley with occasionally westerly winds. Outside the valley (site 5) this local circulation could hardly be recognized
Daily averaged values of (a) cloud amount, (b) temperature, (c) relative humidity and (d) wind speed, measured at site 3. In (a), low clouds are indicated by dark gray areas, middle clouds by hatched areas and high clouds by white areas. In (d), days with predominantly easterly winds are indicated by white dots while days with westerly winds are indicated by black dots.

The average cloud amount is 3.1 octas (low clouds 0.9,middle clouds 1.2 and high clouds 1.0). During periods of air weather, cumulus clouds were sometimes observed, indicating boundary-layer convection.
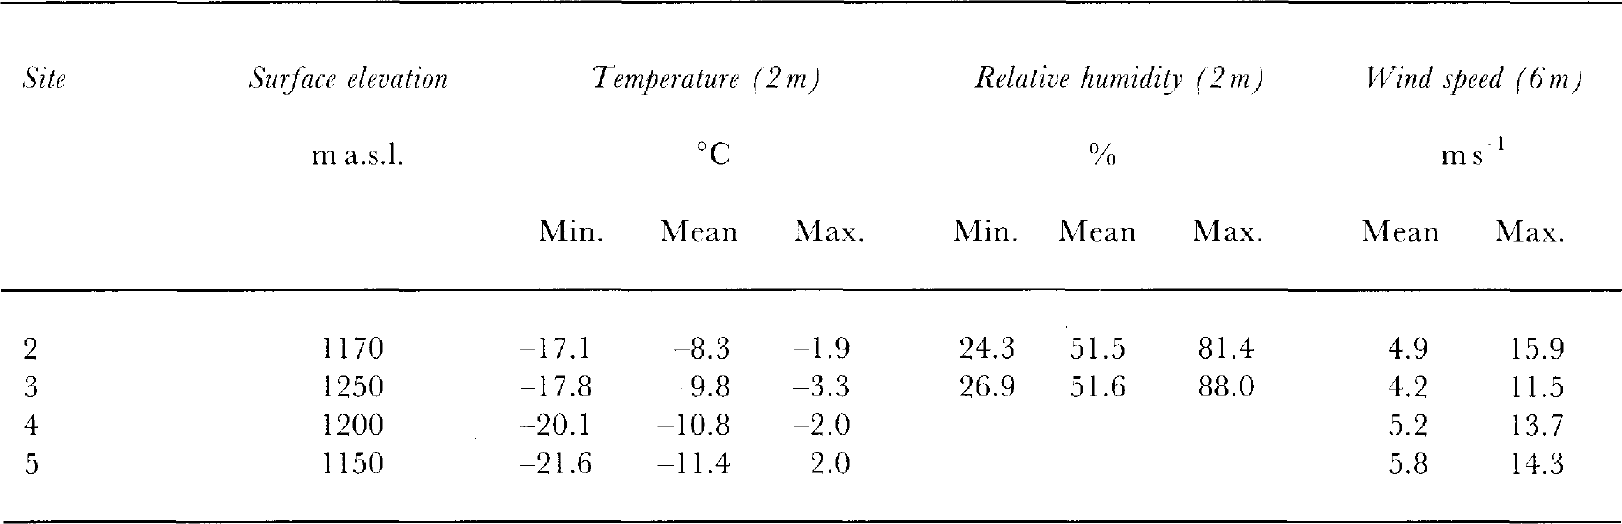
The mean and extreme data measured at sites 2, 3, 4 and 5 are given in Table1. Since the elevation differences between the sites are less than 100 m, the higher temperature within the valley is indicative of a warmer local climate. Especially at night-time, these temperature differences are pronounced. Also, the valley is more or less sheltered from the large-scale katabatic winds, as shown by the lower mean surface wind speed at site 3 which is in the centre of the valley away from gustiness next to the rock wall.
Comparing these values with measurements of January 1988 (Reference JonssonJonsson, 1992), we should note that the 1992- 93 temperatures are 3.5˚C lower, relative humidity is 5% lower and wind speeds are 0.5 ms-1 higher. This is indicative of the inter-annual variability of the summer time weather characteristics in this region. This was also noted by (Reference JonssonJonsson, 1992), who compared inter-annual variations in weather conditions, ablation rates and melt phenomena
Surface-Energy Balance
The surface-energy balance over Antarctic snow surfaces has been extensively studied, e.g. Reference WellerWeller (1980), Reference CarrollCarroll (1982) and Reference Wendler, Ishikawa and KodamaWendler and others (1988). However, the energy balance of blue-ice areas is relatively unknown.Reference Fujii and KusunokiFujii and Kusunoki (1982) attempted to relate calculated blue-ice sublimation rates to measured values but treated only the latent-heat flux
We will evaluate the total surface-energy balance both on blue ice (site 2) and snow (sites 3 and 5). The differences between valley and plateau should follow from a comparison of sites 5 and 3. The period 1 January--10February 1993 (41 d) was used.
The surface-energy-balance equation can generally be written as (fluxes towards the surface are positive):

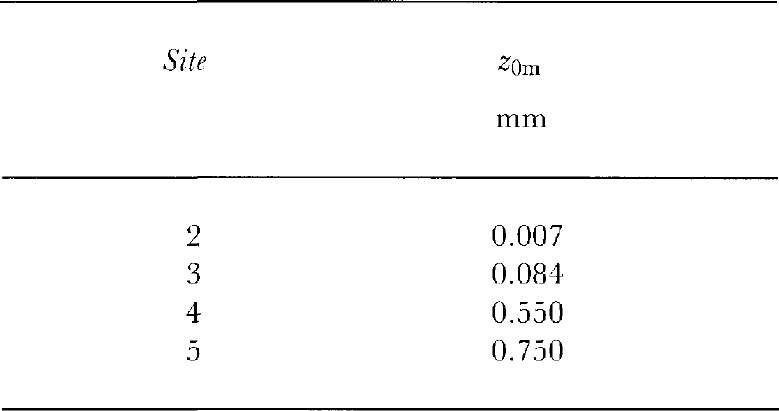
where S is net short-wave radiative flux, L is net long wave radiative flux, H is turbulent sensible-heat flux, LE is turbulent latent-heat flux and G is energy flux in snow or ice (heat conduction and penetrating short-wave radiation). Since we did not directly measure all components of Equation (1), we employed a simple model to evaluate the energy balance (Reference KnapKnap, 1992). The net short-wave radiation and the incoming part of the net long-wave radiation L↓are taken from the measurements. The outgoing long-wave radiation L↑ is calculated from the surface temperature T s with L↑=σT 3 4in which the surface emissivity is assumed to equal unity. The turbulent fluxes H and LE are calculated using the Monin Obhukov similarity theory with stability corrections from Reference DyerDyer (1974) and Reference DuynkerkeDuynkerke (1991). In the surface layer, the fluxes are assumed to be constant with height. The flux-profile relationships can then be integrated analytically between two heights. However, by applying two heights in the atmosphere, this procedure yields unrealistically large fluxes on some occasions. Errors in the potential temperature gradient 3-0.5°C can lead to uncertainties in the sensible-heat flux of 100 W m2 or more under unstable conditions, due to the importance of convective turbulence. Since measured temperature gradients could be in error by upto 0.4°C, it was decided to use surface values (zero wind speed, calculated surface temperature and specific humidity calculated using the surface temperature, assuming saturation) and one level in the atmosphere to calculate the turbulent fluxes. Then, surface-roughness lengths for momentum (Z0m), heat (Z0h) and moisture(Z0q) have to be used. Values of Z0m can easily be estimated from the assumption of a logarithmic wind speed profile under adiabatic conditions (|z/ L mo| ≤0.03at 2 m with L mothe Monin-Obhukov length) and arclisted in Table 2 Obviously, Z0m increases going from smooth ice (site 2) via relatively smooth snow (site 3) to more irregular snow surfaces (sites 4 and 5). We assume that Z0h and Z0q are equal to Z0m Snow/ice temperatures in the top 80 cm are calculated using the well-known thermodynamic equation:

Mean and extreme meteorological data for the period 28 December 1992 10 February 1993, evaluated from hourlymean values
where ρ is measured density of snow (400kgm-3) or ice (850 kg -3) c p is specific-heat capacity at constant pressure(2 x 10³ J kg-1 K-1), K is conductivity of snow (0.3 W m-1 K-1)or ice (5.2W m-1K-1), S(z) is penetrated short-wave radiation at depth z and z is the coordinate normal to the surface. The first term on the right hand side represents molecular diffusion as well as convective processes (in snow).The last term of the right hand side of Equation (2)represents the amount of absorbed short-wave radiation. This amount decreases exponentially with depth, with extinction coefficients 1.3 m1 (ice) and 20 m1(snow)(Reference Greuell, Oerlemans and OerlemansGreuell and Oerlemans, 1989). From an initial snow/ice temperature profile and input from hourly mean measured values of S, L↓, wind speed (2m), temperature (0.8m) and specific humidity (0.8 m), the model calculates the surface heat fluxes. Then, from the surface-energy balance(Equation (1)) and assumption of constant conductive flux at 0.8 m, a new snow/ice temperature profile is calculated .Eventually, the surface-heat fluxes and snow/ice temperature profiles for a given period are evaluated using this iterative procedure. Obviously, the surface temperature is the most important variable to be solved, since it determines all heat fluxes except S and L↓
Values of the surface-roughness length for momentum (z0m), calculated From wind-speed profiles under adiabatic conditions
For calculating the energy balance at site 5, initial snow temperature, incoming long-wave radiation and relative humidity arc taken from site 3. An increase in relative humidity of 7.5% going from site 3 to site 5 is assumed(Reference JonssonJonsson, 1992).
The calculated and measured snow temperatures at site 3 compare well, given uncertainties in the measurements and calculations (Fig. 3). The calculated daily mean temperatures at all depths do not differ by more than 2°C from the measured ones, except for 2 d at 5 cm depth. This good agreement means that we may have some confidence in the modeled surface-heat fluxes
Calculated daily mean snow temperatures and difference between measured and calculated snow temperatures at three depths at site 3.

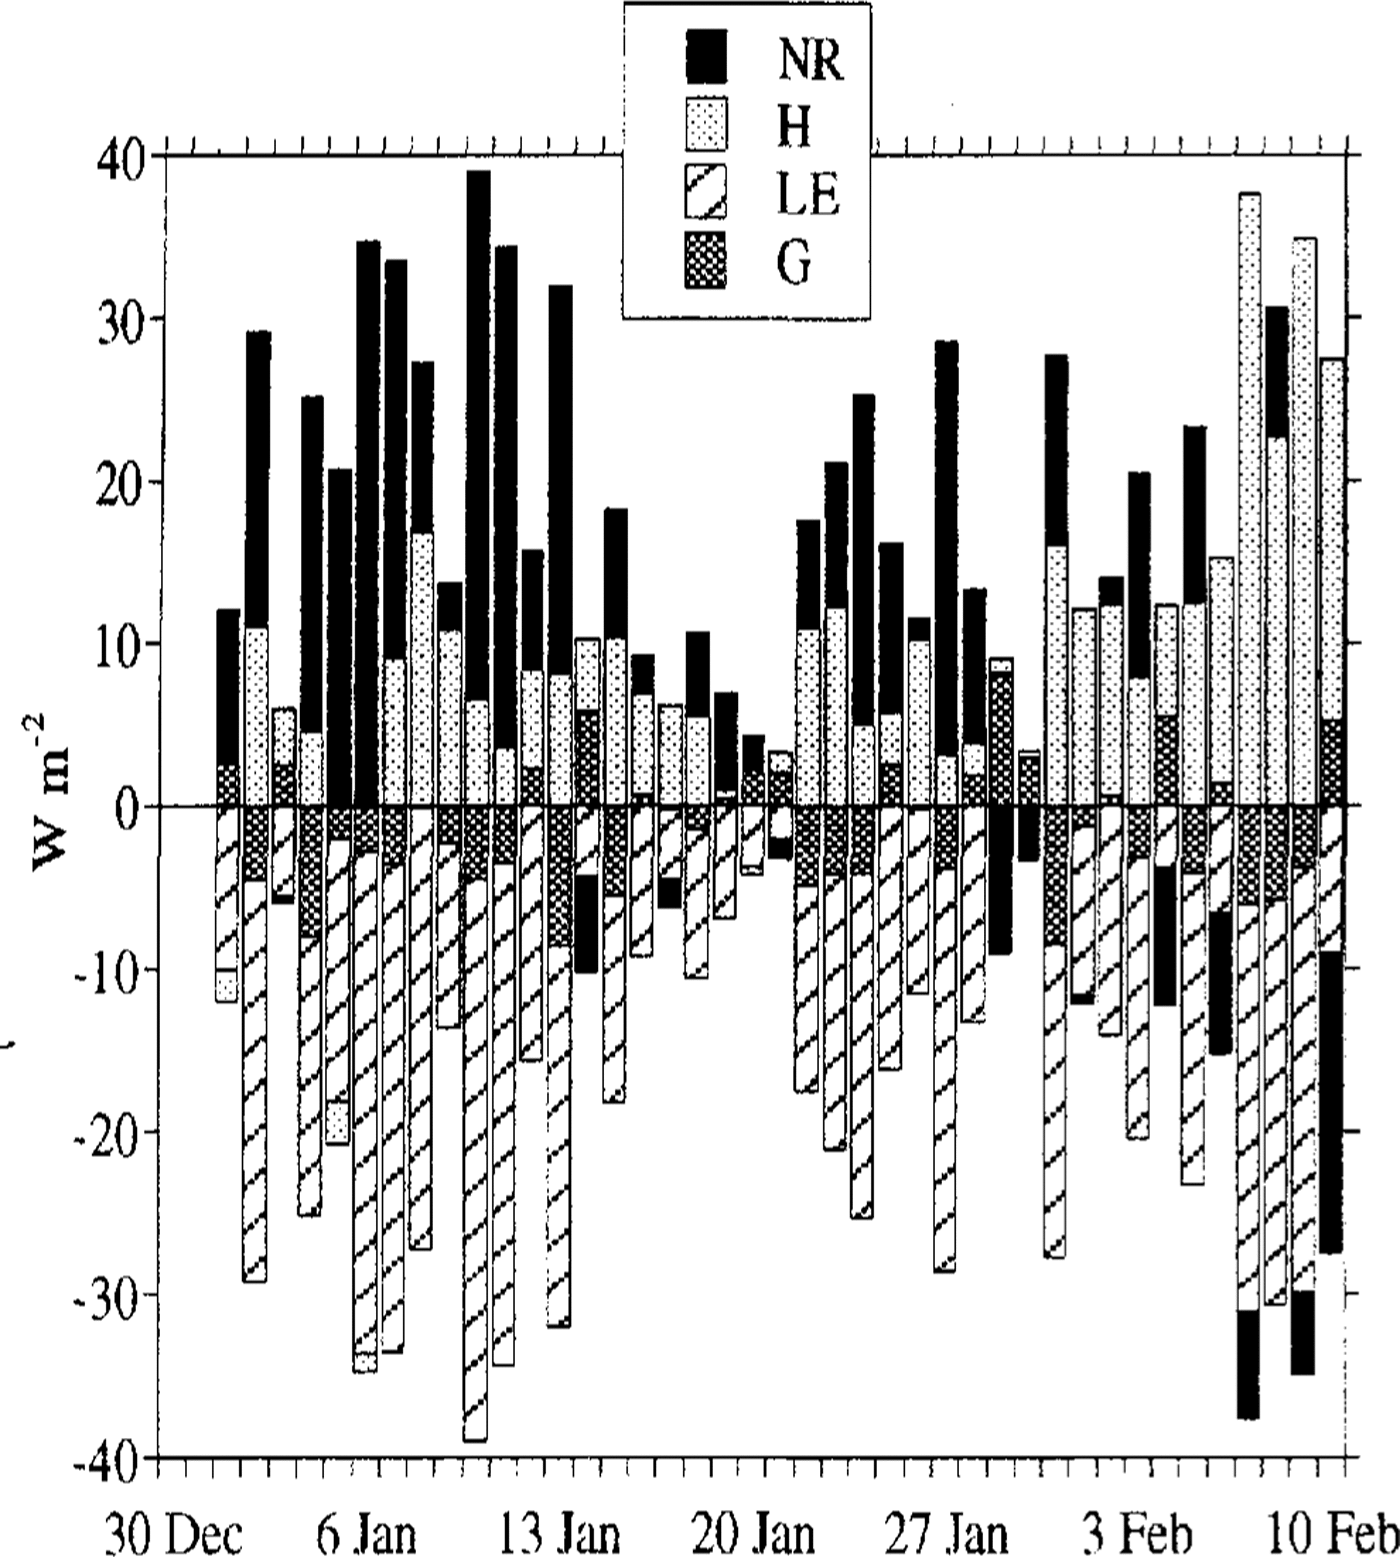
Figure 4 shows the daily mean surface-heat fluxes at site 3. The net radiation and sensible-heat fluxes are the two main heating terms, while energy is lost through sublimation and warming of the snow. Comparing the net radiation with cloudiness observations (Fig. 2), one can see an increasing net radiation with increasing cloudiness. This phenomenon is known as the radiation paradox and is typical for highly reflecting surfaces (Reference Wendler, Ishikawa and KodamaWendler and others, 1988). Generally, we may state that, in the presence of clouds in combination with high wind speeds(depression activity), large surface fluxes occur where as in the case of fair weather and light winds the surface fluxesare very small.
Dailv averaged values of the surface energy balance components at site 3. N R is net radiation (N RS + L). Fluxes towards the surface are positive
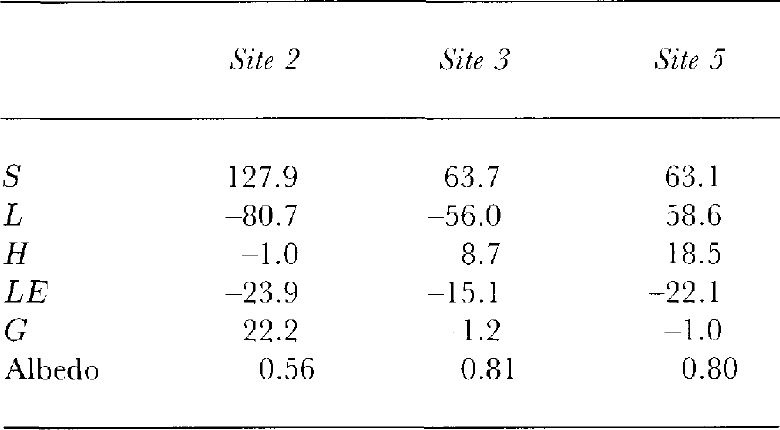
Mean surface-energy fluxes and mean albedo for the period 1 January 1992-10 February 1993. Fluxes towards the surface are positive. Symbols are explained in the text?
The average diurnal cycle in the surface-heat fluxes at sites 2, 3 and 5 is depicted in Figure 5. The main difference between ice and snow surfaces is the net shortwave, radiation caused by the albedo difference (Table 3).Over ice, the heat is mainly used to warm the ice during daytime but, over snow, energy is mainly lost by the latent-heat flux and net long-wave radiation. The warming of the ice is very effective through a large penetration depth for short-wave radiation and strong diffusion (large conductivity K). The larger surface heating causes a longer period of unstable stratification indicated by a negative sensible-heat flux. At night-time, cooling of the air over the ice is counter acted by the large upward heat flux in the ice, keeping the surface temperature relatively high. The main difference between sites 3 and 5 is the greater turbulent fluxes at site 5,caused by the greater wind speeds and greater surface roughness values
Mean daily cycle of the surface-heat fluxes at (a)site 2, (b) site 3 and (c) site 5for the period 1 January 10 February 1993. Fluxes towards the surface are positive

InTable 3, the mean values over the measuring period are shown. In contrast to snow-covered areas, on blue-ice areas the sensible-heat flux is very small. The latent-heat flux is highest at site 2, where the largest sublimation rate was expected. However, only 78% of the ablation measured at a nearby stake (0.94 mmw.e.d-1)can be explained by this latent-heat flux. The latent-heat flux is smaller over snow, as expected. However, the sublimation rates over snow are still considerable, especially at site 5. In general, the surface-energy fluxes over snow compare well qualitatively with results of Reference Wendler, Ishikawa and KodamaWender and others (1988). Since sublimation rates in and around a blue-ice area do not seem to vary much, this suggests that the dominant process determining the formation and maintenance of blue-ice areas is the divergence of drifting snow
The value of the latent-heat flux at site 5 should be interpreted with caution, because a constant relative-humidity difference between sites 3 and 5 is assumed. Assuming this difference is 12.5% instead of 7.5%, the latent-heat flux decreases by 2.6 W m-2 accompanied by small changes in H, Land G. Furthermore, the assumption of equal surface-roughness values probably yields an over estimation of the fluxes at site 5. As stated by Reference Beljaars and HoltslagBeljaars and Holtslag (1991), an interfacial sub-layer exists near the surface where the scalar-transfer processes arc dominated by diffusion. In the case of aero dynamically rough flow, momentum is transferred to the surface by pressure forces on the roughness elements. Then, the heat- and moisture-roughness lengths will probably be considerably smaller than z0m (Reference BrutsaertBrutsaert, 1982). In the case of laminar flow (z 0min the order of the diffusion-roughness length v/u*. 103m, with v the molecular diffusion coefficient for momentum and u*the friction velocity), the momentum exchange will be determined by diffusion. It is clear that at site 5 aero dynamically rough flow exists, in contrast to sites 2 and 3. As a result, the absolute value of the turbulent fluxes at site 5 would decrease by 4.3 Wm-2if Z0h and Z0q are assumed to be one order of magnitude smaller than z0m . However, even then the latent-heat flux is of the same order as at site 3.
Local Circulation
The continental-scale Antarctic katabatic winds are famous for their persistence and, especially near the coast, their strength. The strength of the Antarctic continental-scale katabatic winds depends on the magnitude of the terrane slope and the temperature deficit of the boundary layer compared to the free atmosphere. In summer, the temperature deficit will be largest during the night and smallest during daytime, when heating of the surface partially or totally removes the surface-temperature inversion. In regions sufficiently close to the coast, like Heimefrontfjella, the synoptic pressure gradient is another important factor determining the strength of the flow. Finally, the permanently warmer coastal environment will lead to a cross-slope thermal wind, as proposed by Reference Kodama, Wendler and IshikawaKodama and others (1989). During earlier measurements, the predominant surface-wind direction outside Scharffenbergbotnen was easterly (Reference JonssonJonsson, 1992), directed 50˚ to the left of the fall line (which is oriented in a southeast-northwest direction).
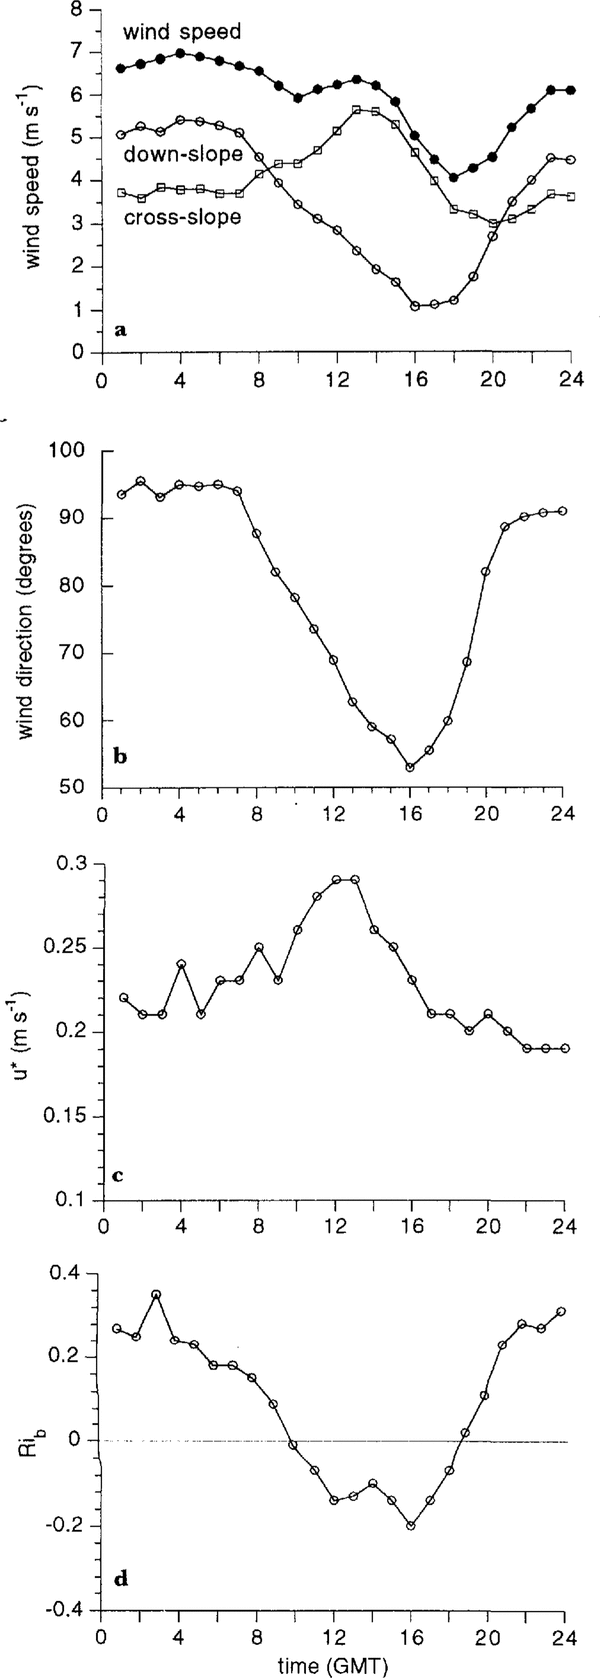
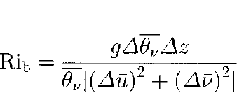
A period of 42d (31 December 1992-10 February1993) was studied. Some mean characteristics of the surface wind outside the valley (site 5) are given in Figure 6. The wind speed shows a double maximum at 0400 and 1400GMT and the wind direction swings from 095° at night towards 050°in the afternoon. The surface-wind direction (Fig. 6b) is strongly related to the bulk Richardson number (Rib) (Fig. 6d) that we introduce as a measure of stability of the surface layer:
Mean daily cycle for the period 31 December 1992 10 February 1993 of (a) wind speed, cross- and down-slope components, (b) wind direction, (c) friction velocity and (d) bulk Richards on number for site 5 outside the valley

where u andv are the zonal and meridional components of wind, g is the acceleration of gravity, z is the height above the surface and θv is the virtual potential temperature. Differences in temperature and wind speed are taken between 2 and 6 m. At night, when the surface layer is very stably stratified (large Rib), the katabatic or down-slope forcing increases, leading to strong surface winds balanced by down-slope forcing, Coriolis forcing and frictional forces. When the surface-energy balance becomes positive at 0600 GMT, the stability decreases rapidly and the boundary layer becomes unstably stratified at 1000 GMT. The surface-layer air is mixed vertically and the surface winds will be directed along the upper-air geostrophic flow. In the absence of a synoptic pressure gradient and katabatic forcing, the cross-slope flow is entirely due to the mesoscale horizontal temperature gradient between the ice cap and the coastal environment (Fig. 6a). This mechanism of daily variation of the boundary layer onun disturbed Antarctic slopes in summer was first proposed by Reference Kodama, Wendler and IshikawaKodama and others (1989) based on measurements in Terre Adélie, and is confirmed by our measurements outside the valley
The build-up of a high-pressure ridge in the Weddell Sea will cause lulls in the katabatic winds, e.g. in the period 14-21 January (Fig. 2). During these periods, the surface wind within the valley becomes weak and mostly westerly during day time, indicating the development of a local circulation. Moreover, during the short night, the generally light wind speeds will enhance strong cooling of the sloping surface, inducing shallow katabatic flow at all measuring sites: cold air, with a typical vertical extent of only 10-20 m, streams along the local fall-line into the depression of the valley and stagnates there. If the local slope does not coincide with the regional fall-line, as is the case for the masts near and within the depression, the formation of these shallow flows will dramatically decrease the surface-directional constancy (defined as the ratio of vector mean wind speed and absolute mean wind speed).
Mean surface-wind speed (6m), directional constancy(6m) and friction velocity (2-6 m) at four sites for days without local circulation (type 1) and days with local circulation (type 2)
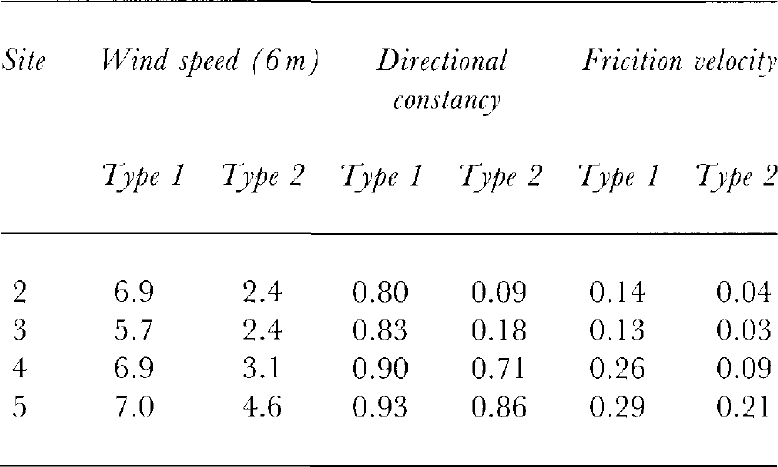
A distinction is made between days without (type 1)and days with (type 2) the formation of a local circulation. Both types occurred about equally frequently(23 and 19d, respectively).Table 4 clearly shows that, especially within the valley, the mean wind speed, friction velocity and directional constancy near the surface are much lower during days with a local circulation.
Since the surface wind in the valley is strongly influenced by these shallow flows, the structure of the local circulation can best be studied using vertical soundings. Time-height cross-sections of mean cross-slope(northeast-southwest) wind speed and directional constancy at Svca arc given in Figure 7, averaged for a6 d period with small synoptic forcing (14-19 January1993) when regular soundings were carried out (every 3 h). No regular variation could be detected in the down-slope (southeast-northwest) component (Fig. 1),which is not shown here (note that with “down-slope” the regional slope is meant instead of the local slope of the terrane).
Mean time-height cross-section of (a) cross-slope (northeast-southwest) wind component and (b) wind-directional constancy at the base camp for a 6 d period (14–19 January) in which a local circulation developed.

figure 7ashows that, on days with a local circulation, westerly winds are present near the surface, whereas above 400 m easterly winds persist throughout the day. These surface wester lies did not occur outside the valley at site 5. In the afternoon, during adiabatic conditions, the upper air circulation quickly penetrates towards the surface in the valley. figure 7b dearly demonstrates the semi-permanent features of mesoscale forcing of the casterly winds during the day and the slope-dependency of the shallow katabatic winds at night (high directional constancy). The weak westerly local winds are characterized by low directional constancy.
Concluding Remarks
Results are presented from measurements carried out in the period December 1992-February 1993 in Heimefrontfjella, Dronning Maud Land, East Antarctica. Detailed meteorological measurements were carried out in the immediate vicinity of a blue-ice area, on ice as well as on snow. Mean temperatures during the 7 week measuring period ranged from -8.3°C at site 2 to -11.4°Cat site 5, indicating the warm local climate within the valley where the blue-ice field is located. The surface-energy balance is evaluated using a simple model and measured meteorological parameters. The differences in the surface-energy balance between snow and ice (larger net short-wave radiation accompanied by larger negative contributions of net long-wave radiation, turbulent fluxes and conductive flux) can be attributed mainly to differences in albedo, surface roughness, thermal conductivity and short-wave radiation extinction coefficient. The latent-heat flux, which is responsible for loss of mass and therefore one of the factors influencing the extent of the blue-ice field, seems to be fairly independent of surface type, We can therefore conclude that other factors, such as reduced snow drift divergence behind nunataks, arc more important for the formation and maintenance of blue-ice areas.
Some typical characteristics of the circulation have been described, such as the large-scale katabatic flow. The forcing mechanisms are night-time radiative cooling at the surface and the mesoscale horizontal temperature gradient during daytime. In the case of a dominant high-pressure ridge in the Weddell Sea, the easterly katabatic wind is replaced by westerly winds near the surface. This local circulation leads to lower wind speeds in the valley and hence lower turbulent exchange (see Table 4 and Figure 5). The local circulation therefore limits the sublimation rate within the valley.
Acknowledgements
We should like to thank the Swedish and Norwegian expedition members for their help and support during the expedition. We are grateful to P. Duynkerke, W.Knap and J. Oerlemans for advice and discussions. M.Portanger is acknowledged [or technical and electronic assistance. Financial support was provided by the Netherlands Organization for Scientific Research(NWO), the Dutch National Research Programme on Global Air Pollution and Climate Change (NOP),and the Netherlands Marine Research Foundation(SOZ).