I. INTRODUCTION
Electrical power generation from waste heatReference Tritt and Subramanian1 requires thermoelectric materials with high stability, low cost, benign nature, and high figure of merit ZT above 500 K, where ZT = α2/ρκ, α is the Seebeck coefficient, ρ is the electrical resistivity, κ is thermal conductivity, and T is the absolute temperature. Oxide materials are nontoxic and have high oxidation resistance and thermal stability, which make them suitable candidates for high temperature industrial thermoelectric applications.Reference Koumoto, Terasaki and Funahashi2 As p-type materials, cobalt oxide-based layered structures and their derivatives have been recognized as having fairly high thermoelectric performance reaching ZT up to unity and higher.Reference Funahashi, Matsubara, Ikuta and Takeuchi3, Reference Terasaki, Sasago and Uchinokura4 However, search for a high efficiency n-type oxide is still going on. The discovery of Al: ZnOReference Tsubota, Ohtaki, Eguchi and Arai5 system as a promising n-type thermoelectric material paved the path for further exploration of ZnO material for this purpose. Characteristics such as wide band gap and inherent native defects are the basis of its excellent charge carrier transport propertiesReference Ozgur, Alivov, Liu, Teke, Reshchikov, Dogan, Avrutin, Cho and Morkoc6 that can be further improved through doping. Several reports were published on improving thermoelectric properties of ZnO either through different synthesis techniquesReference Kim, Shim, Shim, Niihara and Hojo7–Reference Fujishiro, Miyata, Awano and Maeda9 or by using different dopant ions into the lattice structure.Reference Ohtaki, Tsubota, Eguchi and Arai10–Reference Orikasa, Hayashi and Muranaka12 Doping of group III elements such as aluminumReference Ohtaki, Tsubota, Eguchi and Arai10, Reference Wiff, Kinemuchi, Kaga, Ito and Watari11 and indiumReference Orikasa, Hayashi and Muranaka12 into ZnO have been widely explored. On the other hand, little work has been reported on the thermoelectric properties of Ga-doped ZnO.Reference Cook, Harringa and Vining13, Reference Bhosle, Tiwari and Narayan14 It has been suggested in earlier reports that Ga not only acts as a donor itself but also changes the oxygen vacancy characteristics of ZnO resulting in a further increase in carrier concentration.Reference Bhosle, Tiwari and Narayan14 Ga, being a group III element, is certainly an interesting candidate for enhancing the thermoelectric performance of ZnO. We have used ball milling method to synthesize our samples. Ball milling is effective in inducing chemical reactions, which do not normally happen at room temperature,Reference Gutman15 and is a versatile technique for the production of a range of materials.Reference Suryanarayana16 In this work, we have systematically studied thermoelectric performance of Ga-doped ZnO thermoelectric oxide as a function of synthesis conditions and techniques.
II. EXPERIMENTAL DETAILS
Two sets of samples belonging to the Zn1−xGaxO (x = 0, 0.003, 0.005, 0.01) series were prepared using zinc oxide (ZnO, 99.99%) and gallium oxide (Ga2O3, 99.99%) as obtained from Sigma Aldrich (New South Wales, Australia). Two standard synthesis procedures, i.e., conventional solid-state reaction method (SSR) and low-energy (LE) and high-energy (HE) ball milling processing were adopted. For the SSR method, the starting powders were mixed thoroughly in appropriate proportions and were calcined at 800 °C for 24 h in air. The resulting powders were reground, pressed into rectangular pellets, and sintered at 1300 °C for 36 h in air. For the ball milling method, the conditions of ball milling were optimized by testing three procedures—LE dry milling (200 rpm), LE wet milling (200 rpm), and HE wet milling (750 rpm). For wet milling, ethanol was used as the medium. Starting powders were mixed in stoichiometric quantities in a tungsten vial containing ethanol and tungsten balls. Then, the powder mixtures were ball milled at mentioned speeds for 24 h. Afterward, tungsten balls were removed and the slurry was dried in vacuum for 24 h. Dry powders were then pressed into rectangular pellets (1 × 3 × 10 mm3) under 40 MPa and sintered at 1300 °C for 12 h in air.
Crystal structures of the as-synthesized samples were examined by x-ray diffraction (XRD) analysis technique (GBC MMA, Melbourne, Australia) using Cu Kα radiation (λ = 1.54056 Å) in a 2θ range of 30°–70°. XRD patterns were carefully analyzed using Rietveld refinement method using Rietica software package (version 1.7.7). The morphology and the microstructure of the samples were examined by a field emission scanning electron microscope (JEOL7500 FA, New South Wales, Australia). Sample densities were measured using Archimedes principle. Room temperature Seebeck coefficient, thermal conductivity, and electrical conductivity were obtained using physical property measurement system (Quantum Design, San Diego, CA). High temperature measurements of Seebeck coefficient and electrical conductivity were made by static DC method (ULVAC ZEM-3, Kanagawa, Japan) with temperature gradients of 20, 30, and 40 °C. All the thermoelectric measurements were carried out in vacuum.
III. RESULTS AND DISCUSSION
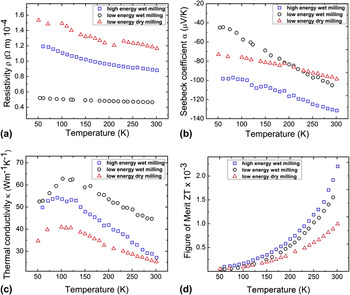
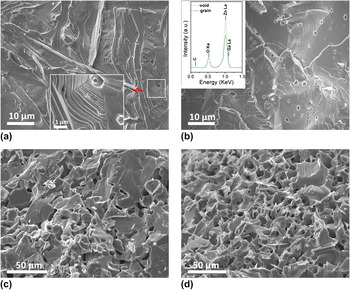
Figure 1 shows low temperature (50–300 K) thermoelectric properties of as-sintered Zn0.995Ga0.005O sample prepared under three different ball milling regimes. The sintered sample obtained through LE dry ball milled powders showed highest electrical resistivity [Fig. 1(a)] of 1.16 × 10⁻⁴ Ωm and the lowest thermal conductivity [Fig. 1(c)] of κ = 25.33 W/mK. We have confirmed that these features were mainly influenced by the presence of tungsten impurities in the samples (tungsten was identified during XRD measurements). Such impurities originated from the high friction collision of the powder with the tungsten balls and the vial. These tungsten impurities are capable to act as scattering centers for both phonon and charge carriers, hence, reducing thermal as well as electrical conductivity. To eliminate the friction during millings, ethanol was added as a medium and, consequently, no tungsten impurities were detected in the wet milled samples. The LE (200 rpm) wet ball milled sample was the least resistive at room temperature with ρ = 0.46 × 10⁻⁴ Ωm followed by the HE (750 rpm) wet milled sample with ρ = 0.88 × 10⁻⁴ Ωm [Fig. 1(a)]. HE ball milling is known to produce lattice disorders and high density of point defects,Reference Vinesh, Bhargava, Lakshmi and Venugopalan17–Reference Pablo, Pedro, Victorino, Jorge Sánchez, María, José, Inés Puente and Jesús19 which might act as carrier scatterers due to which the resistivity of HE sample is higher than LE sample. It appears that the differences in the properties of the samples prepared through three different ball milling conditions are not completely intrinsic but strongly depended on the sample preparation method. Surface morphology studies for the HE ball milled samples showed that the particle size of the initial powder was reduced to orders of nanometers, ∼60 and ∼30 nm for LE and HE wet milled samples, respectively. The density of the samples derived from the powders pressed under 40 MPa was 5.02 g/cm3 (89.48% relative density) and 4.89 g/cm3 (87.16 relative density) for LE and HE wet milled sample, respectively. Small particle size of HE wet milled powder resulted in the increased number of voids (∼900 nm average diameter)Reference Liu, Kong, Ma and Shi20 in the compact disk, which explains the lower density. After sintering, the number of voids decreased considerably giving a void structure in a densely sintered ZnO matrix with a relative sample density of 96% [Figs. 2(a) and 2(b)]. This kind of void structure was not observed for the LE wet milled sample. The nanograins produced during ball milling contain high degree of dislocations. The void formation in the HE samples is assumed to be the direct result of the high degree of disorder, mainly at grain boundaries caused by HE ball milling. This kind of void formation has been reported for other systems as well.Reference Huang, Wu and Ye18 Field emission scanning electron microscopy (FESEM) images [Figs. 2(a) and 2(b)] of the surface and the cross section of the as-sintered Zn0.995Ga0.005O (HE wet milled) sample show a dense microstructure, which consists of voids, roughly ∼900 nm in size. The energy dispersive x-ray spectroscopy (EDS) data acquired from the grain and the void area as shown in the inset of Fig. 2(b). It revealed that the void area (void/grain interface) has less oxygen and more zinc as compared with the grain area. Taking these factors into account, we conclude that on the grain–void interface, the amount of oxygen vacancies and zinc interstitials are higher, which act as n-type donors. In addition, the presence of voids in HE wet milled sample facilitated decrease of the thermal conductivity, which was ∼28% lower than that for the LE wet milled sample. Such decrease in thermal conductivity resulted in highest room temperature figure of merit [Fig. 1(d)] among the samples from the three different regimes tested.
Temperature (T) dependencies of the (a) electrical resistivity (ρ), (b) Seebeck coefficient (α), (c) thermal conductivity (κ), and (d) the figure of merit (ZT) for as-sintered Zn0.995Ga0.005O sample prepared by HE wet ball milling.

FESEM images of (a) surface and (b) cross section of as-sintered HE wet ball milled Zn0.995Ga0.005O sample. Inset in (a) represents magnified view of the void in the sample and inset in (b) represents the EDS showing oxygen and zinc spectra collected from the grain area and the void area. (c) and (d) show FESEM images of Zn0.995Ga0.005O and Zn0.99Ga0.01O samples prepared by SSR method.

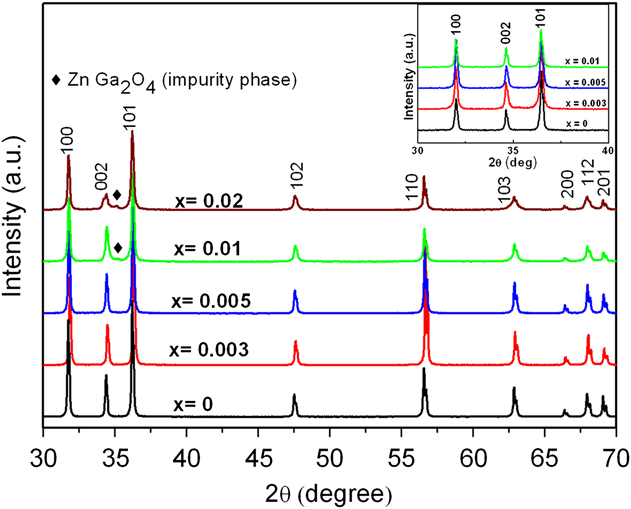
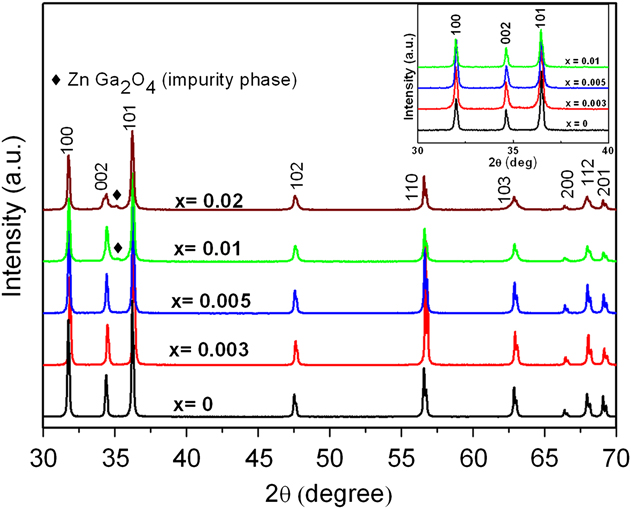
To further test the effectiveness of HE wet ball milling technique to achieve better thermoelectric properties, we prepared Ga-doped ZnO samples using conventional SSR. To eliminate any other heat treatment factors, all SSR samples were sintered under the same conditions. Figure 3 shows XRD patterns for Zn1−xGaxO (x = 0, 0.003, 0.005, 0.01) samples synthesized by HE wet ball milling and the inset in Fig. 3 shows XRD patterns for the SSR samples. All XRD patterns correspond to the hexagonal ZnO (JCPDF #75-0576) phase. For the HE wet milled samples, a ZnGa2O4 impurity peak was identified for samples having 1% or more Ga. However, SSR samples do not show any impurity phases. This can be directly attributed to the different particle formation mechanisms in SSR and ball milling methods. In the course of ball milling, the nucleation of nanocrystalline ZnO–Ga2O3 particles takes place by solid-state diffusion between them. Both the collision temperatures and the particle size favor the formation mechanism, which might allow the formation of secondary phase for higher Ga concentration.
XRD patterns of the as-sintered Zn1−xGaxO (x = 0, 0.003, 0.005, 0.01) samples prepared by HE wet ball milling. Inset shows section of the XRD patterns for SSR samples.
Figures 2(c) and 2(d) shows the FESEM images of the as-sintered Zn0.995Ga0.005O and Zn0.99Ga0.01O samples respectively, prepared by SSR method. The relative density of these samples was ∼87%, which is 11% lower than the density of the HE wet milled samples. The explanation of this density difference lies in the fact that the rate of sintering, often described as the elimination of pores, is approximately proportional to surface energy and inversely proportional to the grain size. Therefore, it is suggested that small grain size and large surface enhance densification,Reference Hynes, Doremus and Siegel21 as observed in the present case of HE wet milled samples.
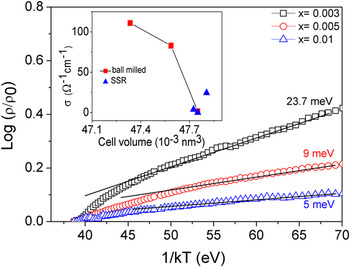
Unlike the case of SSR samples, the electrical conductivity (σ) of HE wet ball milled samples increases with decrease in unit cell volume, which implies effective substitution of Ga3+ in Zn2+ site (inset of Fig. 4). As the ionic radius of Ga3+ (76 pm) is smaller as compared to Zn2+ (88 pm), a decrease in the unit cell volume with increase in Ga doping is expected, which is the case with our HE wet ball milled samples. Also, the conductivity of HE wet ball milled samples (Fig. 5) is about 5-fold higher than that of the SSR samples, which can be attributed to relatively effective Ga incorporation in the ZnO lattice. Lower conductivity of SSR samples (Fig. 4) can also be related to the porous microstructure resulting in lower charge carrier mobility. Furthermore, it is reasonable to assume that in the SSR samples, Ga atoms act more like neutral defects rather than charge donors due to insufficient Ga substitution in Zn site, thus decreasing their contribution to the electrical conductivity and, thus, they might give rise to enhanced scattering potentials resulting in the localization of electronic states.Reference Paul and Sen22
Logarithm of resistivity versus 1/kT for as-sintered Zn1−xGaxO samples prepared by SSR method. (Inset shows electrical conductivity as a function of unit cell volume extracted from lattice parameter refinement for wet HE milled and SSR samples.)

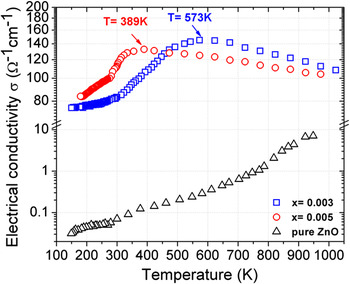
Electrical conductivity (σ) of HE wet ball milled Zn1−xGaxO (x = 0, 0.003, 0.005) samples in temperatures range 100–1000 K showing semiconductor–metal transition.

Electrical conductivity (σ) of SSR samples follows typical semiconducting behavior, i.e., it increases with increasing temperature (Fig. 4). The electrical conductivity (σ) increases as the Ga concentration increases, which can be explained by the expected increase in the free electron density due to the Ga addition.Reference Wang, Sleight and Cleary23 The activation energy was calculated according to the Eq. (1) asReference Das and Ganesan24:

where ∆E is the conductivity activation energy, k B is the Boltzmann constant, and  is the temperature independent part of resistivity. The activation energy of the SSR Zn1−xGaxO samples decreases with increasing doping level with 23.7, 9, and 5 meV for x = 0.003, 0.005, and 0.01, respectively. It is important to note that this is still higher than that of HE wet milled samples (Fig. 6). It is known that the activation energy decreases with increase in the grain size. This variation in the activation energy can be attributed to the changes in the barrier height due to the size of the grains in the polycrystalline material.Reference Das and Ganesan24 Therefore, higher activation energies in the SSR samples are a result of inhomogeneity, porous morphology, and large number of grain boundaries, making the grain boundary effect more pronounced in these samples as compared to the ball milled ones. In all respects, HE wet ball milling was proved as an efficient technique for producing high quality Ga-doped ZnO bulk samples.
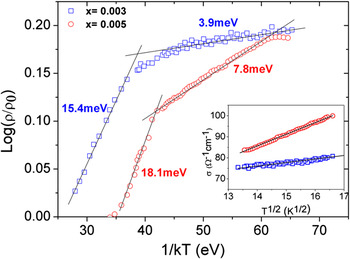
Logarithm of resistivity versus 1/kT for HE wet ball milled Zn1−xGaxO (0.003, 0.005) samples along with their activation energies. The resistivity is normalized by resistivity at 400 K. (The inset shows the plot of σ versus T 1/2 at temperatures between 165 and 300 K. Straight line represents weak localization in this temperature range.)

Figure 5 shows electrical conductivity (σ) of HE wet ball milled Zn1−xGaxO (x = 0, 0.003, 0.005) samples at high temperatures. Pure ZnO shows a semiconducting behavior throughout the temperature range studied, whereas Ga-doped ZnO shows a clear semiconductor–metal transition at temperatures 573 and 389 K for x = 0.003 and 0.005, respectively. The conductivity of Ga-doped ZnO is ∼3 orders of magnitude higher than that of pure ZnO at room temperature and ∼2 orders of magnitude higher at 1000 K. At higher temperatures, Ga-doped ZnO becomes degenerate and shows a metallic behavior.Reference Mott25 The metallic conductivity can be explained using Mott’s theory,Reference Alexander and Holcomb26 which says that as the interdonor atom spacing is reduced, free carriers do not appear until a critical concentration is reached. From the expression n c ≈ (0.25/a H)3, where a H is the atomic radius of the impurity atom under consideration, the critical concentration (n c) for Ga:ZnO system is 1019 cm−3 to make it degenerate.Reference Wang, Sleight and Cleary23 Now, the highest electrical conductivity achieved in our samples is ∼140 Ω−1/m for 0.3 at.% doping level. Comparing this result with the earlier reported work on this system, we observe that our doping levels are much lower than what is required (∼2 at.%) to achieve such high electrical conductivity.Reference Wang, Sleight and Cleary23 Furthermore, a very high carrier concentration of ≈1020 cm−3 is required to reach an electrical conductivity of σ ≈ 140 Ω−1/m as per the literature.Reference Wang, Sleight and Cleary23 Although this comparison cannot be considered as conclusive, but we could still argue that with ≤5 at.% Ga doping level in ZnO, one cannot possibly achieve such high electrical conductivities which again points out to other contributions which in our case is oxygen vacancies. Our Ga doping levels are ≤0.5 at.%, which cannot be considered sufficient to achieve such high carrier concentrations.Reference Wang, Sleight and Cleary23 It has been suggested earlier that Ga not only acts as a donor itself but also changes the oxygen vacancy characteristics.Reference Bhosle, Tiwari and Narayan14 The significant difference in bond length between the Ga atoms and the nearest neighbor atoms compared to the ideal Zn–O bond length can induce large lattice strains around the Ga impurities, which can make the formation of compensating defects such as oxygen vacancies easier around the impurities.Reference Park, Zhang and Wei27 Therefore, we can say that metallic conductivity at high temperatures in Ga-doped ZnO is a result of a combined effect of Ga substitution and formation of oxygen vacancies.Reference Bhosle, Tiwari and Narayan14Figure 6 shows the logarithmic plot of resistivity normalized by the resistivity at 400 K versus 1/kT for Zn1−xGaxO (x = 0.003, 0.005). Different energy ranges were identified where the curve has a linear behavior. Activation energy of Zn0.997Ga0.003O as determined from the slopes is 15.4 meV in the 1/kT range of 27.28–37.38 eV and 3.9 meV in the 1/kT range of 41.92–66.40 eV. For Zn0.995Ga0.005O sample, the activation energies of 18.1 meV in the 1/kT range of 35.73–42 eV and 7.8 meV in the 1/kT range of 42.04–61.35 eV were obtained. It has been suggested earlier that for Ga-doped ZnO system, the electrons are weakly localized at low temperatures.Reference Bhosle, Tiwari and Narayan28 Electrical conductivity in a weakly localized regime is given by the Eq. (2) asReference Bhosle, Tiwari and Narayan28, Reference Shimakawa, Narushima, Hosono and Kawazoe29:
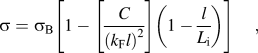
where σB is the Boltzmann’s conductivity, C is a constant of the order 1, l is the mean free path, and Li is the inelastic diffusion length. Also, an expression σ α T 1/2 becomes valid in this regime. Inset in Fig. 6 is a plot of conductivity versus T 1/2 for the Ga-doped samples. The constant slope suggests that the conductivity is governed by the weak localizations at temperatures lower than room temperature. A similar observation has been reported earlier for Ga-doped ZnO thin films by Bhosle et al.Reference Bhosle, Tiwari and Narayan14 They suggested that with decrease in temperature, L i increases and consequently becomes equal to the distance between Ga atoms, which results in the constructive interference of the electrons and, hence, localization occurs. For the Ga-doped samples at temperatures about and above 300 K, there is a further increase in conductivity representing relatively deeper donor levels located at 15.4 and 18.1 meV for Zn0.997Ga0.003O and Zn0.995Ga0.005O, respectively. The origin of these donor levels could not be understood completely but they can be a result of a void structure. As mentioned earlier, these voids consist of oxygen vacancies and zinc interstitials, which act as n-type donors. Therefore, we speculate that the voids can be considered electrically charged, creating a potential energy barrier, which can impede the motion of the carriers, thereby reducing their mobility. This idea comes from the basic understanding of disordered grain boundaries, which trap the carriers and become electrically charged.Reference Seto30 The transition toward metallic conduction occurs at T = 573 K for Zn0.997Ga0.003O and T = 389 K for Zn0.995Ga0.005O where the electrons are considered to be completely delocalized. For our samples, the metal–semiconductor transition and, hence, delocalization occurs at much higher temperatures than those reported for Ga-doped thin films (93–170 K).Reference Bhosle, Tiwari and Narayan14 This can be explained by considering higher disorder caused due to the presence of voids and other factors such as native defects. Higher disorder causes the electrons to interfere at shorter values of L i, thus increasing the temperature at which localization takes place.
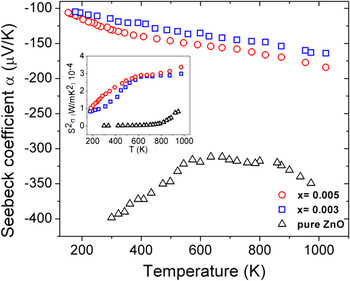
Figure 7 shows dependence of the Seebeck coefficient (α) on temperature (T). Seebeck coefficient is negative within the whole temperature range examined indicating n-type conduction. Undoped ZnO exhibits a room temperature α300 K ∼ 398.31 μV/K and a high temperature α1000 K ∼ 350 μV/K. For Ga-doped ZnO, α increases with increasing doping and reaches a value of −164 μV/K for and −185 μV/K at 1000 K, which is ∼30–45% higher than the values previously reported for Zn:Ga system.Reference Cook, Harringa and Vining13, Reference Kinemuchi, Nakano, Mikami, Kobayashi, Watari and Hotta31 The reason for high α can be correlated to the presence of voids. With the assumption of a potential barrier existing at the voids interface, it can be argued that at some extent, in our samples, energy filtering effect is responsible for the large Seebeck coefficient. We report a power factor of 3.7 × 10⁻⁴ W/mK2 at 1000 K, which is comparable to the previously reported values for this system.Reference Cook, Harringa and Vining13, Reference Kinemuchi, Nakano, Mikami, Kobayashi, Watari and Hotta31 The voids also proved to be successful in reducing the thermal conductivity (κ) of ZnO due to the increase in phonon scattering centers. The room temperature κ for nanovoid structured Ga:ZnO (HE wet milled Ga:ZnO) [Fig. 1(c)] is measured as 27 W/mK, which is considerably lower than the reported values for the nonnanostructured bulk ZnO sample which is generally ∼40 W/mK.Reference Tsubota, Ohtaki, Eguchi and Arai5 Although κ at high temperatures was not measured, we speculate that at high temperatures, this characteristic must have been improved because of the peculiar microstructure of the samples. Further exploration of high temperature thermal conductivity of Ga-doped ZnO samples is needed.
High temperature measurement of Seebeck coefficient for HE wet ball milled Zn1−xGaxO (0.003, 0.005) samples. (The inset shows the Power factor.)

For extrinsic n-type semiconductors with negligible hole conduction, electrical conductivity and Seebeck coefficient can be expressed asReference Zhu, Hopper, Ingram and Mason32:

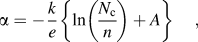
where e is the electronic charge, n is the electron concentration, N c is the conduction band density of states (DOS), k is the Boltzmann constant, μ is the carrier mobility, and A is the transport constant. From Eqs. (3) and (4), one arrives at a simple relationship between Seebeck coefficient and electrical conductivity

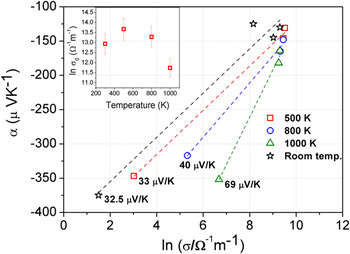
where “+” is for the n-type case (our case) and “−” is for p-type case. Here, σ0 = N ceμexp(A) is largely governed by the DOS-μ product. Thus, a plot of Seebeck coefficient on the natural logarithm of conductivity possesses the slope of k/e (86.15 μV/K), and the intersection with x-axis corresponds to ln σ0. The Jonker plot of our HE wet ball milled Zn0.995Ga0.005O sample for different temperatures (room temperature, 500, 800, 1000 K) is summarized in Fig. 8. The gradual increase in the slope can be seen with respect to the operating temperature. A discrepancy very similar to the one reported earlier for Al: ZnOReference Kinemuchi, Ito, Kaga, Aoki and Watari33 can be observed in our data as well, i.e., the slope did not coincide with k/e (86.15 μV/K) and ranged between 32.5 μV/K for room temperature and 69 μV/K for 1000 K. The inset in Fig. 8 summarizes the trend of ln σ0 with the temperature, where ln σ0 initially increases with temperature and then follows an opposite trend at temperatures higher than ∼500 K. As the extrapolated intercept, ln σ0, is essentially governed by the DOS-μ product, it can be assumed that this variation in ln σ0 is due to the variation of the mobility with temperature. However, it is important to note that ln σ0 still acts as an index of optimum condition.Reference Kinemuchi, Ito, Kaga, Aoki and Watari33
Jonker plot at different temperatures along with the slopes. The inset shows the intersections of Jonker plot at different temperatures. Here, ln σ0 is the intersection with the x-axis in the Jonker plot analysis.

Now, maximum power factor is reached when ln σ = ln σ0 − 2. As ln σ0 is highest for ∼500 K, therefore, it comes out that PFmax (calculated as 3.8 × 10⁻³ W/mK2) should appear near the conductivity of 1170 Ω−1/cm at ∼500 K. Also, the predicted conductivity at 1000 K (169 Ω−1/cm) is much lower than that at 500 K. This implies that although the predicted values do not match with those experimentally obtained, the trend in conductivity does coincide. The temperatures around 500 K prove to be interesting for our void structured Ga-doped ZnO sample. However, a more thorough analysis using mobility and carrier concentration measurements is required to precisely recognize the role of voids that are believed to be detrimental for the enhancement of thermoelectric properties of our Ga-doped ZnO samples. Also, a better optimization of ball milling conditions such as milling time, milling speed, wet milling agent, etc. might be helpful in obtaining power factor predicted by Jonker plot analysis.
IV. CONCLUSIONS
In summary, thermoelectric properties and their dependence on the sample processing methods for bulk Ga-doped ZnO system were studied. Three different processing parameters were used for synthesizing ball milled samples, with HE wet ball milling regime being the best in terms of samples’ thermoelectric performance. The microstructure of the prepared HE wet ball milled samples showed highly dense layered structures containing large number of voids that penetrate the body of the samples. Wet milled samples were found to have a metal–semiconductor transition at temperatures 573 K for 0.3% and 389 K for 0.5% Ga-doped samples. It was determined that donor levels are located at 3.9 and 7.8 meV under the conduction band and deeper donor levels were also located at 15.4 and 18.1 meV for 0.3 and 0.5 at.% doped samples, respectively. These donor levels were presumably due to the presence of voids in the structure; Jonker plot analysis was used to analyze the performance of the void structured Ga:ZnO system through which a very high PFmax of 3.8 × 10⁻³ W/mK2 was predicted for the optimum conductivity of 1170 Ω−1/cm at ∼500 K.
ACKNOWLEDGMENTS
G.P. thanks the Australian Research Council for support under Discovery Grant DP0 879 714. P.J. thanks the University of Wollongong for providing matching scholarship for her Ph.D. studies. X.W. thanks the Australian Research Council for support under Discovery Grant DP1 094 073.