I. INTRODUCTION
Tungsten is remarkable for its robustness, high heat conductivity, and low sputtering erosion, and it has the highest melting point for all the nonalloyed metals. Due to the above advantages, tungsten becomes one of the important candidates of the plasma facing materials (PFM), and is most probable to be used as the first wall material in the future fusion reactor. The properties of tungsten, such as recrystallization behavior, the ductile-to-brittle transition and thermal stability, have been investigated experimentally and theoretically. Reference Cheng, Mrovec and Gumbsch1–Reference Tan, Luo, Lu, Luo, Zan, Cheng and Wu6 However, the study on the fatigue crack growth in tungsten is still rather poor. As PFM, tungsten is supposed to bear high thermal loads, which could induce high thermal stresses and the formation of crack. The crack propagation in tungsten will cause the fatal destruction of the components. Therefore, it is important to understand the fracture mechanisms of tungsten due to the crack propagation.
Recently, the fatigue crack extension behavior has been widely discussed by molecular dynamics (MD) simulations. Much research shows that the crack propagation and dislocation emission are influenced by the crack orientation. Reference Potirniche, Hearndon, Horstemeyer and Ling7–Reference Ma, Xiao, Deng and Hu11 In addition, there are many other factors influencing the mode of crack growth. Lee et al. Reference Lee and Tomar12 analyzed the influence of grain boundary property variation on rupture resistance of poly-crystalline tungsten. The results showed that the change of 10% in GB fracture energy caused significantly different crack patterns with different main crack extension direction and the density of microcracks. And, grain boundaries play an important role in crack propagation, Ma Reference Ma, Xiao, Deng and Hu13 have examined the effect of ∑3 and ∑5 on crack growth in bcc iron under cyclic loading, and found that ∑3 caused the brittle fracture, while ∑5 resisted crack extension. Besides, the loading pattern had a significant effect on the behavior of fatigue crack growth, Reference Potirniche, Horstemeyer, Jelinek and Wagner14,Reference Machová, Pokluda, Uhnáková and Hora15 and void coalescence is an important damage mechanism at crack tip. Therefore, the study of the nucleation and growth of voids in ductile metals is significant for understanding of the fatigue failure. Zhao Reference Zhao, Chen, Shen and Lu16 discussed cylindrical nano-void growth in single crystal copper, and investigated the influence of the cell size, crystal orientation and original void volume fraction on the macroscopic stress–strain curve and incipient yield strength. Their results suggested that cell size had great effects on the incipient yield strength for a given void volume fraction.
Though MD simulation is widely used in fatigue crack propagation, the research of fatigue crack growth in tungsten is still poor. To discuss the influence of the anisotropic microstructure on the fracture toughness and brittle–ductile transition in tungsten, Ermile et al. Reference Gaganidze, Rupp and Aktaa17 extracted longitudinal, radial, and circumferential specimens. Their studies found that the microstructure of poly-crystalline tungsten played a notable role in crack propagation mechanism. Longitudinal specimens failed by predominantly intergranular fracture up to 800 K, whereas transgranular cleavage was observed at low test temperatures for radial and circumferentially oriented specimens. In addition, Yu et al. Reference Yu, Gou, Li and Zhang18 investigated the influence of hydrogen on the crack growth behavior in pre-cracked tungsten single-crystals, and the results showed that hydrogen could either enhance or reduce the ductility of tungsten. On one hand, high hydrogen concentration could lead to the rearrangement of tungsten atoms at crack front and facilitate the dislocation emission from the crack tip, which would delay the crack propagation. On the other hand, a void could be nucleated in a local hydrogen-rich area, which accelerated the crack propagation.
In this paper, we mainly focus on investigating the crack propagation path, microscopic deformation mechanism and failure mechanism in tungsten by analyzing microstructure evolution around the crack front under cyclic loading at different temperature. Besides, the ∑5 grain boundary models are constructed to discuss the effect of GB on the behavior of crack growth in tungsten. Finally, the crack growth rate is discussed by the variation of crack length.
II. MODELING DETAILS AND INTERATOMIC POTENTIAL
A. Modeling details
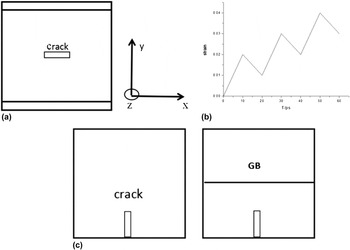
The crack model with a pre-existing center crack was constructed by removing some atoms in single crystal tungsten as shown in Fig. 1(a). The sizes of model were 150a × 150a × 40a in the x, y, and z directions, the length of initial crack was equal to 10a and its width was 2a, where a was the lattice constant of tungsten. The [001](010) crack and [10−1](101) crack were constructed, where (010) and (101) represent initial crack face, [001] and [10−1] represent the orientation of initial crack front. The loading were applied in [010] and [101] direction, respectively. Periodic boundary conditions were applied to x and z directions, and the free boundary condition was applied in y direction. In the MD simulations, the constant strain rate was 1 × 10⁹ s−1. The strain cyclic loading was applied in y axis with increasing strain amplitude. The initial constant strain amplitude of cyclic loading was 0.02 and the unloading ratio was 50%, which was illustrated in Fig. 1(b). Before cyclic loading, the crack models were relaxed by running 20 ps with a time step of 1 fs until the systems were equilibration and then were cyclically loaded. The number of cyclic loading for all the crack models ranged from 1 to 30. Furthermore, to discuss the effect of GB on fatigue crack growth behavior, a sample containing a ∑5 was constructed as sketched in Fig. 1(c). The strain cyclic loading was added in x axis with increasing strain amplitude. In these models, the free boundary condition was applied in y direction to stop the crack central vacancy from filling with ghost from the adjacent cells. Reference Zhang, Zhang, Qian and Wang19
Schematic illustration of initial crack models and the pattern of cyclic loading in tungsten: (a) a pre-existing center crack model, (b) the pattern of cyclic loading, and (c) containing a grain boundary model.

B. Interatomic potential
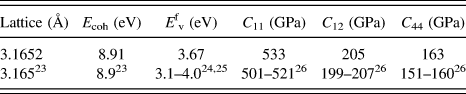
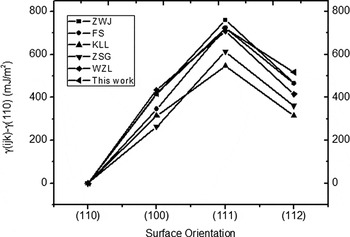
The embedded atom method (EAM) potential was adopted in MD simulations, which was constructed by Ackland et al., 20 and the form of this potential was given out by Han et al. Reference Han, Zepeda-Ruiz, Ackland, Car and Srolovitz21 Before performing the simulation, the fundamental lattice properties of this potential were calculated by the Large-scale Atomic/Molecular Massively Parallel Simulation (LAMMPS) Reference Plimpton22 code, such as elastic constant, lattice constant, vacancy formation energy, and binding energy as shown in Table I, that agreed well with experimental values. Reference Kittel23–Reference Bolef and De Klerk26 Meanwhile, the mechanical properties of this potential were also verified. Figure 2 showed relative energy difference of {100}, {111}, {112} with {110} surface. As shown, the calculated values of relative energy difference agreed well with other reference values. Reference Bonny, Terentyev, Bakaev, Grigorev and Van Neck27 More importantly, all potentials calculated {110} surface energy was the lowest, and specific values were presented in Table II. Although our values are less than experimental data, Reference Tyson and Miller28 it was consistent with other reference values within 6% error range. Furthermore, the stacking fault energy of 〈111〉 {112} system was calculated. The maximum stacking fault energy was 2136 mJ/m Reference Zhang, Ganeev, Wang, Liu and Alexandrov2 , that agreed well with the values of 2089, 2181, and 2346 mJ/m Reference Zhang, Ganeev, Wang, Liu and Alexandrov2 calculated by the potentials of KLL, JO, and FOI. Reference Bonny, Terentyev, Bakaev, Grigorev and Van Neck27 But a little bigger than the values of DFT and ZWJ Reference Bonny, Terentyev, Bakaev, Grigorev and Van Neck27 that correspond to 1760 and 1997 mJ/m Reference Zhang, Ganeev, Wang, Liu and Alexandrov2 , respectively.
The fundamental lattice properties of tungsten single crystals.

Relative energy difference of {100}, {111}, {112}, with {110} surface.

The specific values of (110) free surface energy.

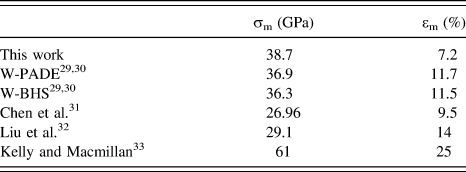
To understand the fracture behavior of single crystal tungsten under monotonic tensile along the [0 1 0] direction, we construct a model with the same size as [001](010) crack model but no crack. In addition, the constant strain rate of 1 × 10⁹ s−1 and room temperature were used for this simulation. The results and other calculations were presented in Table III. The peak stress in the [0 1 0] direction was 38.7 GPa in this work, that agreed well with the values of 36.3 and 36.9 GPa obtained from W-BHS and W-PADE, Reference Bachelet, Hamann and Schluter29,Reference Giusepponi and Celino30 respectively. But it had relatively large deviation from the reference value of 26.96, 29.1, and 61 GPa calculated by Chen et al., Reference Chen, Kecskes, Zhu and Wei31 Liu et al. Reference Liu, Zhou, Zhang, Jin and Lu32 and Kelly, Reference Kelly and Macmillan33 respectively. Moreover, the strain corresponding to maximum stress varied from 7.1% to 25%. Because all of the above values were estimated, so there was inevitable deviation. Based on the above test results, we could use this potential to simulate fatigue fracture behavior of single crystal tungsten. The following simulations were conducted by LAMMPS code, and the microstructure evolution was visualized by OVITIO, Reference Stukowski34 analyzed with the common neighbor analysis (CNA). Reference Honeycutt and Andersen35
The ideal tensile strength σm (GPa) and corresponding strain εm from our and other calculations in the [1 0 0] direction.

III. RESULT AND DISCUSSION
A. The microstructure evolution of [001](010) crack
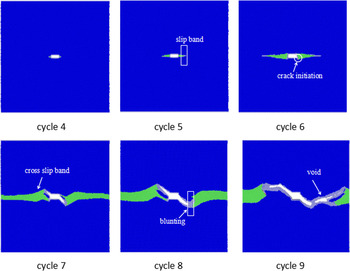
Figure 3 showed the process of evolution mechanisms of microstructures analyzed by CNA for [001](010) crack during cycle loading at 300 K. At cycle 4, the slip bands were observed at crack tip, which is caused by the stress concentration at crack tip, and the slip direction along the [110] directions. As the loading increased, the stress concentration was intense at crack tip, and the local slip bands extended around the crack tip at cycle 5. During this time, the peak stress calculated for the entirely cyclic loading process was 29.74 GPa and corresponding strain was 4.51%. The threshold stress intensity factor K
I was obtained from the Griffith level K
I = σ(πa)0.5, where σ is equal to 29.74 GPa and a is the crack length. In the present work, the K
I was 2.97 MPa
 $\sqrt {\rm{m}}$
, which was in good agreement with the experimental value of 3–3.5 MPa
 $\sqrt {\rm{m}}$
measured by Gludovatz et al. in the technically pure tungsten (W > 99.97%).
Reference Gludovatz, Wurster, Hoffmann and Pippan36
Up to the 6th cycle, the crack initiation arise in {110} planes and the value of Schmidt factor was equal to 0.408 this moment. This is in agreement with experimental observations that cleavage on the {110} planes in single crystal tungsten under tensile tests.
Reference Hull, Beardmore and Valintine37
At cycle 7, the crack length increased fast along {111} direction. Moreover, the cross slip band was also observed around crack tip, which was similar to the finding in bcc iron.
Reference Ma, Xiao, Deng and Hu13
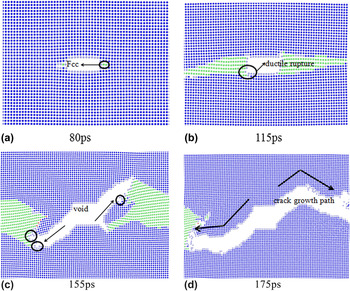
Before the cycle 8, the crack showed ductile rupture and the deformation mechanisms mainly manifested slip at crack tip. When the loading was further increasing, the crack grew as the form of void nucleation, void extension, and link. So the crack growth entered into the rapidly extending stage in cycle 8 and 9. From cycle 8 to cycle 9, the dominant deformation mechanism was void nucleation, and the crack showed brittleness advance. Figure 4 presented the deformation characteristic of crack tip and the evolution process of crack propagation path. In Fig. 4(a), the main deformation mechanism was the slip band at crack tip, and the slip direction was along 〈110〉 direction. Subsequently, the crack propagated presented ductile rupture, and the dominant deformation mechanism was also slip around crack tip, which was presented in Fig. 4(b). In Fig. 4(c), the deformation mechanism changed, it mainly showed void nucleation at crack tip. Based on the above analysis, the crack propagation path could be decomposed into the following parts. Firstly, the crack showed ductile rupture and the crack propagation path inclined to original crack plane at an angle of 45°. Next, the stress concentration was relaxed due to the formation of sip bands at crack tip, which inhibited the crack growth. Finally, the void nucleated and linked up with the original crack, which resulted in the changes of crack growth path as shown in Fig. 4(d). The similar path of crack propagation was observed experimentally.
Reference Gludovatz, Wurster, Hoffmann and Pippan36
The microstructure evolution analyzed by CNA on crack propagation for [001](010) crack in single crystal tungsten, the blue stand for bcc tungsten structure and green stand for fcc slip band structure.

Geometry of the deformation mechanism of crack growth and the evolution process of crack propagation path at (a) 80ps, (b) 115ps, (c) 155ps, and (d) 175ps.

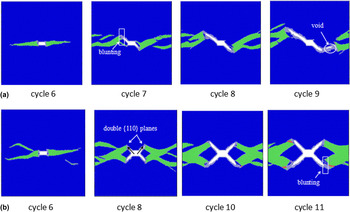
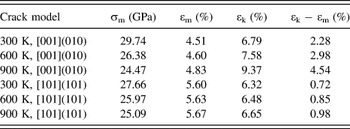
Figure 5 presented the microstructure evolution for [001](010) crack at 600 and 900 K. At a temperature of 600 K, more slip systems were activated and the blunt phenomenon was not significant as shown in Fig. 5(a). The maximum stress calculated under this temperature condition was 26.38 GPa and corresponding strain was 4.60%. As the temperature further increased, the plastic region broadened caused by more and more activated slip systems at cycle 6, which could be seen in Fig. 5(b). From cycle 8 to cycle 11, the crack expanded in double {110} planes due to more slip systems. During the whole process, crack propagation was in the form of ductile rupture, and the mechanisms of deformation mainly were slip and blunting. To further analyze the effect of temperature on fracture behavior, the maximum stress was also calculated under cyclic loading at 900 K as shown in Table IV. Usually, the stress–strain curve could be divided into four stages: elastic, plastic, damage, and failure stages. To better explain the effect of temperature on fracture behavior of single crystal tungsten, we calculated the strain of second stages (plastic). In the present work, the second stage was defined as the range from the peak stress to the lowest point of a sharp stress drop. Reference Kelly and Macmillan33 The results of maximum stress and various strain were shown in Table IV, where εk represented the strain of the lowest point in second stages of stress–strain curve. Based on the values of Table IV, we could have a conclusion that the plastic range became larger with the increase of temperature for [001](010) crack attributed to the activation of more slip systems in single crystal tungsten. What’s more, the plastic range at 900 K was almost twice as large as that of 300 K. In short, the temperature had a great influence on fracture behavior of [001](010) crack growth, and the ductility at elevated temperature was obviously higher than that at room temperature.
The microstructure evolution analyzed by CNA on crack propagation for [001](010) crack in single crystal tungsten at (a) 600 K and (b) 900 K. The blue stands for bcc tungsten structure, green stands for fcc slip band structure and red stands for hcp structure.

The peak stress, εm and εk for all models at different temperature.

B. [10−1](101) crack propagation behavior
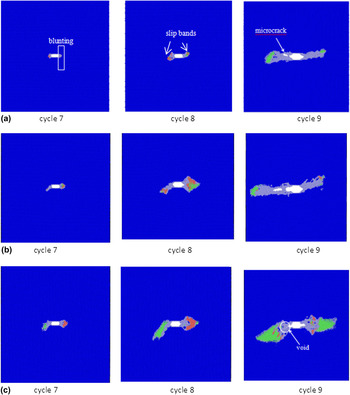
In this section, we simulated the deformation and fracture characteristics of [10−1](101) crack in single crystal tungsten at 300, 600, and 900 K. Figure 6(a) showed the evolution process of [10−1](101) crack in tungsten at 300 K. During the entire cyclic loading process, the peak stress was 27.66 GPa and corresponding strain was 5.6% as shown in Table IV. While the range between εm and εk was equal to 0.75%, which is much less than that of the [001](010) crack. The main reason for this difference was that the mechanisms of deformation and fracture behavior at crack tip changed. From cycle 7 to 8, the blunting was appeared at crack front due to the intense stress concentration. The plastic zone of crack tip was also formed near the crack tip. In addition, the fcc and hcp slip bands were also observed, which was induced by the movement of dislocations around the crack tip. When the loading was further increasing, the blunting extended and void nucleation formed in the front of the crack tip at cycle 9, and the crack showed brittleness propagation. With the increasing of temperature, the plastic deformation zone was more obvious. But the values of εk were almost unchanged, corresponding to 6.48% and 6.45%, respectively. Which indicated that the temperature had little effect on fracture behavior of [10−1](101) crack in single crystal tungsten, and the crack also showed the brittleness extension as observed in Figs. 6(b) and 6(c). Comparing [001](010) crack with [10−1](101) crack, we could draw the conclusion that the effect of temperature on deformation mechanism and fracture behavior of [001](010) crack was more significant than that of the latter.
The microstructure evolution analyzed by CNA on crack propagation for [10−1](101) crack in single crystal tungsten at (a) 300 K, (b) 600 K, and (c) 900 K. The blue stands for bcc tungsten structure, green stands for fcc slip band structure, and red stands for hcp structure.

C. Effect of grain boundary and temperature on crack growth
Grain boundaries generally act as dislocation obstacles, sinks, and sources in fatigue crack propagation behavior. When the stress exceeded a critical value of dislocation pileup, the material either yielded by transmission of slip to the neighboring grain or initiated microcrack at the boundary, Reference Hirth and Lothe38,Reference Nishimura and Miyazaki39 which depended on intrinsic material properties and on extrinsic factors such as the distribution of atom stresses, strain rate, or temperature. Wang et al. Reference Wang, Xu, Zhang and Song40 investigated the effects of grain size on the mechanical behavior of nano-polycrystal alpha-Fe under uniaxial tensile loading. Their found crack nucleated at the intersections of grain boundaries due to the stress to concentrate there. In this part, the ∑5 GB model was constructed to study the effect of GB on crack propagation at 5 and 100 K, and an additional model without grain boundary was also simulated at 5 K for comparison.
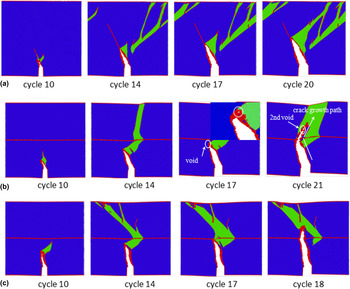
Figure 7(a) showed the fatigue crack growth for the no-grain boundary model from cycle 10 to 20. The result indicated that the dislocations emit along 〈111〉 direction, and the slip band was formed at crack tip due to the dislocation motion. When the loading increased, the crack expanded along 〈111〉 direction and showed ductile fracture before cycle 21. Up to cycle 21, the main deformation mechanisms were voids nucleation, and the crack presented brittleness fracture. Figure 7(b) showed the effect of ∑5 grain boundary on crack growth at 5 K. One can see that before cycle 10, there was no obvious difference from the no-grain boundary crack model. For the no-grain boundary crack model, up to cycle 17, the crack kept ductile fracture due to the release of stress caused by the extension and movement of slip bands at crack tip as shown in Fig. 7(a). But for the grain boundary crack model, due to the appearance of grain boundaries, the movement of the slip bands was blocked so that the stress concentration at crack tip was not be released, the crack propagated by voids nucleation as shown in the Fig. 7(b). At cycle 18, the crack grew to the grain boundaries. From cycle 18 to 20, the crack has no extension due to the appearance of grain boundaries. With the loading increasing, the secondary voids nucleated in the upper of grain boundaries and linked with the crack tip at cycle 21, which caused the change of crack propagation path. Similar to the above crack propagation process another process was reported experimentally by Yan and Fan in 2524 aluminum alloy. Reference Yan and Fan41 In their experiments, the change of the main crack propagation direction after it passed through the GB and continued to expand by linked with the microcracks ahead of the crack tip were observed. Figure 7(c) showed the simulated results of ∑5 grain boundary models at 100 K. Before cycle 18, there was no obvious difference on crack growth behavior from that at the temperature of 5 K. But at cycle 18, the crack passed through grain boundary and the obvious obstacles was not found. In summary, grain boundary resisted the crack growth before the crack reached near the grain boundary, while it was conducive to the nucleation of the secondary voids after the crack reached the grain boundary and changed the path of crack propagation. In addition, higher temperature favored voids nucleation, which resulted in the crack passing through grain boundary quickly.
The time evolution of crack growth (a) for nongrain boundary at 5 K, (b) for grain boundary at 5 K, and (c) for grain boundary at 100 K.

D. Crack growth rate
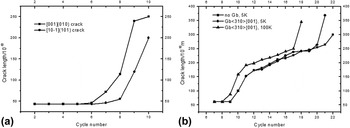
The variation of crack length with the number of cycles under cyclic loading was calculated. Figure 8(a) showed the crack growth rate of [001](010) and [10−1](101) cracks in single crystal tungsten at 300 K. The results showed that the [001](010) crack propagated relatively slow from cycle 6 to cycle 8. After cycle 8, the crack propagated rapidly due to the formation of void, so the crack growth rate increased as shown in Fig. 8(a). The [10−1](101) crack showed blunting phenomenon from cycle 6 to 8, therefore, the crack growth rate was very small. Subsequently, it increased rapidly due to the formation of voids. Figure 8(b) revealed the variation of crack length of ∑5〈310〉{110} crack models and 〈310〉{110} crack models. The results showed that there was similar trend about crack growth behavior in ∑5〈310〉{110} crack models and 〈310〉{110} crack models before cycle 15 at 5 K. During cycle 15 to 18, the crack growth rate of ∑5〈310〉{110} crack models was larger than 〈310〉{110} crack models. This was mostly because the ∑5 GB hindered the movement of slip bands so that stress concentration was intense at crack tip, and then the voids appeared at crack tip, and the crack extended rapidly. From cycle 18 to 19, due to the absence of grain boundary, the growth rate of ∑5〈310〉{110} crack models was smaller than that of 〈310〉{110} crack models. After cycle 19, the voids appeared over the grain boundary, so the crack extended rapidly again as shown in Fig. 8(b).
Crack growth rate (a) for different orientations and (b) for different models.

IV. CONCLUSION
In this study, we have performed the MD simulation to examine fatigue fracture mechanical behaviors of [001](010) and [10−1](101) crack at the temperature of 300, 600, and 900 K under cyclic loading in single tungsten. In [001](010) crack model at 300 K, the 〈111〉{110} slip system and slip band were observed in crack tip before cycle 8. During this period, the crack propagation showed ductile cracking. After cycle 8, the dominant deformation mechanism was void nucleation. So crack propagation showed brittleness. At higher temperature, crack propagation was in the form of ductile rupture, and the mechanisms of deformation were slip and blunting due to more slip systems activated. But for [10−1](101) crack, the deformed mechanism was blunt and void nucleation. Therefore, crack propagation showed brittleness. Meanwhile, we constructed the 〈310〉{001} crack model and explored the effect of ∑5 grain boundary and temperature on fatigue fracture mechanical behaviors. The results showed that the grain boundary resisted the crack growth before the crack reached the grain boundary, while it was conducive to the nucleation of the secondary voids after the crack reached the grain boundary and changed the path of crack propagation. In addition, higher temperature favored voids nucleation, which resulted in the crack passing through grain boundary quickly.
ACKNOWLEDGMENTS
This work is supported by the National Magnetic Confinement Fusion Science Program of China (Grant No. 2014GB104002), the National Natural Science Foundation of China (Grant No. U1530151, 51471068), and the Specialized Research Fund for the Doctoral Program of Higher Education of China (Grant No. 20120161110015). We also appreciate the support by Atomic Simulation Lab of Hunan University and the computation platform of National Supper-Computer Center in Changsha.