Introduction
Agriculture is one of the main subsistence activities for humanity, as well as an industrial sector that drives the economies of countries (Food and Agricultural Organization 2017a). Invasive pests are among the major problems the agricultural sector faces, mainly because they represent significant economic losses and threats to nutritional and food safety (Food and Agricultural Organization 2017b).
Drosophila suzukii (Matsumura) (Diptera: Drosophilidae), commonly termed spotted-wing drosophila, is an invasive pest that causes severe damage to fruits with thin epidermis, like grapes (Vitis vinifera Linnaeus; Vitaceae), strawberries (Fragaria × ananassa Duchesne; Rosaceae), cranberries (Vaccinium Linnaeus; Ericaceae), cherries (Prunus Linnaeus; Rosaceae), raspberries (Rubus Linnaeus; Rosaceae), blueberries (Vaccinium Linnaeus; Ericaceae), pears (Pyrus Linnaeus; Rosaceae), and tomatoes (Solanum lycopersicum Linnaeus; Solanaceae), among others (Sasaki and Sato Reference Sasaki and Sato1995; Walsh et al. Reference Walsh, Bolda, Goodhue, Dreves, Lee and Bruck2011). This pest attacks multiple wild and ornamental hosts, such as species in the genera Cornus Linnaeus (Cornaceae) and Phytolacca Linnaeus (Phytolaccaceae) (Mitsui et al. Reference Mitsui, Beppu and Kimura2010; Lee et al. Reference Lee, Bruck, Dreves, Ioriatti, Vogt and Baufeld2011, Reference Lee, Dreves, Cave, Kawai, Isaacs and Miller2015; Walsh et al. Reference Walsh, Bolda, Goodhue, Dreves, Lee and Bruck2011; Poyet et al. Reference Poyet, Le Roux, Gibert, Meirland, Prévost, Eslin and Chabrerie2015), promoting its movements between arable, wild, and urban areas (Kenis et al. Reference Kenis, Tonina, Eschen, van der Sluis, Sancassani and Mori2016). This species has caused substantial economic losses; indeed, just in the western United States of America (California, Oregon, Washington), during 2008 and 2009, damages were estimated above USD 500 million, affecting mainly the strawberry, blueberry, raspberry, blackberry, and cherry production (Bolda et al. Reference Bolda, Goodhue and Zalom2010).
Drosophila suzukii was originally described from Japan, but it is believed that this species is probably native to southeastern Asia (Bolda et al. Reference Bolda, Goodhue and Zalom2010). Records of this species have come from China, Taiwan, Russia, South and North Korea, India, Pakistan, Thailand, United States of America, Canada, Brazil, Mexico, Spain, Italy, and France, among others, illustrating a high potential for dispersal and establishment outside its native range (Hauser Reference Hauser2011). The main characteristic of this species that makes it a significant threat is the serrated ovipositor of the female that allows it to oviposit in developing fruits, generally before harvest (Lee et al. Reference Lee, Bruck, Dreves, Ioriatti, Vogt and Baufeld2011; Walsh et al. Reference Walsh, Bolda, Goodhue, Dreves, Lee and Bruck2011), unlike other drosophilids, that are only able to infest previously damaged fruits. Drosophila suzukii larvae feed on the fruit pulp, promoting colonisation of bacteria and fungi, resulting in loss of its commercial value (Grassi et al. Reference Grassi, Giongo and Palmieri2011).
In response to its rapid spread and the massive potential economic losses (Bolda et al. Reference Bolda, Goodhue and Zalom2010), many invaded countries have initiated crop monitoring programmes and studies on population growth to improve current control. As such, identification of factors that affect its geographic distribution and persistence is crucial. A useful approach to address such questions is ecological niche modelling, also known as species distribution modelling or habitat suitability modelling, which attempts to identify suitable areas for survival of populations via identification of its environmental requirements (Farber and Kadmon Reference Farber and Kadmon2003; Anderson and Martinez-Meyer Reference Anderson and Martinez-Meyer2004; Elith et al. Reference Elith, Graham, Anderson, Dudík, Ferrier and Guisan2006; Soberón and Nakamura Reference Soberón and Nakamura2009; Lobo et al. Reference Lobo, Jiménez-Valverde and Hortal2010; Peterson and Soberón Reference Peterson and Soberón2012). These tools are used to estimate the actual or potential distribution by mapping the geographic distribution of those environmental requirements as its potential area of distribution (Phillips et al. Reference Phillips, Dudík, Schapire and Brodley2004; Peterson et al. Reference Peterson, Soberón, Pearson, Anderson, Martínez-Meyer, Nakamura and Araújo2011). These methodologies have proved to be a useful tool in invasive species risk assessment, with wide application in agriculture and forestry systems (Jiménez-Valverde et al. Reference Jiménez-Valverde, Peterson, Soberón, Overton, Aragón and Lobo2011; Suárez-Mota et al. Reference Suárez-Mota, Ortiz, Villaseñor and Espinosa-García2016; Barbet-Massin et al. Reference Barbet-Massin, Rome, Villemant and Courchamp2018).
This study seeks to characterise the worldwide potential distribution of D. suzukii by identifying currently suitable areas and extrapolating these findings to predict range expansion/contraction under multiple climate change scenarios. To represent areas of the world at high risk of infestation by this species, we overlap an agricultural and arable land cover with high-suitability areas, where D. suzukii populations are likely to be more concentrated. We hope that our results can guide efforts to reduce damages by this species to crops and offer economic, ecological, and social benefits.
Materials and methods
Occurrence data for D. suzukii were obtained through an extensive search of the literature, and of data portals such as the Global Biodiversity Information Facility (www.gbif.org), Biodiversity Information Serving Our Nation (https://bison.usgs.gov/#home), Berkeley Ecoinformatics Engine (EcoEngine; https://ecoengine.berkeley.edu), Integrated Digitised Biocollections (iDigBio; www.idigbio.org), and iNaturalist (www.inaturalist.org). This search was conducted using “spocc” package (Chamberlain Reference Chamberlain2017), a programmatic interface to many occurrence data sources in the R environment (R Core Team 2017). Only occurrences data from the literature with georeferenced information or with an identified sampling site that allowed determination of geographic coordinates were used. We also used the most recently published database of D. suzukii occurrences (Ørsted and Ørsted Reference Ørsted and Ørsted2018, Reference Ørsted and Ørsted2019). To clean the data of georeferencing errors, we excluded records lacking coordinates and eliminated duplicate points, using the “dplyr” package (Wickham et al. Reference Wickham, François, Henry and Müller2018); subsequently, the data were mapped to identify and eliminate points for which coordinates fell in the ocean or had other georeferencing problems (see Supplementary Table 1).
To avoid geographic sampling biases and model overfitting to environmental conditions from specific regions, a spatial filtration was applied. Occurrences were filtered at a 50-km radius by selecting one random point and deleting all others comprised in that area, followed by the selection of a new random point until all of the points had been either selected or removed from the original list of occurrences. This process was repeated 10 times to maintain representativeness of occurrences and to avoid loss of unique environmental combinations, resulting in 10 different subsets of points (Supplementary Table 2).
Environmental variables were drawn from WorldClim (Hijmans et al. Reference Hijmans, Cameron, Parra, Jones and Jarvis2005), and we used all 19 bioclimatic layers from version 1.4 at 10-minute (approximately 20 km) spatial resolution. Environmental dimensionality was reduced before modelling using principal component analysis. To generate the models, we used only the first three components, which summarised 85.0% of the total variance.
To create future climate scenarios, it was necessary to transform future conditions using the definitions of the principal component analysis estimated for current climate conditions. We generated future principal component analyses using bioclimatic data from seven general circulation models (McSweeney et al. Reference McSweeney, Jones, Lee and Rowell2015), and two greenhouse gas concentration scenarios (representative concentration pathways, 4.5 and 8.5) projected for the year 2050. The seven general circulation models used in this study were the Australian Community Climate and Earth System Simulator 1-0, Community Climate System Model 4, Centre National de Recherches Météorologiques CM5, Geophysical Fluid Dynamics Laboratory CM3, Hadley Global Environment Model 2 (HadGEM2) – Carbon Cycle, HadGEM2 – Earth System, and Max Planck Institute for Meteorology Earth System Model Low Resolution. This process yielded 14 sets of future climatic variables: seven general circulation models for each representative concentration pathway.
Model calibration was carried out using Maxent 3.4.1 (Phillips et al. Reference Phillips, Dudík, Schapire and Brodley2004). For each subset of occurrences, we used 70% of points as the training dataset and the remaining 30% as the testing dataset. In a first stage of the process, we selected the parametrisations that best fit the data from all possible combinations in Maxent using the “kuenm” package in R (Cobos et al. Reference Cobos, Peterson, Barve and Osrio-Olvera2019). To explore model complexity, candidate models were tested with every possible feature combination with the five features allowed by Maxent: lineal (l), product (p), quadratic (q), threshold (t), and hinge (h), and with multiple regularisation multipliers (0.1, 0.2, 0.3, 0.4, 0.5, 0.6, 0.7, 0.8, 0.9, 1, 2, 3, 4, 5). This parameter combination resulted in 406 candidate models for each of the 10 subsets of occurrences. Candidate models were discarded according to a partial receiver operating characteristic test, randomly selecting 50% of the presence points (Peterson et al. Reference Peterson, Papes and Soberón2008) and eliminating all nonsignificant models. The remaining models were then filtered by a criterion of low omission rate (5%), removing models with an omission rate over 0.05, which was considered as poor performance. Lastly, the remaining models were filtered to retain those with the lowest values of the Akaike information criterion with small-sample correction (Warren and Seifert Reference Warren and Seifert2011), selecting as final models those with the lower Akaike information criterion values among the candidate models, for further analysis, and particularly for transfers to future conditions, allowing extrapolation and clamping.
The 10 final models (present and future) were converted to a final suitability map for D. suzukii by rescaling each linearly between 0 and 1 and calculating the median value. The same process was carried out for models projected under future conditions, calculating the median of the seven median final suitability maps that resulted from each of the general circulation models. Final potential distribution maps of D. suzukii were generated from the binarisation of the suitability values, using the fifth percentile of the suitability values on the calibration occurrences as a threshold to separate presence (1) and absence (0) of suitable conditions for the species.
To assess certainty of model predictions, we measured the range (maximum-minimum) of the suitability values per pixel (Raghavan et al. Reference Raghavan, Peterson, Cobos, Ganta and Foley2019); pixel values with large ranges imply greater uncertainty, whereas pixels with low range values imply higher certainty about model predictions. In addition, we analysed the novelty of future conditions using a mobility-oriented parity analysis (Owens et al. Reference Owens, Campbell, Dornak, Saupe, Barve and Soberón2013). This analysis identifies areas of strict extrapolation (i.e., in which values fall outside the range of environmental conditions represented in the calibration region) (Raghavan et al. Reference Raghavan, Peterson, Cobos, Ganta and Foley2019); these areas are considered as areas of least credibility from the model prediction standpoint.
To assess the risk that this species represents to agriculture, suitable areas for the presence of D. suzukii were compared with cultivated land distribution worldwide. We used the “cultivated and managed vegetation” class of the global 1-km consensus land cover from EarthEnv (www.earthenv.org/landcover), a data set that integrates multiple global land cover products derived from remote sensing. This layer provides information about prevalence of different land cover classes. Its ability to adequately reflect the distribution of crops of interest was proven by effectively reflecting cultivated and other production areas of susceptible hosts to D. suzukii (country level) from the information from the Centre for Agricultural and Bioscience International (2018) and the FAOSTAT statistic database (Food and Agricultural Organization 2018). Risk areas were determined by intercepting the 50–100% of prevalence of the cultivated and managed vegetation land cover and the suitable areas for the presence of D. suzukii.
Results
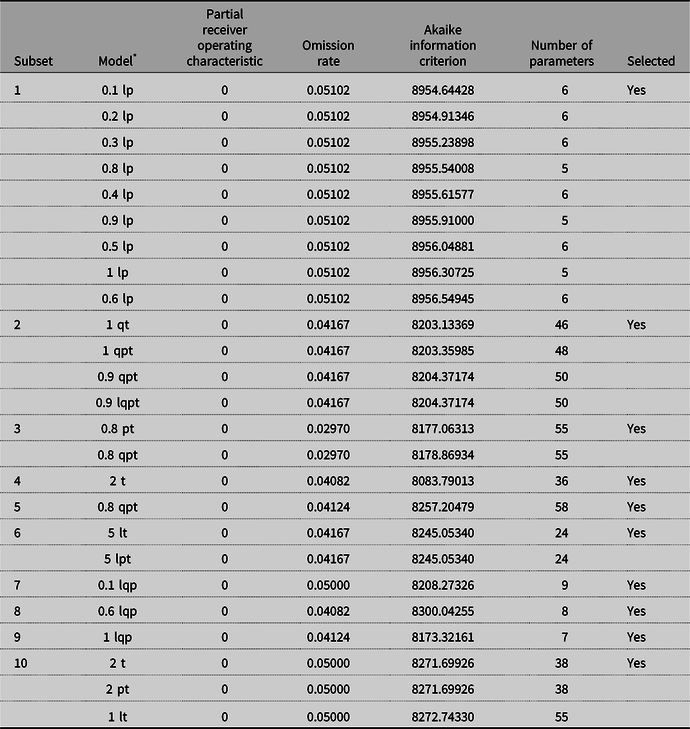
We compiled a database of 672 occurrence points from the various sources consulted, the most complete such dataset of which we know for this species (Supplementary Table 1). Multiple statistically valid candidate models from the exhaustive parameterisation of Maxent were obtained for each of the 10 datasets of occurrences (Table 1). Four of these replicate models exhibited an identical parameterisation (subsets 4, 7, 9, and 10) but most presented unique configurations. None of the models obtained from subset 1 met the criteria of omission rate < 0.05, so models with the smallest omission rate values (0.05102) were selected to explore with the other criteria. The points used for each subset are presented in Supplementary Table 2.
Ecological niche model statistics per occurrence subset for the candidate model parameterisations. Letter on Maxent features are l (linear), p (product), q (quadratic), t (threshold).
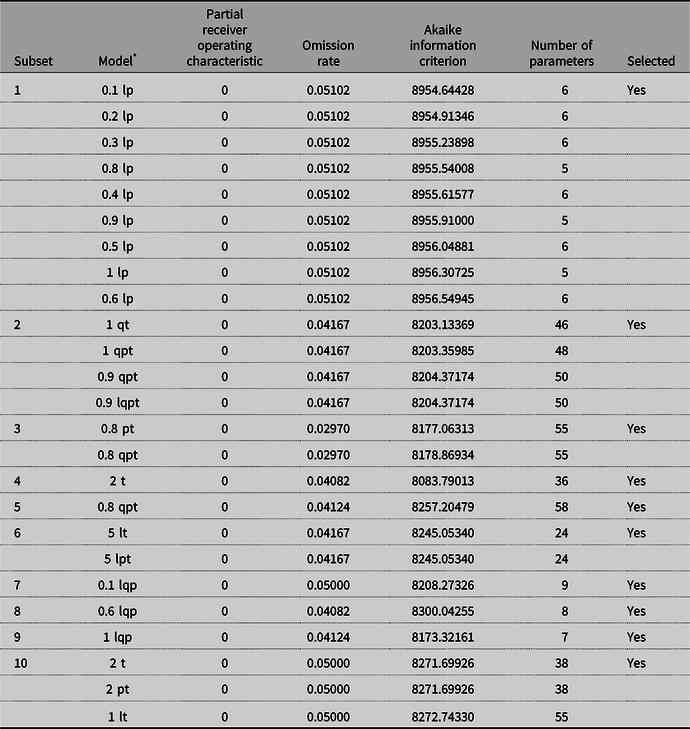
* Multiplier and features used in the model.
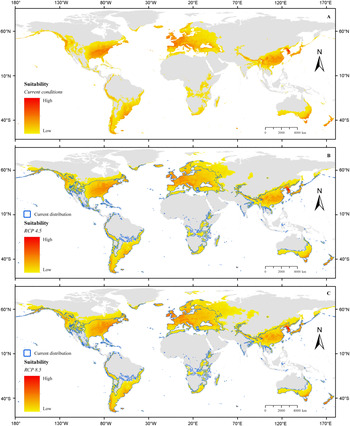
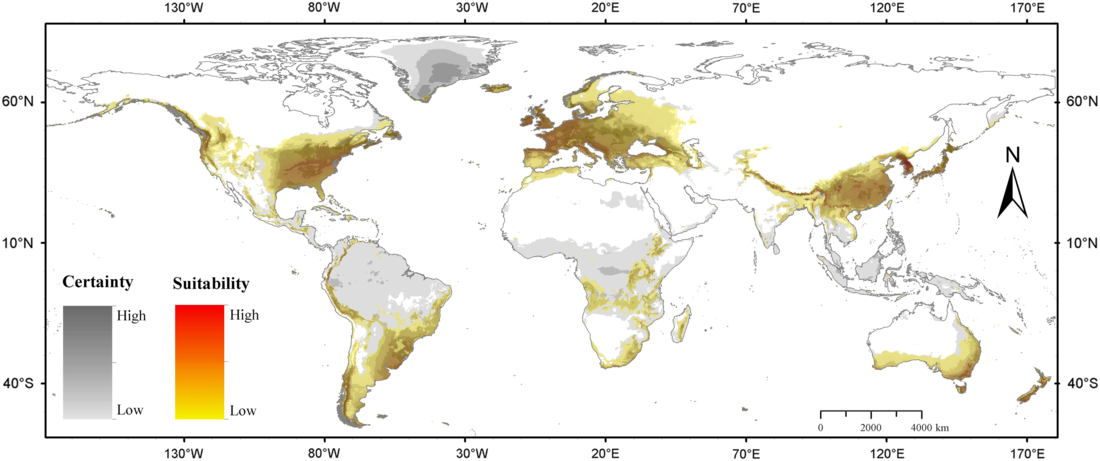
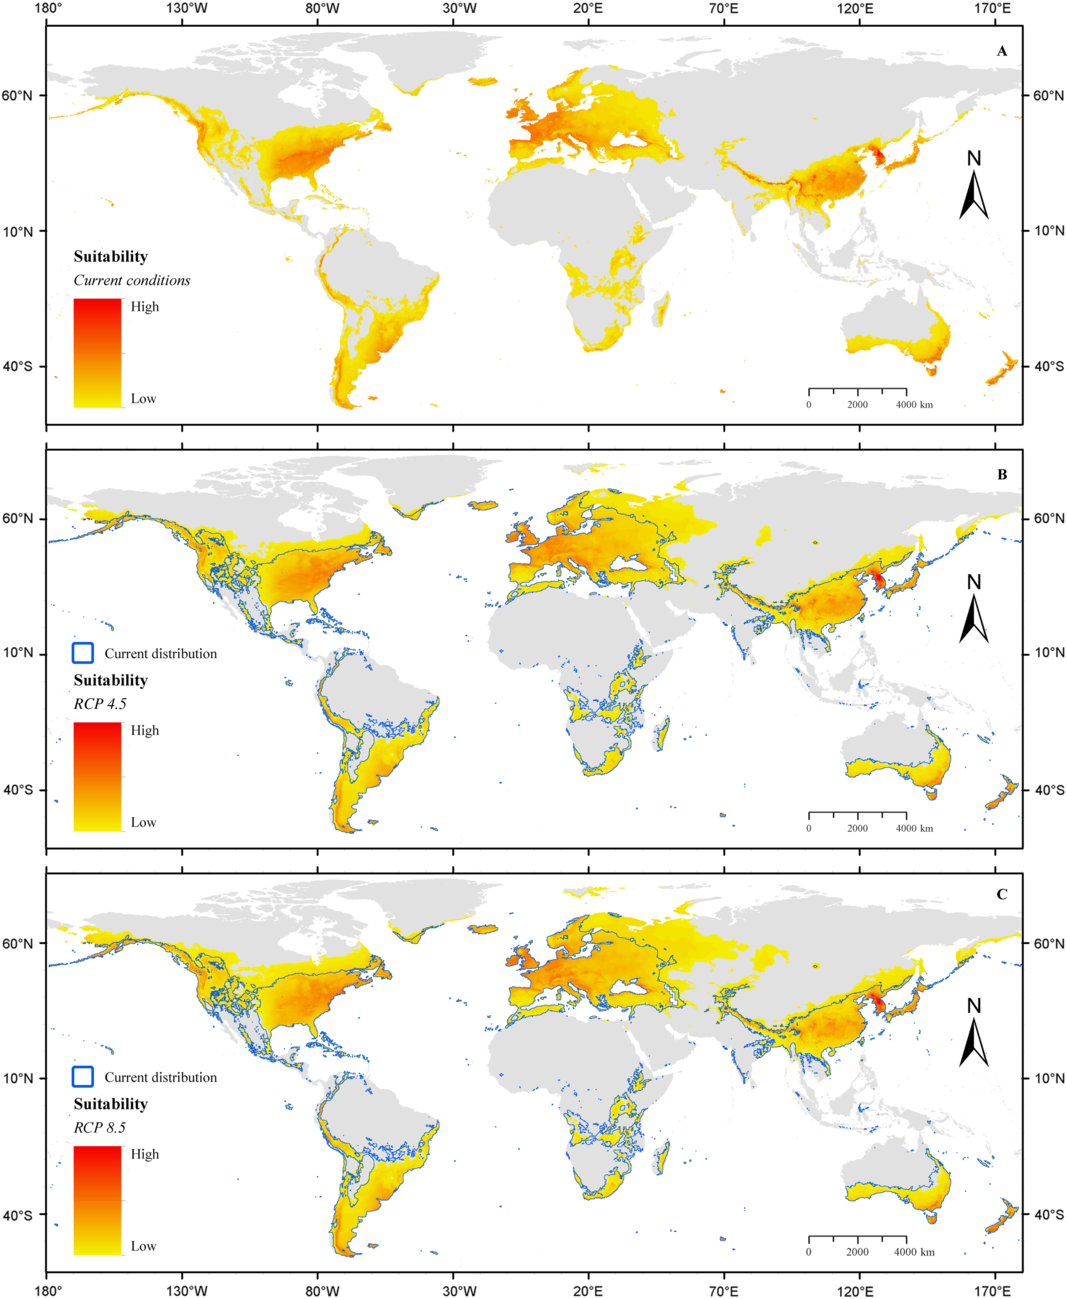
The final consensus model created from the median of the models chosen from each subset allowed us to identify areas with different suitability levels for D. suzukii around the world (Fig. 1). Current highly suitable areas were in different parts of North America, southeastern South America, southeastern Asia, parts of the Himalayas, southern and southeastern Australia, New Zealand, and most of Europe, but suitability diminished towards the periphery of these areas. Additional suitable areas were identified in parts of Madagascar, Central America, and some Caribbean islands. The present-day model showed low uncertainty in areas predicted with higher suitability (Fig. 2).
Habitat suitability for Drosophila suzukii. A, Present; B, future using representative concentration pathway 4.5 climate conditions; C, future using representative concentration pathway 8.5 climate conditions.
Certainty associated with predictions of current suitable regions for Drosophila suzukii.

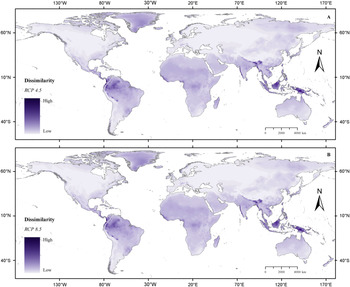
Models projected to future climate scenarios showed a dramatic expansion of the potential distribution of D. suzukii. The maps for scenarios representative concentration pathway 4.5 (Fig. 1B) and representative concentration pathway 8.5 (Fig. 1C) indicated expansions of suitable area across large parts of Europe, North America, and Asia. Interestingly, suitable areas in Africa decreased under the same conditions. In South America, we noted a small reduction of suitable areas in regions close to the Equator, and small increases were observed in southern regions. The mobility-oriented parity analysis showed that most highly suitable areas for the species show overall high climatic similarity between current and future conditions, although climatic similarity was lower in Central America, northeastern South America, and southeastern Asia (Fig. 3A–B).
Climatic dissimilarity between present and two future climate scenarios. A, Representative concentration pathway 4.5; B, representative concentration pathway 8.5.

The comparison of suitability areas for D. suzukii against the prevalence of cultivated and managed lands showed a large extension of risk areas. The most affected areas are in Europe, parts of the United States of America, South America, and parts of southeastern Asia and southern Australia, mainly because of the high prevalence of crops (50–100%) in these areas (Fig. 4).
Risk areas to Drosophila suzukii infection by current potential distribution versus prevalence of cultivated and managed vegetation under current conditions.

Discussion
We explored the potential distribution of D. suzukii under current and future climate conditions, using the most complete occurrence database collected to date for this species. Ecological niche model outputs under current climatic conditions coincided well with currently known presence areas for the spotted-wing drosophila in North and South America, Europe, and southeastern Asia (dos Santos et al. Reference dos Santos, Mendes, Kruger, Blauth, Gottschalk and Garcia2017; Ørsted and Ørsted Reference Ørsted and Ørsted2019). However, under future climate conditions for 2050, the potential distribution of this species showed a dramatic expansion in North America and northern and northeastern Europe. This prediction coincided largely with areas that are currently cultivated (Centre for Agriculture and Bioscience International 2018; Food and Agriculture Organization of the United Nations 2018), but suitability for this fly will continue expanding, suggesting a need for anticipating its presence for adequate management and mitigation of potential economic losses.
Overall, highly suitable areas for D. suzukii were in the eastern United States of America, eastern Asia (the Korean peninsula and Japan), southeastern Australia, New Zealand, and a large part of Europe. The models correctly identified the areas where the species is known to occur (Ørsted and Ørsted Reference Ørsted and Ørsted2018), as well as adjacent regions that are probably climatically suitable for establishment of its populations. The models effectively recovered the area of origin of the species, eastern Asia (Bolda et al. Reference Bolda, Goodhue and Zalom2010), as shown in Figure 1. Previous studies that characterised the potential distribution of the spotted-wing drosophila had similar results to ours, despite using distinct methods (dos Santos et al. Reference dos Santos, Mendes, Kruger, Blauth, Gottschalk and Garcia2017; Ørsted and Ørsted Reference Ørsted and Ørsted2019). Some of the most notorious differences in the results are in the United States of America area, since according to the map of dos Santos et al. (Reference dos Santos, Mendes, Kruger, Blauth, Gottschalk and Garcia2017), the distribution of D. suzukii occurs in the western and eastern part of the country; however, these areas are separated from each other by a nondistribution corridor, unlike the map of Ørsted and Ørsted (Reference Ørsted and Ørsted2019) and ours, where both areas are connected. In the same way, there are differences in Patagonia, Argentina, which according to Ørsted and Ørsted (Reference Ørsted and Ørsted2019) is not part of the distribution of this species, unlike our results and those of dos Santos et al. (Reference dos Santos, Mendes, Kruger, Blauth, Gottschalk and Garcia2017). Another big difference is found in the southern part of central Africa and eastern Africa, since our model, as well as that of dos Santos et al. (Reference dos Santos, Mendes, Kruger, Blauth, Gottschalk and Garcia2017), recovers a greater extension of the suitable area for D. suzukii compared to the model of Ørsted and Ørsted (Reference Ørsted and Ørsted2019). Contrary is the case in Russia, where Ørsted and Ørsted (Reference Ørsted and Ørsted2019) recovered a greater distribution than we and dos Santos et al. (Reference dos Santos, Mendes, Kruger, Blauth, Gottschalk and Garcia2017), mainly in the interior of the country. Besides, there are also some differences in India, where our results and those of dos Santos et al. (Reference dos Santos, Mendes, Kruger, Blauth, Gottschalk and Garcia2017), identify the east as an area where D. suzukii could be distributed, instead of limiting only to the north of the country, according to Ørsted and Ørsted (Reference Ørsted and Ørsted2019).
While we do not ignore the previous studies of D. suzukii distribution, these previous efforts were not cautious in exploring the complex variability of the models through regularisation of the models and selection of environmental predictors, essential steps in obtaining accurate models (Warren and Seifert Reference Warren and Seifert2011). We consider implementation of the “kuenm” package as an efficient and straightforward tool in exploring this complexity in the context of choosing the right model parameterisation and model fitting. In addition to this, treating the presence data in different subsets allowed us to minimise spatial biases caused by sampling effect in certain regions of the world. Thus, by filtering the original occurrence dataset, we reduced model overfit (Lira-Noriega et al. Reference Lira-Noriega, Soberón and Miller2013) and increased the capacity for identifying suitable regions for this species.
The model projections under two representative concentration pathway scenarios in 2050 showed the potential for expansion for the spotted-wing drosophila worldwide. The two representative concentration pathway scenarios used, correspond to high greenhouse gas emissions (representative concentration pathway 8.5) and an intermediate mitigation projection (representative concentration pathway 4.5) (van Vuuren et al. Reference van Vuuren, Edmonds, Kainuma, Riahi, Thomson and Hibbard2011). Our results showed, under these two climate change scenarios, a significant expansion of suitable areas for D. suzukii, which would concentrate and expand in the Northern Hemisphere, particularly in northern and eastern Europe, temperate North America, and eastern Asia, potentially invading over cultivated lands not currently affected by this species. The mobility-oriented parity analysis helped us to identify areas of strict extrapolation and evaluate risk zones in relation to the calibration conditions (present) and their differences in the future (Owens et al. Reference Owens, Campbell, Dornak, Saupe, Barve and Soberón2013). Although we noted some degree of dissimilarity between current and future climatic conditions, these results revealed no extrapolation-related basis for mistrusting predictions of high-suitability areas (most in areas with known occurrences such as North America and Europe). Consequently, our predictions could be used to guide field surveys to corroborate the presence or absence of the species. No strict extrapolation areas were detected, and we observed high agreement (certainty) across models.
From the perspective of the most vulnerable areas given the presence of crops, assessing the global potential distribution of this fruit fly was important to understand the geographic dimensions of invasion risk. The economic impacts of D. suzukii, such as costs for monitoring and prevention, cost of actions carried out when crops are infested, and crop losses have been studied widely (Bolda et al. Reference Bolda, Goodhue and Zalom2010; Goodhue et al. Reference Goodhue, Bolda, Farnsworth, Williams and Zalom2011; Lee et al. Reference Lee, Bruck, Dreves, Ioriatti, Vogt and Baufeld2011; Mazzi et al. Reference Mazzi, Bravin, Meraner, Finger and Kuske2017). For example, in the Trentino region in Italy, the costs of materials, labour, and infrastructure to implement measures of surveillance, sanitation, and pest control between 2011 and 2013 were estimated at approximately €1 million per year (deRos et al. Reference deRos, Conci, Pantezzi and Savini2015). These costs reflect the importance of contrasting the distribution of D. suzukii against the global prevalence of crops, since several areas where the species has been detected were also sites with significant presence of crops, which led us to create a risk map identifying which areas are most prone to invasions and thus effectively guiding monitoring and containment efforts to avoid economic losses in the agricultural sector. According to our results, Europe faces the highest risk, since most of its suitable area has high prevalence of crops; the situation is similar in eastern United States of America.
Our results are supported by physiological and biological evidence from the species, since some of the environmental characteristics of the most suitable areas match preferences for development and reproduction of D. suzukii. One environmental variable that appears to impact this species directly is humidity, which has a positive effect on fecundity, longevity, reproduction, and abundance of individuals (Tochen et al. Reference Tochen, Woltz, Dalton, Lee, Wiman and Walton2016). The variable that appears to have the largest impact on reproduction, fecundity, and survival of D. suzukii is temperature, although multiple opinions exist about the effects of this variable on this species. Most authors seem to agree that D. suzukii is intolerant of low temperatures (Stephens et al. Reference Stephens, Asplen, Hutchison and Venette2015) and in general has problems surviving cold winters (Jakobs et al. Reference Jakobs, Gariepy and Sinclair2015; Gutierrez et al. Reference Gutierrez, Ponti and Dalton2016). According to Dalton et al. (Reference Dalton, Walton, Shearer, Walsh, Caprile and Isaacs2011), even temperatures below 10 °C could affect its long-term survival. In contrast, other studies have suggested that D. suzukii has a good performance at low temperatures and that even under such conditions, it could see population increases (Tonina et al. Reference Tonina, Mori, Giomi and Battisti2016). However, it seems that in general the optimal temperature range for development and reproduction falls above 10 °C and below 30 °C (Tochen et al. Reference Tochen, Dalton, Wiman, Hamm, Shearer and Walton2014). This range of temperatures coincides well with the map of potential distribution, and in regions expected to fall more within these temperatures as global warming progresses (Hansen et al. Reference Hansen, Ruedy, Sato and Lo2010). Nonetheless, it is known that the combination of both temperature and humidity (measured here indirectly by precipitation) has a direct impact on D. suzukii, increasing its mortality at high and low temperature/humidity rates (Gutierrez et al. Reference Gutierrez, Ponti and Dalton2016).
Conclusion
We implemented rigorous approaches from ecological niche modelling, including the compilation of a comprehensive database on occurrences of D. suzukii, spatial filtering of occurrences, and selection and transferability on environmental conditions under current and future scenarios. We found good correspondence between our predictions and the known distribution of the species, which may encounter suitable conditions over a vast extent of the Northern Hemisphere and parts of South America for 2050 mainly because of the increase in temperature of this area. This high-suitability risk scenario for the potential expansion of the spotted-wing drosophila shows considerable threat over areas with high prevalence of cultivated lands.
Acknowledgements
We thank Rodrigo Lasa for providing some of the occurrences of D. suzukii in Mexico, and to Jorge Soberón for the conceptual suggestions that helped framing this work. We appreciate the help of Jéssica Falcao and Raúl Badillo in map editing and to Celeste Reyes for assistance with English translation. Finally, we are deeply thankful to A. Townsend Peterson for his comments and suggestions on this work.
Supplementary material
To view supplementary material for this article, please visit https://doi.org/10.4039/tce.2020.3.