The injury of the myocardium in asphyxiated neonates can be shown by biochemical markers and by measurements by ultrasound.Reference Costa, Zecca and De1, Reference Barberi, Calabro and Cordaro2 Contraction of the myocardium is traditionally measured by ultrasound in neonates as fractional shortening,Reference Lang, Bierig and Devereux3, Reference Lai, Geva and Shirali4 which is used as a measure for global cardiac function. Some studies have shown a reduced fractional shortening in asphyxiated neonatesReference Barberi, Calabro and Cordaro2, Reference Panteghini, Agnoletti, Pagani and Spandrio5, Reference Costa, Zecca and De6 while others have not,Reference Szymankiewicz, Matuszczak-Wleklak, Hodgman and Gadzinowski7, Reference Molicki, Dekker, de and van8 possibly indicating that assessment of the fractional shortening has low sensitivity in detecting minor and moderate deteriorations of the function of the myocardium.
Longitudinal strain and strain rate by tissue Doppler assess the function in segments of the myocardium.Reference Heimdal, Stoylen, Torp and Skjaerpe9–Reference Stoylen, Heimdal and Bjornstad11 The function of the myocardium is assessed differently by fractional shortening versus longitudinal strain and strain rate. Fractional shortening is the change in assessing changes in the internal diameter of the left ventricle, longitudinal strain is the relative change in the length of a segment of the myocardium and strain rate is strain per unit of time.
The aim of this study was to compare measurements of the function of the myocardium by fractional shortening versus longitudinal peak systolic strain and peak systolic strain rate by tissue Doppler in an unselected population of asphyxiated term neonates on days 1, 2, and 3 of life.
Materials and methods
Subjects
Term neonates admitted to the neonatal intensive care unit at Oslo University Hospital, Ulleval, due to asphyxia were eligible for inclusion. Neonates with congenital cardiac defects were excluded. A total of 20 neonates were enrolled and examined on days 1, 2, and 3 of life (Table 1). Eight neonates were treated with isotonic saline volume expansion, three were treated with neonatal conventional ventilation, one was treated with high-frequency ventilation, one was treated with inhaled nitric oxide, and one was treated with dopamine; 19 neonates survived.
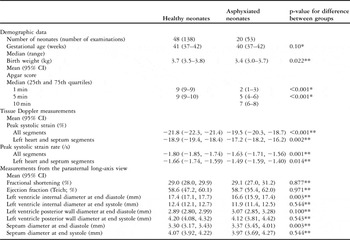
Demographic data, tissue Doppler measurements, and measurements from the parasternal long-axis view for the healthy and the asphyxiated term neonates.

*Mann–Whitney U-test; **t-test
The project was approved by the Regional Committee for Medical Research Ethics and by the Scientific Committee at Oslo University Hospital, Ulleval. Written informed parental consent was obtained.
Measurements
The tissue Doppler images were recorded using a 2.4 Mega Hertz phase array probe (5S probe, Vivid 7 Dimension v 4.0.1 built 1644, GE Vingmed, Horten, Norway). The sector angle was 30 degrees or less and the tissue Doppler frame rate was 170–220 per second in most images. A grey-scale parasternal long-axis image was recorded at each examination.
Protocol
Five apical views were used to study nine walls. The left lateral wall, the septum, and the right lateral wall were studied from the four-chamber view; the left inferior and left anterior wall from the left two-chamber view; the left inferiolateral wall and the anterior septum from the apical long-axis view; and the right inferior wall from the right inferior two-chamber view, and the right superior wall from the right superior two-chamber view. In 19 neonates, the injury of the myocardium was assessed biochemically by measuring/assessing the cardiac troponin T (Roche Diagnostics, GmbH, Mannheim, Germany). These neonates were grouped according to peak values. As 0.097 microgram per litre has been suggested as the upper reference limit in neonates,Reference Baum, Hinze, Bartels and Neumeier12 values less than 0.10 microgram per litre were regarded as normal.
Data analysis
We performed two-segment analyses (Fig 1) using the EchoPac PC analysis software (GE Vingmed, Horten, Norway). The sample area was defined by a strain length of 10 millimetres and length of 1 millimetre and a width of 3 millimetres for the region of interest.Reference Nestaas, Stoylen, Sandvik, Brunvand and Fugelseth13 A semi-automatic tracking algorithm kept the sample area centred in the segment during the cardiac cycle. The peak systolic strain and peak systolic strain rate were extracted from curves averaged over three consecutive cycles (Fig 1). We used 40 milliseconds Gaussian smoothing and linear drift compensation for the Lagrangian strain curves. End-diastole was defined by the R-peak of the electrocardiographic signal and end-systole by the notch in the tissue Doppler displacement curve was caused by the closure of the aortic and pulmonary valves.Reference Aase, Stoylen, Ingul, Frigstad and Torp14 Fractional shortening was estimated from the parasternal long-axis view.Reference Lang, Bierig and Devereux3, Reference Lai, Geva and Shirali4 Peak systolic strain and strain rate for each examination were assessed by averaging measurements from all segments eligible for analysis. The values for the apical and basal left, septum, and right groups of segments were assessed by averaging all measurements within the respective segment group, and the left/septum values were assessed by averaging measurements from all segments in the left heart and septum walls. Fractional shortening, peak systolic strain, and peak systolic strain rate for each neonate were assessed by averaging the corresponding value for the examinations performed on days 1, 2, and 3.
A strain rate curve (a) and a strain curve (b). Arrows at the peak systolic values. Grey-scale image of the right inferior wall (apical inferior two-chamber view; c), with the area from which the velocities used for the basal and apical segment analyses are collected.

The control group consisted of 138 examinations conducted and analysed by the same protocol in 48 healthy term neonatesReference Nestaas, Stoylen, Brunvand and Fugelseth15 (Table 1).
In the normal myocardium, the longitudinal peak systolic strain and strain rate are both negative. The changes in these values are described in absolute magnitudes; that is, a peak systolic strain rate of minus 1.5 per second is regarded as a higher value than minus 1 per second, and a change to the latter value is regarded as a decrease.
Statistics
Two-sided p-values and 95% confidence intervals were used. Measurements between groups were compared by one-way ANOVA and t-tests. Bonferroni corrections were used for post hoc pair-wise comparisons. Apgar score and gestational age were compared by Mann–Whitney U-tests. Differences in categorical variables were analysed by chi-square tests. The apical and basal segments from 15 randomly selected walls were used in the repeatability analyses. These segments were analysed twice by the same investigator (EN) several months apart and once by another investigator (AS). The measurements were compared by intra-class correlation coefficients and in Bland–Altman plots.
Results
Peak systolic strain, peak systolic strain rate, and fractional shortening
Both the peak systolic strain and strain rate for each neonate were lower in the asphyxiated neonates – the peak systolic strain was (mean (95% confidence interval)) −19.4% (−20.4, −18.5) versus −21.7% (−22.3, −21.0) and the peak systolic strain rate was −1.65 per second (−1.74, −1.56) versus −1.78 (−1.84, −1.72; p less than 0.05). The fractional shortening for each neonate was similar in the asphyxiated neonates (29.2 (26.8, 31.5)) as in the control group (29.0 (27.9, 30.1); p equal to 0.874). Both the peak systolic strain and the peak systolic strain rate for each examination were lower in the asphyxiated neonates than in the control group while there was no difference in fractional shortening (Table 1). The peak systolic strain and strain rate averaged from the segments in the left heart and septum walls were also lower in the asphyxiated neonates than in the control group (Table 1).
The highest cardiac troponin T peak value was 1.16 micrograms per litre. The other peak values ranged from 0.03 to 0.38 micrograms per litre. The peak value was normal in seven neonates and elevated in 12 neonates. For these 19 neonates, three of the four treated with mechanical ventilation had an elevated peak troponin T value, whereas 9 of the 15 asphyxiated neonates that did not receive such treatment had an elevated peak value (p equal to 0.581). There were no differences in peak systolic strain, strain rate, or fractional shortening between asphyxiated neonates with elevated versus normal peak values, and the peak systolic strain was (mean (95% confidence interval)) −19.2% (−20.4, −18.1) in the asphyxiated neonates with elevated values and −19.9% (−21.2, −18.7) in the asphyxiated neonates with normal values. The mean of the corresponding peak systolic strain rate was −1.63 per second with a 95% confidence interval of −1.73, −1.52, and −1.63 per second with a 95% confidence interval of −1.74, −1.52. These strain and strain rate values were lower than the values in the control group (p less than 0.05; Table 1).
Groups of segments
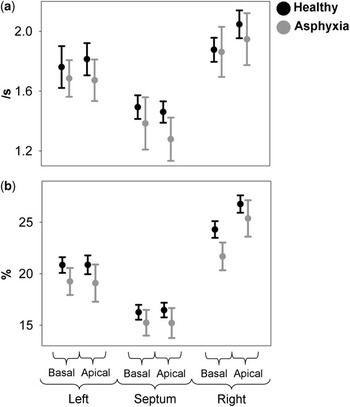
Peak systolic strain and strain rate for each examination were lower in the asphyxiated neonates than in the control group for all basal and apical left, septum, and right groups of segments, but the differences in peak systolic strain were significant only in the left basal and right apical segment groups and the difference in peak systolic strain rate was significant only in the apical septum segment group (p less than 0.05; Fig 2).
Peak systolic strain rate (a) and peak systolic strain (b) for each group of segments. Absolute mean and 95% confidence interval for the mean.

Days 1, 2, and 3
The peak systolic strain was lower in the asphyxiated neonates than in the control group on all the first 3 days of life, whereas the peak systolic strain rate was significantly lower only on day 2 (Fig 3; p less than 0.05). Neither within the asphyxiated neonates nor in the control group did these measurements differ between examinations on days 1, 2, and 3.
Peak systolic strain rate (a) and peak systolic strain (b) on each day of life. Absolute mean and 95% confidence interval for the mean.

Repeatability analyses
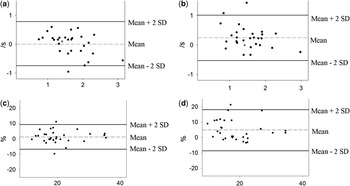
The intra-class correlation coefficients for the intra-observer analyses were 0.86 for the peak systolic strain rate and 0.90 for the peak systolic strain. The corresponding inter-observer values were 0.83 and 0.74. Bland–Altman plots are shown in Fig 4.
Repeatability analyses. Strain rate intra-observer (a), strain rate inter-observer (b), strain intra-observer (c), and strain inter-observer (d) analyses; x axis: average for the two measurements for each segment (absolute values); y axis: difference between the two measurements for each segment; dashed line: mean difference for all measurements; solid lines: mean difference plus or minus two standard deviations for the difference between the two measurements for each segment.

Discussion
Peak systolic strain, peak systolic strain rate, and fractional shortening
To our knowledge, this is the first measurement of longitudinal peak systolic strain and strain rate in asphyxiated neonates. Both indices were lower in the asphyxiated neonates, whereas the fractional shortening was similar to the values in the control group. Fractional shortening is the relative change in the internal diameter of the left ventricle and is therefore determined mainly by the circumferential function. Longitudinal strain and strain rate describe the changes in the length of the myocardial segments. Peak systolic strain and strain rate are therefore determined mainly by the longitudinal function. Differences in the dispersion of circular and longitudinal myocardial fibres between heart regions might have caused the different changes in fractional shortening and peak systolic strain and strain rate. Changes in the length of the myocardial wall could have preceded the changes in the diameter of the left ventricle lumen. Further, fractional shortening might have been determined mainly by the function in the segments of the left ventricle and septum, especially in the basal region, whereas the peak systolic strain and strain rate were averaged from segments in all heart regions.
Cardiac troponin T has been suggested as a sensitive marker for myocardial affection in asphyxia.Reference Szymankiewicz, Matuszczak-Wleklak, Hodgman and Gadzinowski7 The function of the heart was reduced to the same extent in the asphyxiated neonates with normal and with elevated cardiac troponin T. We speculate that the reduced function of the heart might have been caused by a protective mechanism, also lowering the function when there was no release of cardiac troponin T. The reduced function could also have been caused by a depletion of energy substrate within the myocardium due to the asphyxia. Peak systolic strain and strain rate were relatively independent of load in healthy term neonates,Reference Nestaas, Stoylen, Brunvand and Fugelseth15 but it is not known whether these indices are independent of load in asphyxiated neonates as well. We can suspect that the lower peak systolic strain and strain rate in the asphyxiated neonates might partly have been caused by extra-myocardial factors related to asphyxia, for example, differences in pre-load, after-load, and neurovascular tone. Sufficient data on after-load were not present in this study. We have shown that physiological foetal shuts had little impact on the measurements in healthy term neonates,Reference Nestaas, Stoylen, Brunvand and Fugelseth15 but their impact in asphyxiated neonates may be different.
Groups of segments
Measurements in all segment groups were lower in the asphyxiated than in the healthy term neonates, but the differences were significant only in a few groups. We speculate that significant differences could have been present in more segment groups if a larger number of neonates had been examined. Our results indicate that the myocardium was affected globally. Global affection of the heart in asphyxia has also been shown by histological examination of hearts from neonates suffering from severe asphyxia.Reference Primhak, Jedeikin and Ellis16
Days 1, 2, and 3
The difference in peak systolic strain between the asphyxiated and healthy neonates was largest on the second day of life. The difference in peak systolic strain rate was significant only on day 2. Functional impairment has been shown to be largest on the second day of life in other studies of neonates thought to suffer from hypoxic–ischaemic impairment of myocardial contractility as well.Reference Clark, Newland, Yoxall and Subhedar17 Peak systolic strain and strain rate increased in adults from the first to the seventh day after myocardial infarction, with no further increase.Reference Ingul, Stoylen and Slordahl18 To our knowledge, peak systolic strain and strain rate have not been assessed before repeatedly during the first 3 days after injury of the myocardium.
Repeatability analyses
Measurements between individuals varied significantly and were much higher than the differences between healthy and asphyxiated neonates. At present, the method therefore seems more feasible for assessing differences between patient groups and segment groups than between individual patients and segments.
Limitations
Measurements were taken in an unselected population of asphyxiated neonates. The severity of the asphyxia varied widely, and measurements from neonates treated with mechanical ventilation and from neonates breathing spontaneously were combined in the asphyxiated group. Mechanical ventilation could have altered the pre- and after-load conditions. However, the aim of this study was to compare the assessment of the function of the heart by fractional shortening and by the peak systolic strain and strain rate. To quantify the difference in function of the heart between asphyxiated and healthy term neonates, a larger study is required.
Clinical use
As the variation between the measurements was rather large, the peak systolic strain and strain rate by tissue Doppler are, by current methods, more feasible for assessing differences between patient groups and segment groups than between segments and between individuals. Further refinement of the method is probably required before it can be used in routine clinical care.
Further studies
The analyses are time consuming. It should therefore be explored whether a more simplified analysis procedure yields similar results, for example, by analysing one large segment from each wall or by setting the sample area stationary in space, as opposed to keeping the sample area within the same myocardial area throughout the cardiac cycle. A larger study is needed for assessing in more detail the impairment of the myocardium in asphyxia. Assessment of the global myocardial performance in asphyxiated neonates by other indices should be explored.
Conclusion
Assessment of the function of the myocardium by peak systolic strain and strain rate by tissue Doppler detected a lower function in an unselected population of asphyxiated term neonates compared with healthy term neonates in the first 3 days of life. Conventional assessment of the function of the heart by fractional shortening did not detect any deterioration of the myocardial function. Peak systolic strain and strain rate by tissue Doppler might therefore be more sensitive indices than fractional shortening for the assessment of the function of the heart. The affection of the heart was globally distributed and was largest on the second day of life. Variation in the repeatability analysis was high. Strain and strain rate analyses are therefore at present more feasible for assessing differences between patient groups and segment groups than between individuals and individual segments.
Acknowledgements
This study was supported by the Vestfold Hospital Trust, the Eastern Norway Regional Health Authority, the Southern Norway Regional Health Authority, and the Renée and Bredo Grimsgaard Foundation. Leif Sandvik advised on the statistical analyses.