Implications
The increment of milk iodine and selenium contents could represent a way to counteract the mild selenium and iodine deficiencies in exposed populations, in particular, for children and pregnant women.
Thus, the implement of iodine and selenium in dairy cows diet formulation could represent a feasible way to the increase of milk iodine and selenium contents.
The knowledge of trace elements’ carry over at different milk yields is important to better define their level of supplementation in dairy cow diets.
Introduction
Iodine and selenium are very important elements for human health due to their role in thyroid functions and control of metabolism. The iodine deficiency leads to several diseases grouped as Iodine deficiency disorders (IDDs), among which are miscarriages and fetal mortality, impaired mental functions, cretinism and goitre, both for children and adults. About 16.7% of the European population is at risk for IDD (Vitti et al., Reference Vitti, Rago, Aghini-Lombardi and Pinchera2001), while some countries not showing iodine deficiency in the population are adopting a salt-iodization policy (e.g. Switzerland and The United States). A positive high correlation between dairy products intake and iodine status, particularly in children and lactating women was reported (Rasmussen et al., Reference Rasmussen, Larse and Ovesen2002; Als et al., Reference Als, Haldimann, Bürgi, Donati, Gerber and Zimmerli2003; Girelli et al., Reference Girelli, Coin, Mian, Nacamulli, Zambonin, Piccolo, Vianello-Dri, Gottardo and Busnardo2004). Even though WHO, UNICEF and FAO hoped to resolve IDD by the year 2005, the issue remains unsolved, suggesting the need for further research toward the increase of the iodine content of milk. The iodine concentration in cow milk ranges between 30 and 300 μg/l (Underwood and Suttle, Reference Underwood and Suttle1999), and for an optimal iodine feed concentration of 0.45 mg/kg dry matter (DM) (National Research Council (NRC), 2001), the expected iodine milk content is 44 μg/kg (Alderman and Stranks, Reference Alderman and Stranks1967). The best way for milk iodine content modification are through changes in animal feeding (Knowles et al., Reference Knowles, Grace, Knight, McNabba and Lee2006), i.e. feeds and veterinary fortification with inorganic (KI) or organic (ethylenediamine dihydroiodide, EDDI; and iodized oils) sources of iodine. The iodine milk content is also affected by seasonal and regional variations (Pennington, Reference Pennington1990), stage of lactation (Swanson, Reference Swanson1972) and use of iodophor postmilking teat dipping (Galton et al., Reference Galton, Petersson, Merrill, Bandler and Shuster1984, Reference Galton, Petersson and Erb1986; Galton, Reference Galton2004).
Selenium is the only microelement being codified in the DNA as Se-cys. Selenoenzymes are essential for thyroid functions (role of the iodothyronine deiodinase type I and II) and selenium deficiency worsens the T3/T4 ratio and the goitre status with increased weight of the thyroid gland (WHO, 2004). The benefit role of selenoenzymes are evident in the cancer prevention, although it is not clear about the prevention of cardiac diseases (Thomson, Reference Thomson2004). The selenium intake among the population of several countries is low or marginal. An increase of selenium intake could benefit the health of the population (Rayman, Reference Rayman2002). The recommended selenium content in the dairy cow diet is 0.3 mg/kg DM (NRC, 2001) and the expected selenium content with this level in feed is 11.6 μg/l (Givens et al., Reference Givens, Allison, Cottrill and Blake2004). Generally, bovine milk ranges between 5 and 56 μg/l (Underwood, Reference Underwood1971) in relation to selenium content of feeds and soil. The selenium fortified feeds, either from inorganic (sodium selenite and selenate) and organic (selenized yeasts) sources, have been fed to cows to improve the milk selenium content (Knowles et al., Reference Knowles, Grace, Wurms and Lee1999; Givens et al., Reference Givens, Allison, Cottrill and Blake2004).
Cheese could be an important source of iodine and selenium; however, there are few studies dealing with the partition of these elements into the curd and casein fractions (Sieber, Reference Sieber1998; Knowles et al., Reference Knowles, Grace, Wurms and Lee1999).
Objectives of this study were to evaluate the iodine and selenium carry over (CO; excretion ratio over intake) in milk and their partition in the curdle fraction of cheese produced by cows’ milk supplemented with different levels of these elements (Experiment 1), as inorganic sources, and how their milk concentration and CO could be affected by the milk yield and the lactation stage (Experiment 2).
Material and methods
Animals and diets
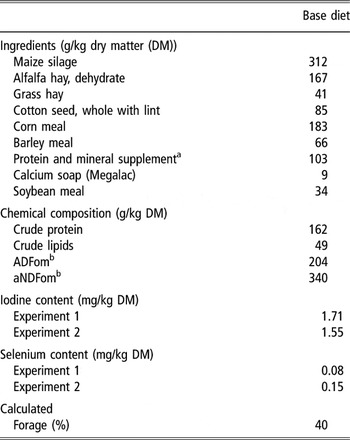
Two experiments were carried out on multiparous Holstein Friesian lactating cows housed at the CERZOO research and experimental center (San Bonico, Piacenza, Italy). The research protocol and the animal care were in accordance with the EC Council Directive guidelines for animals used for experimental and other scientific purposes (European Community, 1986). In both experiments, the diets were formulated according to the nutrient requirements of dairy cattle (NRC, 2001) for an average cow weight of 600 kg, 140 days in milk and a 30 kg milk yield (3.8% fat and 3.35% protein). All cows received the same total mixed ration (TMR) with a forage to concentrate ratio of 40:60 on DM basis. The TMR was made of a corn silage, dehydrated alfalfa, grass hay, cotton seed, corn meal, barley meal, soybean meal, calcium soap and a protein mineral supplement (Table 1).
Ingredients and chemical composition of the base diet used in both experiments

aContains per kg: soybean meal 600 g, sunflower meal 300 g; 120 000 IU of vitamin A; 9000 IU of vitamin D3; 90 mg of vitamin E; 3.6 mg of Co; 19.2 mg of I; 1.44 mg of Se; 600 mg of Mn; 62.4 mg of Cu; 2240 mg of Zn; 360 mg of Fe.
bADFom: acid detergent fiber expressed exclusive of residual ash; aNDFom: neutral detergent fiber assayed with a heat-stable amylase and expressed exclusive of residual ash, according to Mertens (2002), without sodium sulfite.
In both experiments, a water solution of iodine (KI) and selenium (sodium selenite pentahydrate) was individually poured (10 ml per cow) on top of the TMR fed to the treated cows just after the morning distribution (0800 h). The TMR of control cow was top poured a water solution with no iodine and selenium in it.
Cows were milked twice a day (0300 and 1500 h), and individual milk yield was recorded at each milking (Afimilk system, Afikim, Israel). Postdipping treatments were performed with an iodine-free commercial clorexidine spray solution.
In Experiment 1, 12 multipauros lactating cows (32.1 ± 4.9 kg/day of milk yield and 120 ± 22 days in milk) were used. The experiment lasted for 5 weeks, and cows were kept in a common pen with free access to water. Fresh TMR was prepared daily in a mixer feeder wagon (Data Ranger, American Calan Inc., Northwood, NH, USA), weighed and offered to each individual cow at 0800 h through a Calan Broadbent© feeding system (American Calan Inc.) to cover 105% needs. Orts were removed daily (0730 h), weighed and individual daily feed intake was calculated. The cows were adapted to a common diet for 2 weeks, then animals were randomly allotted to three treatments in a completely randomized design (n = 4): control group fed the TMR containing 1.71 and 0.08 mg/kg DM of I and Se, respectively (CTR); Group 1 fed the TMR supplemented daily with 23.2 and 2.2 mg/head of I and Se, respectively (T1); and Group 2 fed the TMR supplemented daily with 45.3 and 4.3 mg per head of I and Se, respectively (T2).
In Experiment 2, 30 multiparous lactating cows were allotted to three groups (10 animals each) according to the milk yield and stage of lactation. Groups were high milk (H): 44.0 ± 2.9 kg/day and 137 ± 17 days in milk, average milk (A): 31.7 ± 1.8 kg/day and 207 ± 47 days in milk, low milk (L): 24.2 ± 2.7 kg/day and 245 ± 57 days in milk. Groups were kept in separate pens within the same barn. The experiment consisted of a 2-week adaptation period to the basal diet and 16 days of treatment.
All animals had free access to water and were fed daily (0800 h) a basal diet to cover 105% of needs. Within each group, cows were randomly allotted to two levels of iodine and selenium inclusions into the diet. The levels were 1: base diet containing 1.55 and 0.15 mg/kg DM, respectively, for iodine and selenium and 2: base diet plus 47.2 mg per head per day iodine and 8.0 mg per head per day selenium. The combination of milk yield groups (H, A and L) and the level of iodine and selenium inclusions (1, 2) produced the following six treatment groups: H1, H2, A1, A2, L1 and L2. The given TMR and refusals were weighed daily on a group base and the average week intake was calculated.
Sampling and analysis
Feeds used in the TMR were sampled 2 weeks before starting the experiments. In Experiment 1, individual TMR samples were collected on days 0, 3, 10, 17 and 29 and the orts were individually collected three times a week, then individually pooled on a weekly basis. In Experiment 2, TMR samples were collected on days 0, 8 and 16 on a group basis. In both experiments, samples were dried in a ventilated oven (65°C) for 72 h, then ground to a 1 mm sieve (Thomas-Wiley Laboratory Mill, Arthur H. Thomas Co., Philadelphia, PA) before being analyzed for the chemical composition, iodine and selenium contents. The DM content was measured on the TMR and refusal samples.
Individual milk samples were collected at each milking at days −3, −1, 4, 6, 11, 13, 18, 20, 25 and 27 in Experiment 1, and at days −2, 4, 8, 16 in Experiment 2, mixed proportionally to milk yield by animal and day, then frozen at −20°C before being analyzed for iodine and selenium contents. Individual fresh milk samples (weekly basis) were also analyzed for fat, protein and lactose contents (infrared analysis, Milkoscan Model FT120 Foss Electric, Hillerod, Denmark).
Blood samples were taken in Experiment 1 before the morning meal (0730 h), via coccygeal venipuncture, on days 0, 23 and 30 of the experimental period. The blood was collected into Li-heparinized (17 U of heparin/ml of blood) Vacutainer (Vacutainer systems, Belliver industrial estate, Plymouth, UK). Then, plasma was obtained by centrifugation (3000 g for 15 min) and stored at −20°C until being analyzed for selenium content.
In Experiment 1 and on the last week of treatment, the daily milk yield was collected individually (morning and afternoon milk). Then, aliquots of 8 l of collected milk/cow samples were processed for Grana Padano cheese making (at lab scale). Curds were dripped and weighed. The raw milk and whey were sampled and frozen stored at −20°C. The iodine and selenium fractions in the curd were calculated by the difference between the total contents in milk and whey samples.
Chemical composition of the TMR
Samples were assayed in duplicate according to the Association of Official Analytical Chemists (1990) for DM (procedure 930.15), CP (procedure 975.06), ash (procedure 942.05), crude lipids (procedure 954.02) and ADF without residual ash (procedure 973.18). The NDF was analyzed with a heat-stable amylase with correction for residual ash, according to Mertens (Reference Mertens1997), without sodium sulfite and by Ankom device (Ankom2200, Macedon, NY, USA) for extraction and filtering.
Iodine and selenium analyses
The iodine and selenium detection in all samples were carried out by inductively coupled plasma–mass spectrometry (ICP-MS) (Agilent 7500ce, CA, USA) using rhodium and germanium as internal standards for iodine and selenium, respectively. All the reagents and solutions were prepared using ultrapure water (Milli-Q® plus 18,2 MΩcm, Millipore Corp., Milford, MA, USA).
The total iodine in feeds was determined according to Flachowsky et al. (Reference Flachowsky, Schöne, Leiterer, Bemmann, Spolders and Lebzien2007) using an ICP-MS.
The total iodine in milk and whey was analyzed according to Sanchez and Szpunar (Reference Sanchez and Szpunar1999). Raw milk and whey samples were previously defatted by centrifugation (4330 g for 10 min) at 10°C in a refrigerated centrifuge (4237R, ALC, Milan, Italy). In all, 2 ml of defatted milk or whey were added to 5 ml of a 0.15% ammonia solution in a polypropylene 50 ml DIGItube (SCP Science, Baie D’Urfé, Quebec), then covered with WatchGlasses (SCP Science, Baie D’Urfé, Quebec) and digested in a focussed microwave system at 45 W for 2.5 min (Microwave MDS 2000, CEM, Matthews, NC, USA). The sample was so diluted to 50 ml with 0.15% ammonia solution before analysis. A standard addition calibration method was used to determine the iodine concentration: 50 ml of a 0.15% ammonia solution were spiked with four different amounts of iodine (KI): 1, 2.5, 5, 10 μg/l. The results were confirmed using the milk powder Certified Reference Material BCR 151 (Community Bureau of Reference, Brussels, Belgium) containing 5.35 ± 0.14 μg iodine/g.
Total selenium in feeds was measured on a 0.3 g dry sample added 10 ml of a 65% distilled (SubPur Subboiling Distillation System, Milestone, BG, Italy) nitric acid, 1 ml of a water hydrogen peroxide solution (30% m/m) in a polypropylene 50 ml DIGItube, and closed softly. Then, a Teflon® coated graphite block DIGIprep Jr. (SCP Science, Baie D’Urfé, Quebec) was used for the samples digestion at 95°C for 2 h. After cooling at room temperature, the sample was diluted to 50 ml with water and filtered with Schleicher & Schuell  filter paper (Dassel, Germany); then, 1 ml of the filtered solution was added to 9 ml of a 1% distilled nitric acid and analyzed with ICP-MS using hydrogen as reaction–collision gas. A standard addition calibration method was used to determine the selenium concentration, 50 ml of a 1% distilled nitric acid in ultrapure water was spiked with four different amounts of selenium (sodium selenite): 0.1, 0.25, 0.5 and 1 μg/l.
The selenium determination in milk and whey were conducted as described for feedstuffs except for the digestion solution made as follows: 5 ml of sample were added 7 ml distilled nitric acid and 3 ml of a water hydrogen peroxide solution (30% m/m). The standard addition method was used to confirm the analysis results and was obtained by spiking two amounts of selenium (10 and 20 μg/l) as sodium selenite to raw milk or whey samples.
The plasma selenium determination was as follows: 40 μl of plasma were added 360 μl of a 0.001% triton solution and 9.6 ml ultrapure water before analysis with ICP-MS. A Certified Reference Material Bovine Liver NIST 1577b (National Institute of Standards and Technology, Gaithersburg, MD, USA) containing 0.73 ± 0.06 μg selenium/g was used.
CO calculation
The iodine and selenium CO in milk was calculated at plateau condition (between the second and the fourth week in treatment for Experiment 1 and in the second week in treatment for Experiment 2) as:

Statistical analyses
Response variables from both experiments that were measured over time (DM intake and plasma selenium concentration only in Experiment 1, iodine and selenium ingestion and concentrations in milk, total excretion and CO in milk in both experiments) were subjected to ANOVA using the repeated statement in the mixed procedure of SAS (SAS Institute Inc., Cary, NC, USA release 9.1) in a completely randomized design (Experiment 1) and with a factorial approach (Experiment 2). In both experiments, the experimental unit was the cow.
In Experiment 1, the statistical model included fixed effects of treatment, time of sampling and the treatment × time of sampling interaction with the cow as the random variable.
Each variable analyzed was subjected to three covariance structures: spatial power law (SP(POW)), compound symmetry and unstructured. Using the Akaike information criterion and the Schwarz Bayesian criterion, the compound symmetry was the covariance structure that best fitted the model. Linear and quadratic contrasts were used to determine the nature of the response to the feeding level of iodine and selenium.
The statistical general model was

where Yijk = the dependent variable at time k on the jth subject assigned to treatment i; μ = overall mean; αi=fixed effect of treatment i (i = CTR, T1, T2); bij = random effect for subject j assigned to treatment i; γk = fixed effect of time; (αγ)ik = fixed effect of treatment × time interaction; εijk = residual error with covariance matrix.
The iodine concentration (μg/l) and total excretion (mg) in milk and the iodine and selenium CO (%), at steady-state condition, were regressed on the iodine and selenium intake (mg per cow per day), respectively, using the REG procedure of SAS and equations are proposed.
In Experiment 2, the statistical model included fixed effects of group milk yield, the level of iodine and selenium ingestion, the time of sampling and the milk yield × time of sampling and milk yield × level of iodine and selenium ingestion × time of sampling interactions with cow as the random variable. Each variable analyzed was subjected to three covariance structures: SP(POW), compound symmetry and unstructured. Using the Akaike information criterion and the Schwarz Bayesian criterion, the compound symmetry was the covariance structure that best fitted the model. Heterogeneous variance with group = milk yield × level of iodine and selenium interaction was used.
The statistical general model was

where Yijkml = the dependent variable at time k on the jth subject assigned to treatment i; μ = overall mean; αm = mth level of factor milk yield (m = H, A, L); βl = lth level of factor iodine and selenium inclusion (l = 1, 2); (αβ)ml = fixed effect of interaction among factor m and l; bij = random effect for subject j assigned to treatment i (j = 1−5, i = L1, L2, A1, A2, H1, H2); γk = fixed effect of time; (αβγ)mlk = fixed effect of milk yield × level of iodine and selenium ingestion × time of sampling interaction; εijmlk = residual error with covariance matrix.
In both experiments, significance was declared at P < 0.05 and a trend at 0.05 < P < 0.1
Results
Experiment 1
The average milk yields during the experimental period, considering the milk yield before the supplementation period, were 27.3, 27.5 and 27.1 kg per cow per day, respectively, for the CTR, T1 and T2 groups. The average composition of milk (g/100 g) in the groups were 3.8%, 3.8% and 3.9% for fat, 3.4%, 3.4% and 3.5% for protein and 4.9%, 4.9% and 5% for lactose, respectively, for the CTR, T1 and T2 groups.
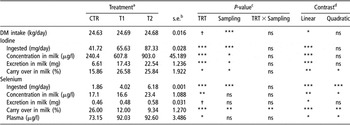
There were no significant effects of treatments on voluntary DM intake. The calculated total iodine ingestions were 41.72, 65.63 and 87.33 mg per cow, respectively, for the CTR, T1 and T2 groups (Table 2). There were significant main effects of treatment (P < 0.001, linear) and time of sampling (P < 0.05) on milk iodine concentration and total excretion. The iodine concentration in milk increased promptly at day 4 in treatment for the T1 and T2 groups, then plateauing until the end of the experiment (Figure 1a). The milk iodine contents increased 2.5- (T1) and 3.8-fold (T2) over the CTR (240.4 μg/l), and the total iodine excretions in milk were 2.6- (T1) and 3.4-fold (T2) over the CTR (6.61 mg). Also, the CO of iodine to milk increased (P < 0.05, quadratic) 1.7- (T1) and 1.6-fold (T2) over the CTR (15.86%). The treatment × time of sampling interaction was not significant in any of the measured variables.
Experiment 1: Dry matter (DM) intake, iodine and selenium concentration, total excretion, carry over in milk and plasma selenium concentration of animals fed different level of iodine and selenium (n = 4)

aCTR = base diet (1.71 mg iodine and 0.08 mg selenium/kg DM); T1 = base diet plus 23.8 mg iodine and 2.2 mg selenium; T2 = base diet plus 45.5 mg iodine and 4.3 mg selenium.
bStandard error of mean.
cStatistical significance of effects of treatment (TRT), sampling (S) and their interaction (TRT × S) is indicated.
dContrast significance of treatment effect is indicated ns = non-significant; †P < 0.10; *P < 0.05; **P < 0.01; ***P < 0.001.
Experiment 1: iodine (a) and selenium (b) concentration (mean ± s.e.) in milk from control (CTR) (⧫), T1 (▪) and T2 (▴) cows. CTR = base diet (1.71 mg iodine and 0.08 mg selenium/kg DM); T1 = base diet plus 23.8 mg iodine and 2.2 mg selenium; T2 = base diet plus 45.5 mg iodine and 4.3 mg selenium.

The milk iodine concentration, total excretion in milk or the CO regressed on the iodine intake produced the following equations:


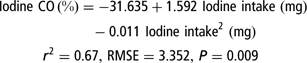
The total daily selenium intake was 1.86, 4.02 and 6.18 mg per cow, respectively, for the CTR, T1 and T2 groups.
The milk selenium content was affected by the treatments (P < 0.05, quadratic), whereas no differences were observed for the total selenium excretion in milk (Table 2). In both variables, there were no effects of sampling and treatment × time of sampling interactions. The milk selenium concentration peaked at day 6 in the T2 group (28.2 μg selenium/l), then it levelled to values about 1.5-fold higher than what was measured in the CTR group (Figure 1b).
The selenium CO was affected (P < 0.01) by treatments, time of sampling and by the interaction of treatments × time of sampling. The CO decreased (P < 0.01) from 26% in CTR, to 12% in T1 and 9.3% in T2 groups.
The average plasma selenium concentrations during the adaptation period (week 0) were 82.2, 76.8 and 68.8 μg/l, respectively, for the CTR, T1 and T2. The plasma selenium concentrations measured in weeks 4 and 5 on treatment, considering the week 0 values, were affected (P < 0.05) by treatment (Table 2).
The average weight of the curds was 919 ± 114 g with a weight efficiency of 0.11 per processed milk. In the curdling process, the iodine showed a mild concentration in the cheese (about 1.7-fold) and its average fraction was 0.16 ± 0.04, whereas the selenium concentrated about five- to sevenfold in the curdle reporting an average selenium concentration of 117.9 ± 4.8 μg/kg, 141.5 ± 3.4 and 158.8 ± 6.8 μg/kg, respectively, in CTR, T1 and T2 groups. The average curdle/milk ratio for selenium was 0.74 ± 0.06.
Experiment 2
The average milk yields during the experimental period were 21, 29.1 and 38.7 kg per cow per day, respectively, for the L, A and H groups. The milk yield decreased during the experiment with a slope (l/day) for the H group of −0.26, compared to −0.08 and −0.13, respectively, for the A and L groups. The average composition of milk (g/100 g) in the groups were 4.1, 3.8 and 3.5 for fat, 3.6, 3.4 and 3.4 for protein and 5, 5.2 and 5.2 for lactose, respectively, for the L, A and H groups.
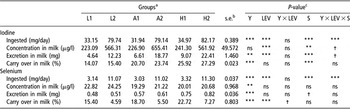
The iodine concentration and total excretion in milk were increased (P < 0.05) by the level of iodine given to cows (Table 3). There was no effect on milk iodine concentration, either from the level of milk yield or from the milk yield × treatment interaction; however, the total amount of iodine excretion in milk was affected (P < 0.05) by the level of milk yield. The iodine CO was only affected (P < 0.05) by the milk yield.
Experiment 2: Dry matter (DM) intake, iodine and selenium concentration, excretion and carry over in milk of animals with different levels of milk yield and of iodine and selenium supplementation (n = 5)

aL1 = low milk yield, base diet (1.55 mg iodine and 0.15 mg selenium/kg DM); L2 = low milk yield, base diet plus 47.2 mg iodine and 8 mg selenium; A1 = average milk yield, base diet; A2 = average milk yield, base diet plus 47.2 mg iodine and 8 mg selenium; H1 = high milk yield, base diet; H2 = high milk yield, base diet plus 47.2 mg iodine and 8 mg selenium.
bStandard error of mean.
cStatistical significance of effects of milk yield (Y), level of iodine and selenium inclusion (LEV), milk yield × level of iodine and selenium inclusion interaction (Y×LEV), sampling (S) and milk yield × level of iodine and selenium inclusion × sampling interaction (Y × LEV × S) is indicated: ns = non-significant; †P < 0.10; *P < 0.05; **P < 0.01; ***P < 0.001.
The level of selenium inclusion did not affect the selenium milk concentration and total excretion, which were affected (P < 0.01) by the level of milk yield. The selenium CO was affected (P < 0.05) either by the milk yield or by the level of selenium inclusion. No milk yield × level of selenium intake or milk yield × level of selenium intake × time of sampling interactions were observed for measured variables.
Discussion
The iodine content in milk increases when using iodine containing disinfectants in teats dipping procedure after milking (Flachowsky et al., Reference Flachowsky, Schöne, Leiterer, Bemmann, Spolders and Lebzien2007). In both our experiments, an iodine free clorexidine spray solution was used as postdipping treatment to avoid any iodine in milk due to the milking procedure.
The amount of iodine in milk reflects the dietary iodine content and it is an indicator of the iodine status of the animal (Berg et al., Reference Berg, Padgitt and McCarthy1988). However, the source of iodine is important in determining the milk iodine content – for an iodine intake of 81 mg per cow, the KI is less efficient than the organic iodine EDDI in raising the milk iodine content, 379 v. 895 μg/l, respectively (Miller and Swanson, Reference Miller and Swanson1973). Our data using KI produced milk iodine concentrations close to the organic iodine supplement. No recent data are currently available on the difference between KI and EDDI.
The concentration of iodine in milk reached a plateau condition at day 6, close to 7 to 10 days as reported by Miller et al. (Reference Miller, Swanson and Spalding1975). In our experiment, the increase of the iodine CO related to iodine intake was within the reported range of 10% (Miller et al., Reference Miller, Swanson and Spalding1975) in cows fed a normal value of iodine (e.g. 0.45 mg iodine/kg DM as suggested by NRC) and 30% observed in iodine supplemented cows (Hemken et al., Reference Hemken, Vandersal, Oskarsson and Fryman1972).
The milk iodine concentration is correlated with plasma iodide and with the iodine concentrations in feeds and water (Alderman and Stranks, Reference Alderman and Stranks1967). Daburon et al. (Reference Daburon, Fayart and Tricaud1989) report a relation between iodine concentration in milk and stage of lactation in cows given a low iodine amount. However, in presence of limited supply of iodine, the amount excreted through the mammary gland can be effectively reduced by the animal to prevent the reduction of thyroxin (Swanson, Reference Swanson1972). In our experiment where milk yield and stage of lactation were confounded, no relation between milk iodine concentration and milk yield or stage of lactation was detected.
Even though there is evidence of a close connection of iodine with fats, the average partition of total iodine into curd agreed with Sieber (Reference Sieber1998) showing a high solubility since the biggest amount of iodine was found in the milk–whey. Thus, ‘ricotta’ or fresh cheeses such as ‘mozzarella’ produced by iodine-enriched milk could represent a very good source of iodine.
Based on iodine milk concentration of milk produced in Experiment 1, if we consider the milk of T1 cows for human nutrition, an intake of 150 ml of milk would fully cover the iodine recommended daily allowance (RDA) in children (90 μg/day), 45% of a lactating woman’s RDA (200 μg/day) and 60% of an adults RDA (150 μg/day); the RDA would be easily exceeded when considering the milk from the T2 cows.
Because of the high content of Se-methionine, the addition of selenium yeast (SY) to diets is generally considered the best way to improve milk content of selenium. The SY has several advantages over the inorganic selenium supplement selenite; however, in conditions where antagonists (i.e. sulfur more than 2% in the diet) are not a matter of concern, the selenium inorganic source is probably the most cost-effective option and lactating cows should be supplemented with selenium that is predominantly from inorganic sources (Weiss, Reference Weiss2005). The inorganic selenium was used in both our trials, also to better reflect the spread habits in Italian farms.
The selenium contribution of feeds used in the TMR led to low selenium content of the basal TMR used in Experiment 1. Thus, control cows received a selenium deficient diet (2 mg selenium per cow per day) showing a plasma content of selenium lower than 80 μg/l, which is the minimum level suggested by NRC (2001). The similar concentration of selenium in milk from T1 compared to the CTR group could be explained by the low plasma selenium level at the beginning of the experiment and the low selenium intake of cows in the T1 group. The selenium content in milk from T2 cows (23.4 μg/l) was numerically similar to values reported by Juniper et al. (Reference Juniper, Phipps, Jones and Bertin2006) on cows fed either SY or sodium selenite (27.8 and 20.8 μg/l in milk from cows fed 0.27 and 0.25 mg/kg DM of selenium as SY or sodium selenite, respectively). In our condition, when supplementing selenium, the CO rate decreased as expected (Knowles et al., Reference Knowles, Grace, Wurms and Lee1999), whereas the plasma selenium concentration increased to values that are in agreement with Maus et al. (Reference Maus, Martz, Belyea and Weiss1980) since T2 cows were fed about 6 mg/day of selenium and were showing a plasma content of selenium higher than 80 μg/l.
The increment of the selenium concentration in milk was nonlinear as reported previously (Knowles et al., Reference Knowles, Grace, Wurms and Lee1999). Our data showed a maximum level (about twofold higher than the control) already at day 3, with plateau at day 10 until the end of the trial (Figure 1b), whereas in previous works, the selenium concentrations in milk and plasma tend to remain at steady condition in about 1 to 2 weeks after supplementation (Heard et al., Reference Heard, Stockdale, Walker, Leddin, Dunshea, McIntosh, Shields, McKenna, Young and Doyle2007) and reach their maximums in about 40 days (Conrad and Moxon, Reference Conrad and Moxon1979). Givens et al. (Reference Givens, Allison, Cottrill and Blake2004) report a linear relationship between milk and dietary selenium concentrations in which the milk selenium (μg/l) = 8.03 + 12.04 diet selenium (mg/kg DM) with an r 2 = 0.96. This was not supported by our results where the dose response on milk selenium concentration was nonlinear in Experiment 1 and the milk yield was the only significative factor in Experiment 2.
The CO of supplemented selenium was also calculated considering the difference between total excretion of selenium in milk of each treated cow in the T1 and T2 groups and the average value of selenium excreted in milk of CTR group, and then differences were expressed on the supplemented selenium. The COs were similar between treated groups and were 0.93% for T1 and 2.71% for T2. According to Conrad and Moxon (Reference Conrad and Moxon1979), the supplementation of selenium to already adequate diet for the selenium content does not result in a significant increase of the milk selenium concentration and with CO lower than 1%. In Experiment 2, with diets adequate for the selenium content, the selenium CO ranged between 4.6% and 7.3% in selenium supplemented cows with significant main effects of milk yield and also of level of selenium inclusion. Thus, the different selenium CO observed in Experiments 1 and 2 on cows receiving a similar selenium supplementation could be related to the different amount of selenium coming from feeds, almost double in Experiment 2. Also, a negative correlation between milk selenium concentration and milk yield (−0.44; P = 0.004) could have contributed to the lower CO measured in Experiment 2.
Our partition of the selenium into curd supported data from Knowles et al. (Reference Knowles, Grace, Wurms and Lee1999) on the casein fraction, thus the selenium was a more suitable element to produce enriched hard cheese through supplemented animal feedstuffs than iodine. When considering a daily intake of 150 ml of milk per head, for an RDA of 8, 20 and 35 μg selenium/day, the milk from T2 cows would provide 44, 18 and 10% of the RDA, respectively, for infants, children and adults. These results were from 0.6- to 2.5-fold lower than what was obtained using milk selenium concentration of previous works on cows fed 0.3 to 0.5 mg/kg DM of Se as SY. In Europe, there are no current guidelines about the optimum selenium concentration in milk, although Aspila (Reference Aspila1991) suggests 20 μg/l as a desirable concentration. Also, the author concluded that, when using sodium selenite as the source of selenium, cows should be fed diets with at least 0.7 mg selenium/kg DM, which is above the current EU maximum allowed concentrations of 0.5 mg/kg DM (European Community, 2005). Our data showed that the above value of milk selenium concentration could be easily reached in cows fed 0.3 mg/kg DM. Givens et al. (Reference Givens, Allison, Cottrill and Blake2004) did not achieve 20 μg selenium/l of milk even with dietary selenium concentrations over the maximum allowed by the 05/1459 EC Commission Regulation (European Community, 2005).
An interesting study on the bioavailability of selenium in milk of cows supplemented by either sodium selenite or SY was carried out by Muñiz-Naveiro et al. (Reference Muñiz-Naveiro, Domínguez-González, Bermejo-Barrera, Bermejo-Barrera, Cocho and Fraga2006). The study compares the bioavailability of selenium in milk from cows fed a diet containing 0.3 mg selenium as sodium selenite/kg DM or 0.2, 0.3, 0.4 and 0.5 mg selenium as SY/kg DM. The bioavailability of milk selenium is similar up to a selenium supplementation of 0.3 mg/kg DM, independently of the selenium source used. With selenium supplementation over 0.3 mg/kg DM, the milk from the cows supplemented SY have higher selenium availability and, even though the increment is linear with relation to supplementation, the relative increment of digestibility is only about 10 to 15% over the milk from cows fed 0.3 mg selenium as sodium selenite/kg DM.
Conclusions
The results help to better understand factors involved in improvement of milk iodine and selenium concentration and CO following supplementation with inorganic sources to dairy cows.
While iodine and selenium can be supplemented in different forms according to countries regulations, we can assume that an intake of about 15 to 20 mg/day of iodine as KI raises the milk iodine content to a value suitable for the human RDA.
The iodine seems more suitable for milk fortification through feed supplementation. Even though CO decreases in supplemented cows, because the selenium is strictly connected to proteins of milk, it is largely transferred into cheese.
Further studies could be helpful to better understand the bioavailability of milk selenium from cows fed SS or SY, and above all, it will be valued the ratio between ‘human health profit’/‘farming cost and animals health’.
Acknowledgements
This study was supported by the FISR project ‘Qualità dei prodotti di origine animale e salute umana: miglioramento della frazione lipidica e minerale del latte e dei latticini di vacca, pecora e capra al fine di accrescere il valore nutraceutico e la sicurezza di questi alimenti’.