I. INTRODUCTION
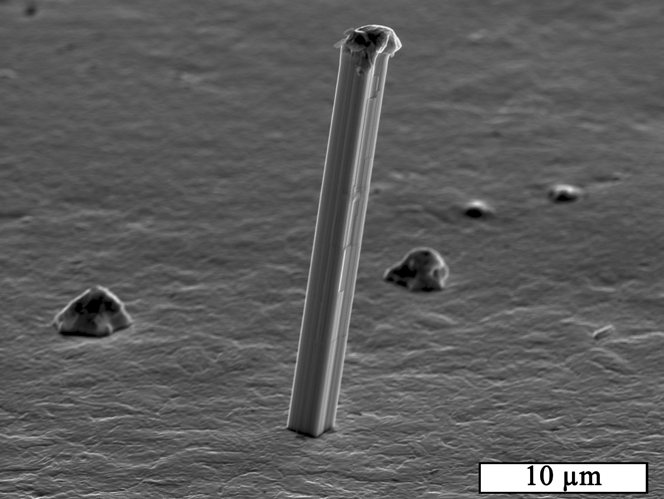
Tin whiskers grow spontaneously with a length scale from micrometers to millimeters from Sn-based films (Fig. 1), posing a reliability risk in Pb-free electronics. Whisker formation is a stress relaxation mechanism,Reference Fisher, Darken and Carroll1,Reference Tu and Li2 and the possible sources of stress include: (i) Cu6Sn5 intermetallic compound (IMC) formation,Reference Tu and Li2–Reference Tu9 (ii) thermoelastic stresses due to the coefficient of thermal expansion (CTE) mismatch between β-Sn films and the substrates during thermal cycling,Reference Tu9–Reference Suganuma, Baated, Kim, Hamasaki, Nemoto, Nakagawa and Yamada11 (iii) mechanical stresses due to bending or other external loads,Reference Fisher, Darken and Carroll1,Reference Tu9 (iv) plating stresses,Reference Williams, Moon, Boettinger, Josell and Deal12 and (v) environmental stresses due to formation of an oxide layer or corrosion.Reference Osenbach, DeLucca, Potteiger, Amin, Shook and Baiocchi13,Reference Oberndorff, Dittes, Crema, Su and Yu14 Several factors have been identified that can mitigate (or exacerbate) stresses in Sn films, including film microstructure,Reference Boettinger, Johnson, Bendersky, Moon, Williams and Stafford3,Reference Zhang and Schwager15–Reference Pedigo, Handwerker and Blendell17 electrolytes used for plating,Reference Pedigo, Handwerker and Blendell17 film composition,Reference Sarobol, Pedigo, Su, Blendell and Handwerker18 and crystallographic texture (preferred grain orientations) developed during plating.Reference Sarobol, Pedigo, Su, Blendell and Handwerker18,Reference Pedigo19 For example, the addition of Pb to electroplated β-Sn films successfully reduces the propensity to form whiskers. Moreover, replacing a columnar as-plated microstructure with an equiaxed microstructure has been found to increase a film's ability to relax stresses rapidly.Reference Boettinger, Johnson, Bendersky, Moon, Williams and Stafford3,Reference Jadhav, Williams, Pei, Stafford and Chason16,Reference Fang, Mathew, Osterman and Fecht20
SEM image of a whisker and hillocks growing out of an electroplated Sn–Cu film.

In a few studies, whisker densities have been related to a crystallographic texture (orientation and strength) in β-Sn films. Zhang and SchwagerReference Zhang and Schwager15 reported that the addition of Pb in β-Sn films changed the dominant texture from (321) to (220) [a film with an (hkl) texture or an (hkl) textured film means that a higher than random fraction of grains have their (hkl) crystallographic planes nearly parallel to the film surface. These oriented grains are referred to as (hkl) grains]. Sarobol et al.Reference Sarobol, Pedigo, Su, Blendell and Handwerker18 reported that Pb in β-Sn films leads to a transition of the dominant texture from (111) to (001) with a relatively low whisker density. In addition, PedigoReference Pedigo19 observed a trend toward increasing the whisker density in pure Sn and Sn-alloyed films from the same base electrolyte with increasing texture strength. In each of these studies, however, there are multiple variables, including but not limited to the electrolyte composition, current density, and film alloying additions, all of which play a role in determining the film texture.
In addition to the global effect of crystallographic textures on whisker densities for β-Sn films, another question is on the local effects: why does only one grain out of thousands, on average, form a whisker? A growth model was recently proposed based on grain boundary sliding-limited diffusional creep as a function of grain geometry, which leads to a bias toward specific grains forming whiskers.Reference Sarobol, Blendell and Handwerker21,Reference Sarobol, Wang, Chen, Pedigo, Koppes, Blendell and Handwerker22 Sobiech et al.Reference Sobiech, Wohlschlogel, Welzel, Mittemeijer, Hugel, Seekamp, Liu and Ice23 proposed that the location of whiskers is related to inhomogeneous IMC distributions, which lead to local stresses in β-Sn films plated on Cu substrates. However, Pei et al.Reference Pei, Jadhav and Chason24 demonstrated that IMCs were widespread and large IMCs that create local stresses were not found preferentially underneath the whisker locations. In addition, whisker formation was found in thermally cycled β-Sn films on W substrates, in which there was no IMC formation in the films.Reference Clore10
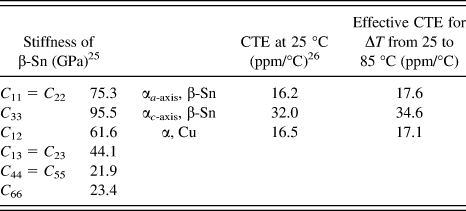
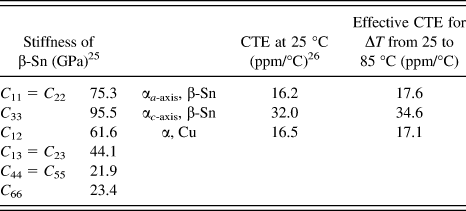
Lee and LeeReference Lee and Lee5 proposed that whiskers form to relax local stresses between misoriented grains because of the mechanical anisotropy of β-Sn, which has a body-centered-tetragonal crystal structure (a = 0.5832 nm; c = 0.3183 nm) with highly anisotropic elasticityReference House and Vernon25 and thermal expansionReference Touloukian, Kirby, Taylor and Desai26 (Table I). Local grain orientations around whiskers have been reported in a few studies using x-ray synchrotron micro-diffraction. Choi et al.Reference Choi, Lee, Tu, Tamura, Celestre, MacDowell, Bong and Nguyen27 reported that a whisker grain had (210) orientation, which differed from the film (321) texture. Our previous study reported that surface defect grains (whiskers and hillocks) in (334) textured Sn–Cu films were found to have orientations that differed from the dominant texture, leading to regions with inhomogeneous elastic and thermal properties in the films.Reference Sarobol, Chen, Pedigo, Su, Blendell and Handwerker28 For finite element simulations using the measured grain orientations, a local high elastic strain energy density (ESED) was found for a whisker grain. In contrast, a relatively low ESED for the same whisker was calculated using synchrotron micro-diffraction measurements of strain. These results imply that grains misoriented with respect to the adjacent grains can induce local high ESEDs due to the β-Sn anisotropy, resulting in specific preferred sites for stress relaxation to occur. These previous findings indicate that understanding the correlation of the β-Sn anisotropy with whisker formation is crucial for predicting the propensity to form whiskers as well as for predicting the preferred whisker site for different β-Sn films in terms of film textures and local grain orientations.
The elastic and thermal properties of β-Sn and Cu.
Since it is difficult experimentally to change the texture without changing other film characteristics, a numerical simulation using β-Sn films with a range of textures was performed in this work. This allows us to analyze the global effect of crystallographic textures on thin film stress accumulation and relaxation related to the propensity to form whiskers, as well as to determine the local grain orientations for preferred whisker sites. In this study, two different stress-generating mechanisms were considered for simulating ESED distributions: (i) elastic stresses induced by IMC formation in β-Sn films at room temperature and (ii) thermoelastic stresses induced by the CTE mismatch between β-Sn films and Cu substrates, as well as the grain–grain interactions due to the anisotropic thermal expansion of β-Sn during thermal cycling. The simulation demonstrates that high ESEDs are primarily localized in grains with the c-axes aligned with the film plane depending on their local grain orientations, while different textured β-Sn films have significantly different properties and responses to elastic stresses versus thermoelastic stresses. Thus, a Sn film's propensity to form whiskers is predicted to be increased or reduced depending upon the types of film textures and specific stress-generating mechanisms.
II. EXPERIMENTAL DETAILS
A. Film microstructure
ESED distributions in β-Sn films with a range of textures for simulated stress conditions were determined using object-oriented finite-element analysis (OOF).Reference Langer, Fuller and Carter29,Reference Reid, Lua, Garcia, Coffman and Langer30 To create a two-dimensional (2D) free-standing film in OOF, a skeleton was built for a polycrystalline microstructure of 938 grains (140 edge grains) using a Voronoi tessellation [Fig. 2(a)]. The dimension of this 2D microstructure was set to 100 μm × 100 μm, chosen to match the typical grain size of ∼3 μm. In the finite element calculation, all the grains were meshed and refined using linear triangular elements to the order of 40,000 elements and 80,000 nodes to match the grain boundaries.
The skeleton microstructure, ND grain orientation maps, and simulated ESED distributions (kJ/m3). (a) A 2D polycrystalline microstructure of 938 grains generated using a Voronoi tessellation. (b)–(e) ND grain orientation maps in inverse pole figure colors (inset) for strongly textured (001), (111), (110), and (100) films simulated using r = 0.15, respectively. The corresponding ESED distributions (f)–(i) for elastic stresses induced by IMC formation at room temperature, and (j)–(m) for thermoelastic stresses induced during thermal cycling. ESED distributions for the same stress-generating mechanism are scaled in the same manner.
To generate grain orientations for β-Sn films with different textures, an algorithm was developed based on the March–Dollase function, which is a pole–density profile function indicating the probability of finding an hkl pole at an angle to the film normal direction (ND), while the angular profile (called the March–Dollase distribution) fits the experimental data well for low-symmetry materials with fiber textures.Reference Blendell, Vaudin and Fuller31,Reference Dollase32 For a given March–Dollase distribution, the angular deviation (αi) in [0, π/2] for each grain can be obtainedReference Blendell, Vaudin and Fuller31:
 $${\rm{\alpha }}_i = {\rm{arccos}}\left( {\sqrt {{{r^{ - 3} \times \left( {1 - C_i } \right)^2 } \over {1 + \left( {r^{ - 3} - 1} \right) \times \left( {1 - C_i } \right)^2 }}} } \right)\quad ,$$
where a random number C i in [0, 1] is generated to determine an angle for each grain and a single fitting parameter r describes texture strength. A fully random grain orientation distribution has r = 1, while a distribution for a perfect fiber texture has r = 0 [for a film with a perfect (hkl) texture, all the grains have their (hkl) planes exactly parallel to the film surface (the same orientation with respect to the film ND) and randomly oriented with respect to an in-plane direction]. As a grain orientation relative to a sample coordinate can be specified by 3 rotation matrices using the Euler angles (ϕ1, φ, ϕ2) and the Bunge definition,Reference Engler and Randle33 a procedure using rotation angles (ϕ1,i, φi, ϕ2,i) for each grain was applied here. To generate grain orientations for a given (hkl) texture, the initial grain orientation has the hkl pole aligned with the film ND. Then, the rotation angle φi around a random direction perpendicular to the pole is generated using Eq. (1) to determine the angular deviation of the pole from the film ND, while ϕ1,i and ϕ2,i are random rotations to ensure that all the possible orientations for a given texture can be obtained.
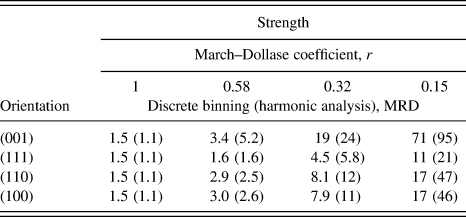
Four representative texture orientations were chosen: (001), (110), (111), and (100) to demonstrate the anisotropic response of β-Sn to simulated strains. Grain orientations were repeatedly populated for each texture to fit the March–Dollase function and were randomly assigned to each grain in the microstructure; thus, there is no relationship between the orientations of neighboring grains. Over 10,000 (11,256) grain orientations were generated using r = 1, 0.58, or 0.32 as well as for perfect fiber textures (r = 0), while 28,140 grain orientations were generated using r = 0.15, chosen to ensure that the highly misoriented grains are mostly surrounded by grains with orientations belonging to the film texture. It has to be noted that the March–Dollase function only works for a pole with no multiplicity. As the texture strength can be described in terms of multiples of a random distribution (MRD), Table II lists the corresponding MRD evaluated for all the simulated orientations for each texture using the discrete binning methodReference Matthies and Vinel34 and harmonic series expansion,Reference Bunge35 which both take multiplicity of a pole into consideration. The simulated textures using r = 0.15 have MRDs in a range from 10 to 100 depending on texture orientations, which is comparable to the reported MRDs evaluated using the E-WIMV model for electroplated pure Sn and Sn–Cu films.Reference Pedigo19
MRDs evaluated using the discrete binning method (bin size: 5°) and harmonic analysis (series rank: 34) for textures generated using the March–Dollase function with fitting coefficient r. The Gaussian half-width for the smoothing calculation was set to 5°.
B. Elastic stresses for room temperature aging
To determine the effect of β-Sn anisotropy on global and local film properties, elastic stresses in each grain can be solved using Hooke's law and ESEDs can be calculated with elastic strains:
 $${\rm{\sigma }}_{ij} = C_{ijkl} {\rm{\varepsilon }}_{kl} \quad ,$$
 $${\rm{ESED}}_{{\rm{grain}}} = {1 \over 2}{\rm{\sigma }}_{ij} {\rm{\varepsilon }}_{ij} = {1 \over 2}C_{ijkl} {\rm{\varepsilon }}_{ij} {\rm{\varepsilon }}_{kl} \quad ,$$
where σij and εij are the elastic stress and strain tensors, respectively, and Cijkl is the stiffness tensor, with repeated subscripts implying summation according to the Einstein summation convention. Using the generated microstructure, OOF solves the linear elasticity equation for local stresses in mechanical equilibrium, and a plane-stress condition (σ33 = σ23 = σ13 = 0) was imposed assuming that the free surface of the thin film was stress-free in the out-of-plane direction. The stiffness of β-Sn (Table I) was assigned to each of the grains. For room temperature aging conditions, elastic stresses due to IMC formation were generated assuming an in-plane biaxial compressive strain of ε11 = ε22 = −0.01%. This value of the biaxial compressive strain imposed on the films was chosen based on several different types of measurements. A steady-state compressive stress of approximately 5–10 MPa due to IMC growth has been measured in pure Sn films with a copper layer in both cantilever beam and wafer curvature experiments as well as in x-ray diffraction measurements.Reference Boettinger, Johnson, Bendersky, Moon, Williams and Stafford3,Reference Pedigo, Handwerker and Blendell17,Reference Jadhav, Buchovecky, Reinbold, Kumar, Bower and Chason36,Reference Sobiech, Welzell, Mittemeijer, Hügel and Seekamp37 The stress within the IMC layer is unequivocally tensile as established by Boettinger et al.Reference Boettinger, Johnson, Bendersky, Moon, Williams and Stafford3 and Jadhav et al.Reference Jadhav, Buchovecky, Reinbold, Kumar, Bower and Chason36 The volume changes accompanying IMC formation were analyzed in great detail by Boettinger et al. using a multilayer Stoney's equation and a wide range of reference states to establish the volume changes associated with IMC formation. With a compressive stress of approximately 10 MPa created in the Sn layer by IMC formation and using 100 GPa as an upper bound of the biaxial modulus,Reference Pedigo19 this corresponds to an in-plane compressive strain of approximately −0.01%. The use of a uniform biaxial strain was further supported by experiments by Pei and Chason who determined that whiskers did not form preferentially near the largest IMC particles along the Sn–Cu interface.Reference Pei, Jadhav and Chason24 In addition, the bulk yield stress for polycrystalline Sn was reported to be ∼11 MPa at room temperature,Reference Park, Long, Haberman, Ma, Dutta, Mahajan and Jadhav38 yielding again an in-plane strain of −0.01%. For a polycrystalline film with a fiber texture in the film ND, the average ESED is:
 $${\rm{ESED}}_{{\rm{film}}} = M_{\left( {hkl,{\rm{MRD}}} \right)} {\rm{\varepsilon }}_{{\rm{biaxial}}}^2 \quad ,$$
where M (hkl,MRD) is the effective in-plane biaxial modulus as a function of texture orientation and strength, and εbiaxial = ε11 = ε22 is the in-plane biaxial elastic strain.Reference Wu, Wu, Wang, Yu and Du39
C. Thermoelastic stresses for thermal cycling
For thermal cycling conditions, thermoelastic stresses are induced due to the CTE mismatch between the β-Sn film and the Cu substrate, as well as the grain–grain interactions due to the anisotropic thermal expansion of β-Sn grains. Misfit strains induced due to the CTE mismatch and the average ESED in a film can be expressed as:
 $${\rm{\varepsilon }}_{{\rm{misfit}}} = ({\rm{\alpha }}^{{\rm{Cu}}} - {\rm{\alpha }}_{{\rm{(}}hkl{\rm{,MRD)}}}^{{\rm{Sn}}} {\rm{)}}\Delta T\quad ,$$
 $${\rm{ESED}}_{{\rm{film}}} = {\rm{M}}_{{\rm{(}}hkl{\rm{,MRD)}}} ({\rm{\alpha }}^{{\rm{Cu}}} - {\rm{\alpha }}_{{\rm{(}}hkl{\rm{,MRD)}}}^{{\rm{Sn}}} )^2 \Delta T^2 \quad ,$$
where ΔT is the temperature change, αCu is the CTE of Cu substrates, and  ${\rm{\alpha }}_{(hkl,{\rm{MRD}})}^{{\rm{Sn}}}$is the effective in-plane CTE of β-Sn films. Here,
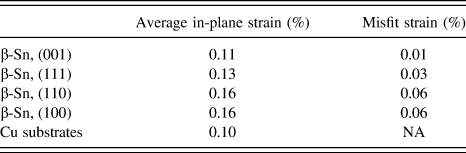
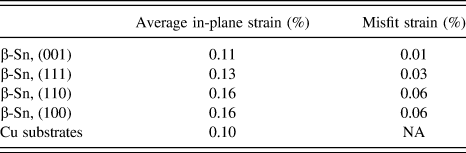
 ${\rm{\alpha }}_{(hkl,{\rm{MRD}})}^{{\rm{Sn}}}$also varies as a function of texture orientation and strength. In the 2D simulation, thermoelastic stresses due to the CTE mismatch were simulated by constraining the in-plane thermal strain of the free-standing β-Sn film to match the thermal strain of the Cu substrate for a temperature change from 25 to 85 °C, leading to the film being in compression for the heating phase. It should be noted that, at 25 °C, the CTE of β-Sn along the a-axis is 16.2 ppm/°C, which is slightly lower than the CTE of Cu, 16.5 ppm/°C. However, the CTE increases with increasing temperature,Reference Touloukian, Kirby, Taylor and Desai26 and the CTE of β-Sn along the a-axis becomes higher than the CTE of Cu above 37 °C (estimated by interpolation). To reflect the actual thermal strain induced at 85 °C, the effective CTE values for β-Sn and Cu were determined by integration of the temperature-dependent CTE over the temperature range from 25 to 85 °C, instead of using the CTE at 25 °C in the simulation. The imposed misfit strain due to a ∆T = 60 °C is highly dependent on the film texture, as indicated in Eq. (5). Table III lists the average in-plane strains induced in free-standing strongly textured β-Sn films and Cu substrates and the corresponding misfit strains for β-Sn films constrained by Cu. The imposed misfit strains on β-Sn films with different texture orientations are 0.01% for the (001) texture; 0.03% for the (111) texture; 0.06% for the (110) and (100) textures. The strain of 0.06% induced by thermal cycling will likely generate stresses above the yield strength. These calculations suggest that the effect of thermal cycling can be more significant than that of IMC formation on accelerating whisker growth, depending on film textures, substrates, as well as applied temperature profiles and ranges.40
Average in-plane strains induced in free-standing strongly textured β-Sn films and Cu for a temperature change from 25 to 85 °C, and the corresponding misfit strains for β-Sn films constrained by Cu.
III. RESULTS
In this simulation, all the β-Sn films exhibited a fiber texture in the film ND. The ND grain orientation maps [Figs. 2(b)–2(e)] show examples of the grain orientations for (001), (111), (110), and (100) textured films simulated using r = 0.15 (referred to as strongly textured films below). The corresponding ESED distributions were simulated for elastic stresses [Figs. 2(f)–2(i)] and for thermoelastic stresses [Figs. 2(j)–2(m)]. The same scale is used for the same stress-generating mechanism to show the variation of the overall ESED for β-Sn films as a function of texture orientation. For elastic stresses, the lowest overall ESED was found in β-Sn films with strong (100) textures [Fig. 2(i)]. For thermoelastic stresses, the lowest overall ESED was found in β-Sn films with a strong (001) texture [Fig. 2(j)]. In addition to the overall ESED, the β-Sn films have ESEDs that varied locally from grain to grain. Thus, specific grain orientations associated with local high ESEDs were also identified in different textured β-Sn films for each stress-generating mechanism.
Normal direction inverse pole figures (ND IPFs) show the crystallographic grain orientation distributions with respect to the film ND for the textured β-Sn films and high ESED grains. The entire set of grain orientation distributions for strongly textured (001), (111), (110), and (100) films were plotted [Figs. 3(a)–3(d)], while the orientation distribution of grains with high ESEDs (top 1%) for each stress-generating mechanism was plotted to determine the preferred grain orientations for inducing high ESEDs.
ND IPFs showing grain orientation distributions (a)–(d) for all the grains in strongly textured (001), (111), (110), and (100) films, respectively. Orientations of high ESED grains (top 1%) for each texture are shown in ND IPFs (e)–(h) for elastic stresses and (i)–(l) for thermoelastic stresses. The color scale indicates MRD, and the number in each ND IPF indicates the max MRD evaluated using the discrete binning method.
For elastic stresses [Figs. 3(e)–3(h)], β-Sn films with strong (001) and (111) textures have high ESEDs induced mostly in (100) grains oriented away from the film texture, with a small fraction still found in the film texture. On the other hand, β-Sn films with strong (110) textures have more (110) grains than (100) grains with high ESEDs, while β-Sn films with strong (100) textures have high ESEDs localized in (100) grains close to the film texture.
For thermoelastic stresses [Figs. 3(i)–3(l)], β-Sn films with strong (001) and (111) textures have high ESEDs induced between (110) and (100) grains oriented away from the film texture. However, β-Sn films with strong (110) and (100) textures mostly have high ESED grains with orientations close to the film texture. These ND IPFs demonstrate the orientation of high ESED grains as a function of texture orientation and specific stress-generating mechanisms. Next, the relative magnitudes of ESEDs for these grains relative to the other grains in the film were quantified to determine the effect of local grain orientations on ESED variation.
Relative frequency distributions of grain average ESEDs for strongly textured (001), (111), (110), and (100) β-Sn films are plotted for elastic and thermoelastic stresses [Figs. 4(a) and 4(b)]. The results show that strongly textured β-Sn films have different ESED distributions for different texture orientations and stress-generating mechanisms. For elastic stresses, grains in strongly textured (100) β-Sn films have a broad ESED distribution ranging from 0.16 to 1.2 kJ/m3, whereas strongly textured (001), (111), and (110) β-Sn films all have relatively narrow ESED distributions ranging from 0.60 to 1.5 kJ/m3. For thermoelastic stresses, ESED distributions of different strongly textured β-Sn films vary from 0.18 to 15 kJ/m3 for the (001) texture, 0.71–23 kJ/m3 for the (111) texture, 4.6–84 kJ/m3 for the (110) texture, and 0.97–93 kJ/m3 for the (100) texture. These results show that overall ESED distributions are highly dependent on texture orientations and stress-generating mechanisms. Strongly textured (100) β-Sn films have a lower ESED on average in comparison to other texture orientations for elastic stresses, while strongly textured (001) β-Sn films have a lower ESED on average for thermal stresses. In addition, the effect of film textures on ESEDs is more significant for thermoelastic stresses, where the overall ESEDs can differ by three orders of magnitude depending on textures.
Relative frequency distributions of grain average ESEDs in strongly textured (001), (111), (110), and (100) β-Sn films for (a) elastic stresses and (b) thermoelastic stresses.
Using the sample mode of the ESED distributions as a representative ESED of β-Sn films, the effect of texture strengths (r = 1, 0.58, 0.32, 0.15, or 0 in the March–Dollase function) was determined for elastic stresses [Fig. 5(a)] and thermoelastic stresses [Fig. 5(b)]. In general, the sample mode ESEDs of β-Sn films with the (001), (111), and (110) textures increase with increasing texture strength. The opposite was found for the (100) texture. For thermoelastic stresses, the sample mode ESEDs of (110) textured β-Sn films increase significantly with increasing texture strength. In contrast, the sample mode ESEDs of (001) and (111) textured β-Sn films decrease, and the sample mode ESEDs of (100) textured β-Sn films stay relatively constant with increasing texture strength.
Sample mode ESEDs plotted as a function of texture orientation [(001), (111), (110), and (100)] and the fitting coefficient (r = 0, 0.15, 0.32, 0.58, or 1), for (a) elastic stresses and (b) thermoelastic stresses. The fitting coefficients of 0 and 1 (solid diamond) denote a perfect fiber texture and a random texture, respectively.
IV. DISCUSSION
A. Local high ESEDs for preferred whisker sites
Crystallographic textures and local grain orientations are two crucial parameters that determine the global and local responses of β-Sn films to different stress-generating mechanisms. While texture orientation and strength determine the overall ESED of β-Sn films (Fig. 5), local grain orientations determine inhomogeneous in-plane responses to a given stress condition (Figs. 2 and 3), resulting in specific high ESED grains as preferred sites for whisker growth to reduce strain energy.
High ESED grain orientations in strongly textured (001) and (111) β-Sn films lie far away from the dominant film textures. For elastic stresses, the grains with local high ESEDs are primarily the (100) grains, whose orientations differ significantly from the (001), (111), and (110) film textures. This finding agrees well with our previous work,Reference Sarobol, Chen, Pedigo, Su, Blendell and Handwerker28 in which whisker and hillock grains were observed to be highly misoriented with respect to the film texture (334). The reason for high ESEDs localized in (100) grains is that, for a given strain imposed on the film, (100) grains with a low effective in-plane biaxial modulus have much higher elastic strains than the surrounding grains with other orientations. For thermoelastic stresses, the grains with local high ESEDs in strongly textured (001) and (111) β-Sn films are primarily the (110) and (100) grains [Figs. 3(i) and 3(j)]. Despite the (110) and (100) grains having different in-plane elasticity values, both of their c-axes (direction with the highest CTE) are oriented to be nearly parallel to the film plane. Consequently, the in-plane thermal expansion of the (110) and (100) grains is highly constrained by the surrounding grains, leading to local high thermoelastic stresses and local high ESEDs within the (110) and (100) grains.
In addition, grains with orientations close to the specific film textures also have local high ESEDs. For elastic stresses, such high ESED grains were found in all strongly textured β-Sn films in addition to (100) grains. While strongly textured (100) β-Sn films have high ESEDs localized mostly in (100) grains [Fig. 3(h)], strongly textured (110) β-Sn films have more (110) grains than (100) grains within the top 1% of grains with high ESEDs [Fig. 3(g)]. For thermoelastic stresses, the orientations of high ESED grains are highly localized in the film texture for strongly textured (110) and (100) β-Sn films. Since these high ESED grains and their adjacent grains have similar orientations with respect to the film ND, the grain–grain interactions that depend on the local grain orientations with respect to the in-plane direction need to be examined.
To determine the effect of local grain orientations with respect to the in-plane direction on inducing local high ESEDs, another set of simulations were performed. The ESEDs for β-Sn films with perfect fiber textures were simulated for elastic and thermoelastic stresses (Fig. 6). The results indicate that β-Sn films with perfect (001) textures have homogeneous ESEDs for both stress conditions [Figs. 6(a) and 6(e)], because β-Sn grains with their c-axes normal to the film plane have isotropic in-plane thermal expansion, with the same response to imposed in-plane biaxial strains regardless of the in-plane grain orientations. In contrast, the inhomogeneous ESEDs become more significant in β-Sn films with perfect (110) and (100) textures than perfect (111) textures [Figs. 6(b)–6(d) and 6(f)–6(h)]. This is because, for β-Sn grains with their c-axes parallel to the film plane, the elasticity and thermal expansion of each grain are highly anisotropic in the in-plane direction. Thus, these films have inhomogeneous ESED distributions due to the grain–grain interactions depending on the local grain orientations in the in-plane direction. This simulation indicates that, for thermoelastic stress conditions, local high ESEDs were induced in regions where multiple adjacent grains are oriented with their c-axes nearly pointing to each other in the film plane, generating high thermoelastic stresses in these grains due to the anisotropic thermal expansion. These results also imply that inhomogeneous ESED distributions for the same textured β-Sn films will be affected by different grain misorientation distribution functions.Reference Wanner, Fuller and Saylor41
Simulated ESED distributions (kJ/m3) for perfect fiber-textured (001), (111), (110), and (100) β-Sn films (a)–(d) for elastic stresses and (e)–(h) for thermoelastic stresses. ESED distributions for the same stress-generating mechanism are scaled in the same manner. A homogeneous ESED distribution is only found in β-Sn films with (001) perfect fiber textures.
In summary, local high ESEDs are preferentially induced in grains with their c-axes oriented to be nearly parallel to the film plane. For strongly textured (001) and (111) β-Sn films, the majority of high ESED grains are primarily (100) grains for elastic stresses or between (110) and (100) grains for thermoelastic stresses. However, grains with orientations close to the film texture can still have ESED variations that are not as significant as for the (110) and (100) grains. On the other hand, for strongly textured (110) and (100) β-Sn films, local high ESEDs are mostly induced in grains with orientations close to the film texture because of the strong grain–grain interactions between these β-Sn grains. Here, the simulated film microstructures have one dominant orientation with a smooth transition to all other possible orientations to fit the March–Dollase function.Reference Blendell, Vaudin and Fuller31,Reference Dollase32 However, a real film will exhibit a more complex orientation distribution with specific orientations missing,Reference Pedigo19 or with more than one dominant orientation.Reference Pedigo19,Reference Pei, Jadhav and Chason24 Thus, for films with complex orientation distributions, further investigation will be required to determine the effect of local grain orientations, as well as the grain–grain interactions, on ESED distributions.
B. Overall low ESEDs for whisker-resistant textures
It is well known that accumulated film stresses lead to stress relaxation via whisker formationReference Tu and Li2,Reference Lee and Lee5 ; therefore, textured β-Sn films with the overall lowest ESED for a given stress condition are expected to have a relatively low propensity to form whiskers. For elastic stresses induced by a given in-plane biaxial strain, the overall ESED of a textured β-Sn film [Fig. 5(a)] is mainly determined by the effective in-plane biaxial modulus as indicated in Eq. (4). Our results indicate that strongly textured (100) β-Sn films have the lowest in-plane modulus, which agrees with the reported in-plane moduli for β-Sn films with a range of textures.Reference Pedigo19 In addition, the majority of the grains in (100) textured β-Sn films show lower ESEDs compared with the grains in (001), (110), and (111) textured films [Fig. 4(a)], suggesting a low propensity to form whiskers. A significant broadening of the ESED distribution for strongly textured (100) β-Sn films can be due to the grain–grain interactions for (100) grains based on their local grain orientation.
For thermoelastic stress conditions, the misfit strain induced in textured β-Sn films is determined by the CTE mismatch between films and substrates, as well as applied temperature changes as indicated in Eq. (5), whereas the overall ESEDs induced in β-Sn films are determined by both their different in-plane elastic moduli and misfit strains as indicated in Eq. (6). Despite strongly textured (001) β-Sn films having a high in-plane elastic modulus, their relatively low misfit strains lead to low thermoelastic stresses and ESEDs, suggesting a relatively low propensity to form whiskers. For other strongly textured β-Sn films, the induced misfit strain will be higher than that for (001) textured films for a given temperature change (Table III). Strongly textured (110) and (100) β-Sn films have higher average misfit strains, as the c-axes (direction with the highest CTE) of (110) and (100) grains are oriented to be nearly parallel to the film plane. Because (110) textured β-Sn films have a higher in-plane elastic modulus than (100) textured films, thermoelastic stresses and overall ESEDs for (110) textured films are higher than those for (100) textured films [Fig. 5(b)].
C. Surface grain geometry and recrystallization
This study identified possible preferred sites for whisker formation in terms of local grain orientations, predicting the specific grains in which stress relaxation occurs. In addition to local high ESEDs, a surface grain geometry has to be considered for atoms to diffuse to the base of whiskers so they can keep growing when a local stress gradient exists.Reference Sarobol, Blendell and Handwerker21 The origin of surface grains is still not clear. They may be formed during plating, during subsequent aging, or by recrystallization. Pei et al.Reference Pei, Jadhav and Chason24 determined that preexisting grains formed whiskers at room temperature. Sarobol et al.Reference Sarobol, Koppes, Chen, Su, Blendell and Handwerker42 observed that recrystallization can be induced in thermally cycled Pb-free solder films to relieve local stresses. Subsequently, the recrystallized surface grains became preferred sites for whisker growth. Despite the (elastic) simulation only calculating ESEDs in films, the regions with local high ESEDs can have stresses above the yield strength, leading to plastic deformation with relatively high dislocation densities. Thus, recrystallization may be occurring in highly deformed regions to form new (surface) grains as whisker nuclei.
V. CONCLUSIONS
In this work, the specific grain orientations with local high calculated ESEDs in different textured β-Sn films were identified and used as a basis to predict preferred sites for whisker formation. Elastic and thermoelastic responses of textured β-Sn thin films to given stresses were investigated using 2D finite element analysis. Overall and local ESEDs were calculated for β-Sn films with a range of texture orientations and strengths (grain orientations for a given texture were generated using the March–Dollase function).
In general, local high ESEDs are preferentially induced in grains with their c-axes oriented to be nearly parallel to the film plane. For elastic stresses induced by IMC formation at room temperature, strongly textured (001) and (111) β-Sn films have high ESEDs primarily localized in the (100) oriented grains due to their low in-plane biaxial moduli. However, strongly textured (110) films have more (110) grains than (100) grains with high ESEDs, and strongly textured (100) films have high ESEDs primarily induced in the (100) grains. For thermoelastic stresses induced by the CTE mismatch during thermal cycling, strongly textured (001) and (111) films have high ESEDs for grains oriented mostly between the (110) and (100), away from the film textures. On the other hand, for strongly textured (110) and (100) films, the grains with orientations close to their film textures, (110) and (100), have high ESEDs. This is because both (110) and (100) grains have their c-axes nearly parallel to the film plane, generating local high thermoelastic stresses depending on their local grain orientations in the in-plane direction.
In addition, specific textures with overall low ESEDs were identified as textures with low propensities to form whiskers due to lower film stresses. For elastic stresses, strong (100) textures were found to have overall low ESEDs because of the low in-plane modulus; for thermoelastic stresses, strong (001) textures were found to have overall low ESEDs because of the low CTE mismatch with Cu substrates. These simulations agree with micro-diffraction measurements in previous work where (334) textured films have whiskers and hillocks with different crystallographic grain orientations from those of the surrounding grains, and with simulated local high ESEDs as the driving force for whisker formation.Reference Sarobol, Chen, Pedigo, Su, Blendell and Handwerker28
The simulation results in this work demonstrate that engineering a film texture can result in lower stresses induced in β-Sn films for different storage conditions. Furthermore, the predicted locations for whisker formation are found to be associated with local high ESEDs induced by local grain orientations, a condition that can be tested in future studies on whisker formation. However, it should be noted that while these local conditions (grain orientations, in-plane elasticity and CTE, high ESEDs, etc.) may be necessary, they may not be sufficient for a whisker to form at a preferred site as the surface grain geometry must also be considered.Reference Sarobol, Blendell and Handwerker21,Reference Sarobol, Wang, Chen, Pedigo, Koppes, Blendell and Handwerker22
ACKNOWLEDGMENTS
This work was supported by the Naval Surface Warfare Center NSWC-Crane, Foresite, Inc., Cisco Systems, and the NSF Graduate Research Fellowship Program. The authors would like to thank Anthony Rollett and Benjamin Anglin of Carnegie Mellon University for enlightening discussions, Terry Munson and Steve Ring of Foresite Technology and Denny Fritz of SAIC for connecting our work to industrial needs, the reviewers for valuable comments and suggestions, and Sarah Leach for assistance with microstructure construction. Sandia National Laboratories is a multi-program laboratory managed and operated by Sandia Corporation, a wholly owned subsidiary of Lockheed Martin Corporation, for the U.S. Department of Energy's National Nuclear Security Administration under contract DE-AC04-94AL85000.