





Introduction
Plastics have become indispensable in modern society due to their remarkable versatility and functionality. However, their widespread use has led to significant environmental challenges, particularly in marine ecosystems (Law Reference Law2017, Napper & Thompson Reference Napper and Thompson2023). Plastics are among the most pervasive pollutants due to their long lifespan in the environment, ready transport over long distances and widespread single-use applications. With plastic production projected to continue increasing, plastic pollution is expected to worsen (Stegmann et al. Reference Stegmann, Daioglou, Londo, van Vuuren and Junginger2022). Currently, ~50% of plastics end up in landfills or the environment (Houssini et al. Reference Houssini, Li and Tan2025). As a result, plastic litter has become ubiquitous, contaminating ecosystems worldwide (e.g. Chiba et al. Reference Chiba, Saito, Fletcher, Yogi, Kayo and Miyagi2018, Napper & Thompson Reference Napper and Thompson2023, De-la-Torre et al. Reference De-la-Torre, Santillán, Dioses-Salinas, Yenney, Toapanta and Okoffo2024b). Plastics dominate marine litter (Lebreton et al. Reference Lebreton, Slat, Ferrari, Sainte-Rose, Aitken and Marthouse2018), with recent estimates suggesting 1.1 and 4.9 million tonnes floating at sea (Eriksen et al. Reference Eriksen, Cowger, Erdle, Coffin, Villarrubia-Gómez and Moore2023). The amount of plastic at sea is increasing (Eriksen et al. Reference Eriksen, Cowger, Erdle, Coffin, Villarrubia-Gómez and Moore2023, Kaandorp et al. Reference Kaandorp, Lobelle, Kehl, Dijkstra and van Sebille2023), and both empirical and modelled data have demonstrated the existence of large garbage patches in most of the world’s oceans (Lebreton et al. Reference Lebreton, Slat, Ferrari, Sainte-Rose, Aitken and Marthouse2018, Connan et al. Reference Connan, Perold, Dilley, Barbraud, Cherel and Ryan2021, Kaandorp et al. Reference Kaandorp, Lobelle, Kehl, Dijkstra and van Sebille2023).
The Southern Ocean is less polluted than other oceans (Suaria et al. Reference Suaria, Perold, Lee, Lebouard, Aliani and Ryan2020, Kaandorp et al. Reference Kaandorp, Lobelle, Kehl, Dijkstra and van Sebille2023), partly due to the strong latitudinal frontal systems that separate it from the rest of the world’s oceans. However, these frontal systems do not constitute an absolute barrier (Fraser et al. Reference Fraser, Morrison, Hogg, Macaya, van Sebille and Ryan2018, Chapman et al. Reference Chapman, Lea, Meyer, Sallée and Hindell2020), and the Southern Ocean’s low pollution levels are also related to its distance from densely populated areas and limited maritime traffic (Suaria et al. Reference Suaria, Perold, Lee, Lebouard, Aliani and Ryan2020, Kaandorp et al. Reference Kaandorp, Lobelle, Kehl, Dijkstra and van Sebille2023). Nonetheless, an increasing number of studies highlight that, even in these remote areas, plastics are present in seawater (Suaria et al. Reference Suaria, Perold, Lee, Lebouard, Aliani and Ryan2020), in deep-sea sediments (Cunningham et al. Reference Cunningham, Ehlers, Dick, Sigwart, Linse, Dick and Kiriakoulakis2020, De-la-Torre et al. Reference De-la-Torre, Forero López, Colombo, Rimondino, Malanca, Barahona and Santillán2024a) and as beach litter on sub-Antarctic islands (Waluda et al. Reference Waluda, Staniland, Dunn, Thorpe, Grilly, Whitelaw and Hughes2020) and on the Antarctic coastline (e.g. Johnston et al. Reference Johnston, Manno and Salinas2024, Monràs-Riera et al. Reference Monràs-Riera, Lozoya, Teixeira De Mello and Avila2025, Lozoya et al. Reference Lozoya, González-Pleiter, Lacerot, De Feo, Krojmal and Edo2026). Plastic is also regularly ingested across all trophic levels of the Antarctic food web (e.g. Ryan Reference Ryan1987a, Eriksson & Burton Reference Eriksson and Burton2003, Johnston et al. Reference Johnston, Bergami, Rowlands and Manno2023, Cebuhar et al. Reference Cebuhar, Negrete, Rodríguez Pirani, Picone, Proietti and Romano2024), and numerous reports exist regarding entanglement of Antarctic wildlife in marine plastic litter (e.g. Hofmeyr & Bester Reference Hofmeyr and Bester2002, Ryan Reference Ryan2018).
Given the widespread presence of plastics in the Southern Ocean and their detrimental impact on marine wildlife, immediate and decisive measures are urgently needed to mitigate the sources and spread of pollution (da Silva et al. Reference da Silva, Bergami, Gomes and Corsi2023). Identifying the sources and pathways of plastic pollution in the Southern Ocean is critical to developing additional management strategies to complement existing regulations (Waluda et al. Reference Waluda, Staniland, Dunn, Thorpe, Grilly, Whitelaw and Hughes2020). In 1989, the Commission for the Conservation of Antarctic Marine Living Resources (CCAMLR) initiated a long-term marine debris programme, where signatory countries use standardized protocols to submit yearly data on beach litter surveys, animal entanglements and debris associated with seabird colonies (www.ccamlr.org). These data show that most identifiable litter items on beaches (e.g. nets, buoys, ropes) originate from fisheries (Eriksson et al. Reference Eriksson, Burton, Fitch, Schulz and van den Hoff2013, Waluda et al. Reference Waluda, Staniland, Dunn, Thorpe, Grilly, Whitelaw and Hughes2020). However, recent beach litter studies reveal that plastic bottles, particularly beverage bottles, are now among the most common items found stranded on Southern Ocean islands and the Antarctic continent (Johnston et al. Reference Johnston, Manno and Salinas2024, Vesman et al. Reference Vesman, Ershova, Litina and Chukmasov2024, Ryan et al. Reference Ryan, Makhado, Cebekhulu, Crawford, Dyer and Masotla2026).
Identification of stranded plastic bottles and lids (or caps) can help trace the sources and transport pathways of marine debris (e.g. Smith et al. Reference Smith, Banister, Fraser and Edgar2018, Falk-Andersson et al. Reference Falk-Andersson, Tairova, Drægni and Haarr2021, Ryan Reference Ryan2023). For example, plastic bottles collected on Inaccessible Island in the Tristan da Cunha Archipelago, South Atlantic Ocean, revealed that at-sea activities were the main sources of marine litter at that remote and uninhabited island (Ryan et al. Reference Ryan, Dilley, Ronconi and Connan2019). The plastic bottles also documented a shift in the origin of litter stranded at Inaccessible Island, from South American countries in the late 1980s to Asian countries in recent years (Ryan et al. Reference Ryan, Dilley, Ronconi and Connan2019, Reference Ryan, Moloney and Connan2024a). Interestingly, several studies have shown that stranded loose lids indicate different litter sources than the bottles themselves. Loose lids are more buoyant than bottles, which tend to fill up with water and sink (Ryan et al. Reference Ryan, Pichegru and Connan2024b). Lids may therefore arrive through long-distance drift, whereas most discarded beverage bottles strand close to source areas (Duhec et al. Reference Duhec, Jeanne, Maximenko and Hafner2015, Ryan Reference Ryan2023, Ryan et al. Reference Ryan, Pichegru and Connan2024b).
At the sub-Antarctic Prince Edward Islands, located in the western Indian Ocean sector of the Southern Ocean, plastic items were first observed on the shore (Ryan Reference Ryan1987b) and ingested by seabirds (Ryan Reference Ryan1987a) in the early 1980s. Long-term monitoring of marine litter stranded on the islands since 1993 shows that plastics have increased over time, with a notable rise in stranded plastic bottles over the last 2 decades (Ryan et al. Reference Ryan, Makhado, Cebekhulu, Crawford, Dyer and Masotla2026). In this study, we present decadal trends in the broad origins of plastic bottles collected on Marion Island. We then analyse data from an in-depth 4 year study (2019–2024) of plastic bottles and lids stranded on Marion Island, and of those collected on nearby Prince Edward Island in November 2023, to examine the finer-scale origins of plastic litter, as well as temporal and spatial trends in stranding patterns. By identifying the sources of plastic bottles and loose lids stranded at the Prince Edward Islands, our findings support efforts to reduce marine litter through the development of targeted waste management policies, with the ultimate goal of mitigating the impact of plastic pollution on the Southern Ocean ecosystem.
Materials and methods
Study sites
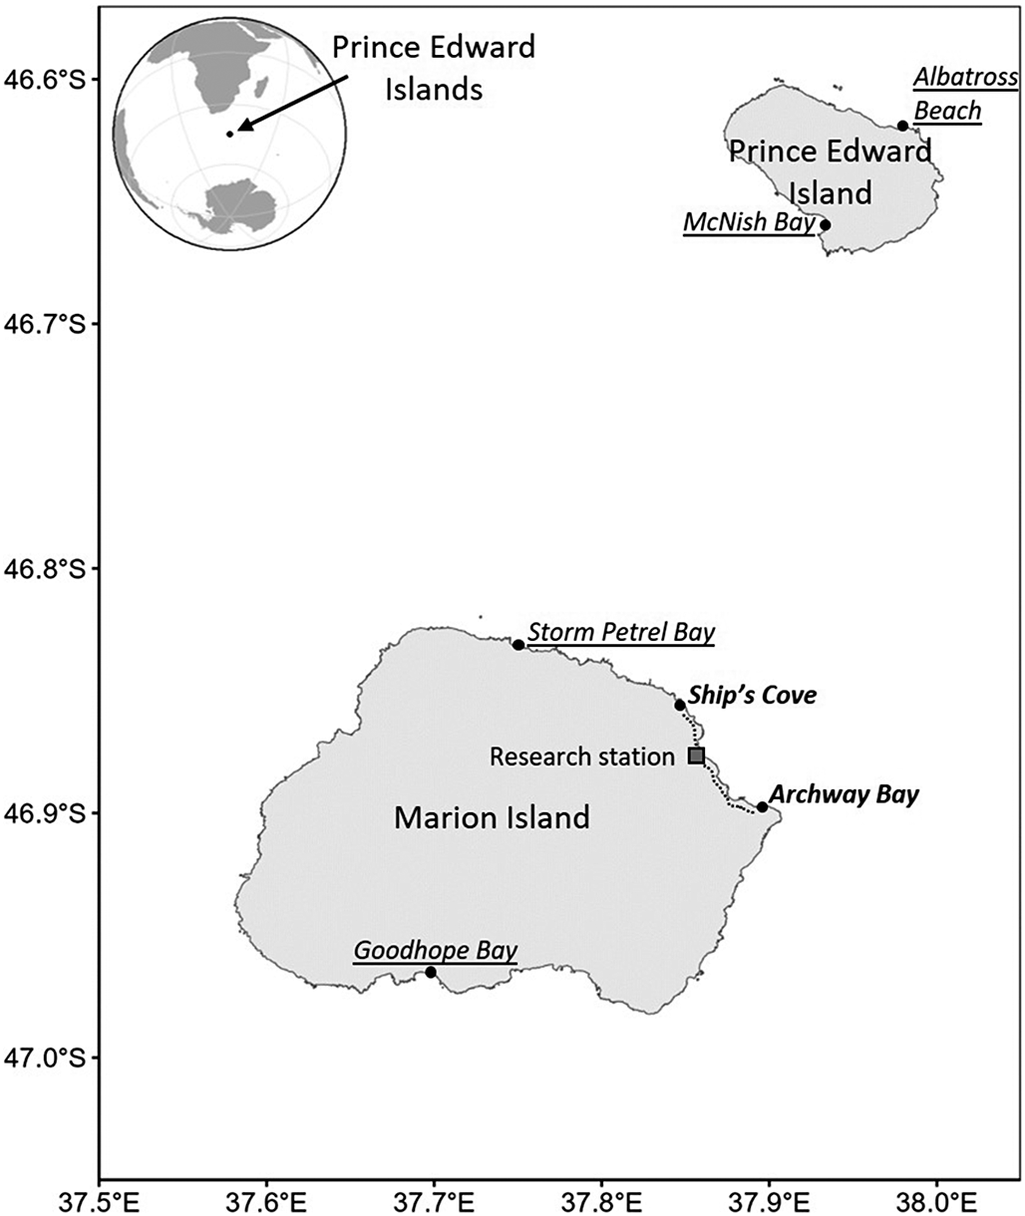
The sub-Antarctic Prince Edward Islands consist of Marion Island (46.90°S, 37.75°E; 290 km2) and Prince Edward Island (46.63°S, 37.94°E; 44 km2; Fig. 1). The islands are near the sub-Antarctic front (Park et al. Reference Park, Park, Kim, Lee, Hong and Lee2019) and lie at the centre of a 170 100 km2 marine protected area (MPA; Lombard et al. Reference Lombard, Reyers, Schonegevel, Cooper, Smith-Adao and Nel2007). Marion Island has a research station that is resupplied annually every April–May, and ~20 personnel remain on the island each year. Neighbouring Prince Edward Island, 20 km to the north-east, is seldom visited (the last two visits were in November 2023 and March 2011), with each visit only lasting a few days. The closest land is the French sub-Antarctic Crozet Archipelago, 950 km to the east, and the closest inhabited land is South Africa, 1750 km to the north-west.
Location of the Prince Edward Islands in the Indian Ocean sector of the Southern Ocean, and the coastline sections of Marion and Prince Edward islands, which were surveyed for plastic bottles. For Marion Island, the coastline between Ship’s Cove and Archway Bay (dotted line) was visited most frequently (minimum ~3 times/week between mid-August and mid-November). The coastline between Storm Petrel Bay eastward to Goodhope Bay was visited with medium frequency (minimum ~3 times/month), while the remainder of the coast had low-frequency visits (at least monthly). At Prince Edward Island, plastic bottles were collected from Albatross Beach southward to McNish Bay.

Figure 1. Long description
The maps of Marion and Prince Edward Islands also show the three survey frequencies used for different sections of the coastline.
Collection of bottles
Since May 1993, marine debris (including plastic bottles) has been routinely collected from Marion Island beaches, following CCAMLR guidelines (Ryan et al. Reference Ryan, Makhado, Cebekhulu, Crawford, Dyer and Masotla2026). From 1993 to 2018, few details were recorded from the plastic bottles. Broad functional groups (e.g. drink, detergent, cosmetic) and the country or region of manufacture were recorded when indicated on labels or other obvious markings.
A more detailed study of plastic bottles and lids followed from May 2019 to April 2020 and from April 2021 to May 2024 (surveys from May 2020 to April 2021 were disrupted by the COVID-19 pandemic). All plastic bottles including beverage, food-related, personal hygiene and cleaning product bottles and loose bottle lids found on Marion Island beaches were collected and scrutinized as in Ryan et al. (Reference Ryan, Dilley, Ronconi and Connan2019, Reference Ryan, Weideman, Perold, Hofmeyr and Connan2021, Reference Ryan, Pichegru and Connan2024b). The exact date and/or collection site are unknown for nearly 36% of bottles collected from May 2019 to April 2020, but this information was recorded for 99% of bottles and lids gathered from April 2021 to May 2024. To avoid double-counting, bottle fragments were not counted unless the neck was present.
Bottles and loose lids were collected when encountered while other coastal fieldwork was being conducted. All beaches on Marion Island were visited at least once a month. Search effort (site visit frequency) was higher at beaches on Marion Island’s north and east coasts and in spring. Beaches from Storm Petrel Bay eastwards to Goodhope Bay (Fig. 1) were visited at least three to four times a month (medium-frequency visits). Beaches from Ship’s Cove to Archway Bay were visited approximately three times a week from mid-August to mid-November (high-frequency visits) and three to four times a month for the rest of the year. Given the long-term marine debris collection record from Marion Island’s shores (Ryan et al. Reference Ryan, Makhado, Cebekhulu, Crawford, Dyer and Masotla2026), all bottles included in this study can be considered newly arrived.
Plastic bottles were also collected on 12 beaches along the south-eastern coast of Prince Edward Island (Fig. 1) from 14 to 19 November 2023. Loose lids were not collected at this island due to time constraints. On Prince Edward Island, marine litter was last scored in 1984 (Ryan Reference Ryan1987b), and no collection has ever been carried out; thus, the bottles collected here represent a long-term accumulation.
Scoring of plastic bottles and lids
From 2019, plastic bottles were categorized into functional groups: ‘bottled waters’, ‘soft drinks’ (e.g. carbonated soft drink, iced tea, juice), ‘other beverages’ (e.g. alcohol), ‘food-related’ (e.g. cooking oil, sauces), ‘cosmetics’ (e.g. shampoo, deodorants), ‘medicine’ (e.g. pill vials), ‘detergents’ (e.g. dish washing liquid, laundry detergent), ‘motor oils’ (e.g. motor oil, brake fluid) and ‘canisters’ (large containers ≥ 5 l; Ryan et al. Reference Ryan, Weideman, Perold, Hofmeyr and Connan2021). Additionally, bottled waters, soft drinks and other beverages were grouped in a ‘drinks’ category. Loose lids were also categorized into these functional groups but only using the ‘drinks’ category. Loose lids were not differentiated into bottled waters, soft drinks or other beverage categories because their often-degraded condition typically prevented more detailed identification. The plastic polymers (e.g. polyethylene terephthalate (PET), high-density polyethylene (HDPE), polypropylene (PP)) were also recorded, as well as the volume of the bottles. When present, labels were used to identify the product brand and country of manufacture. When labels were absent (96.7% of bottles), this information was inferred from the combination of marks, writing and logos visible on the bottles, bottle shape and colour and lids when present (Ryan et al. Reference Ryan, Dilley, Ronconi and Connan2019; https://www.sealordphotography.net/SustainabilityandEnvironment/Waste-management/Beach-litter-and-beach-cleans/Plastic-bottles-and-labels-from-beach-cleans). Experience in scoring bottles is crucial when identifying bottles (Ryan et al. Reference Ryan, Moloney and Connan2024a); our prior work in the Atlantic, Indian and Pacific oceans (Ryan et al. Reference Ryan, Dilley, Ronconi and Connan2019, Reference Ryan, Weideman, Perold, Hofmeyr and Connan2021, Reference Ryan, Moloney and Connan2024a, Reference Ryan, Pichegru and Connan2024b, Ryan Reference Ryan2023) allowed us to identify most bottles. In some instances, when the country of manufacture could not be ascertained, only a region (e.g. South America, Asia) or a language (Chinese, Spanish) was noted. Some global brands (e.g. The Coca-Cola Company, PepsiCo) without identifiable country- or region-specific markings were not assigned to a manufacturing location.
Bottle age (the time since manufacture) helps distinguish whether litter originates from land-based sources or at-sea discards (Ryan et al. Reference Ryan, Dilley, Ronconi and Connan2019). Most drinks have etched or printed dates on the bottle or lid: this can be the date of manufacture (e.g. most bottles manufactured in China), the expiry date or both. From 2019, we recorded the date of manufacture where possible; when only the expiry date was available, we back-calculated the date of manufacture using an average shelf life for similar products (using country- and functional group-specific values; Ryan et al. Reference Ryan, Moloney and Connan2024a). We assumed a shelf life of 1 year for bottled still waters (except if a particular brand was known to use a shelf life of 2 years), 3–6 months for carbonated waters and soft drinks and 3–5 years for cosmetics, medicines and motor oils. Bottle age was then calculated using the date of manufacture and the date of collection.
Data analyses
Because the long-term records on bottle origin were inconsistent, data were aggregated into 10 year intervals. Origins were classified into three regional categories: South America, Asia and other regions (Europe, Africa, North America, Central America). More detailed data analyses were restricted to data recorded on bottles collected since May 2019. The differing history of beach clean-ups between Marion Island and Prince Edward Island informs the residence time of plastic bottles on the coastline of these islands. A Pearson χ2 test was used to compare the compositions in plastic polymers (PET, HDPE; only five bottles were not PET or HDPE; test used with Yates’s correction for continuity) and functional groups (bottled waters < 1 l, bottled waters ≥ 1 l, soft drinks < 1 l, soft drinks ≥ 1 l, food-related bottles, others) between islands. The date of manufacture could be inferred for only seven HDPE bottles, so analyses of median ages were limited to drink bottles, with Mann-Whitney U tests being used to compare the median ages between islands due to the data being right-skewed. The same test was used to compare the median ages of bottled waters and soft drinks within islands.
The site and date of collection were recorded for nearly all bottles collected from April 2021 to May 2024 at Marion Island. These data allowed us to investigate spatial and temporal patterns of bottle collection. The data were summarized as the number of bottles collected per month per site. A factor ‘Year’ was then defined, representing 12 months of collection from April to the following March. April was chosen as the start of the factor ‘Year’ because the annual relief voyage to the Prince Edward Islands happens in April. To investigate intra-annual fluctuation in bottle numbers, a 4 month period (variable ‘Period’) was used to test for a seasonal impact while also accounting for a higher search effort between August and November: 1) April–July, 2) August–November and 3) December–March. The package MASS (Venables & Ripley Reference Venables and Ripley2002) was used to run generalized linear models with a negative binomial regression (given over-dispersed count data) using the factors ‘Year’, ‘Period’ and the interaction ‘Year:Period’. Significance of factors was determined using the package car (Fox & Weisberg Reference Fox and Weisberg2019), before pairwise comparisons on significant factors were run using the package emmeans (Lenth & Piaskowski Reference Lenth and Piaskowski2025). All analyses were conducted in R, version 4.0.2 (R Core Team 2025).
Results
Long-term trends in the origins of plastic bottles
Overall, 3701 plastic bottles have been collected from Marion Island shores from May 1993 to May 2024. The country or region of manufacture was inferred for 44.2% of them. A clear decadal trend was evident: bottles were predominantly manufactured in South America in 1993–2003 (74.3%), the composition became more balanced in 2004–2013 (South America: 39.4%; Asia: 52.5%) and there was a pronounced shift towards bottles manufactured in Asia in 2014–2023 (83.4%; Fig. 2).
Broad origins of plastic bottles collected over 3 decades from Marion Island shores, indicating their area of manufacture (1993–2003: n = 222; 2004–2013: n = 99; 2014–2023: n = 1313).

Figure 2. Long description
Three pie charts illustrate changes in the composition of plastic bottles over time. The first pie chart (1993–2003) shows that most bottles originated from South America. In the second pie chart (2004–2013), the proportion of bottles manufactured in Asia increased to account for just over half of all bottles. By the final period (2014–2023), bottles manufactured in Asia represented more than 80% of the total, indicating a marked shift in the origin of stranded plastic bottles over the three decades.
Composition of plastic bottles
Between May 2019 and May 2024, 1466 bottles were collected at the Prince Edward Islands: 1247 on Marion Island and 219 on Prince Edward Island. Almost all (96.7%) were PET bottles, with HDPE bottles (2.9%) comprising most of the remainder. Bottled waters represented 70.5% of all bottles collected, followed by soft drink bottles (20.7%) and food-related bottles (2.9%; Fig. 3 & Table S1). In terms of bottled waters and soft drinks, more than two-thirds of the bottles were < 1 l (Fig. 3).
Composition of plastic bottles collected at sub-Antarctic Marion Island from 2019 to 2024 (n = 1237) and Prince Edward Island in November 2023 (n = 219). The ‘Others’ category includes canisters, cosmetics, detergents, medicines, motor oils and other beverages.

Figure 3. Long description
The histogram shows the composition of plastic bottles found stranded at the Prince Edward Islands. Bottled waters less than 1L were the most common, followed by bottled waters of more than 1L and soft drinks less than 1L.
No differences in the composition of bottles (PET, HDPE) were observed between islands in terms of plastic polymers (Pearson’s χ2 test: χ2 = 0.816, df = 1, P = 0.366), but a significant difference was observed for functional groups (χ2 test: χ2 = 11.438, df = 5, P = 0.043), with more bottled waters > 1 l and fewer soft drinks ≤ 1 l than expected at Marion Island and the opposite at Prince Edward Island. Most bottles had a lid on (94.4% of PET bottles and 76.7% of HDPE bottles), and nearly half of the bottles without lids were very battered.
Areas or countries of manufacture and brands of plastic bottles
From 2019, a country or region of manufacture could be attributed to 87.3% of all plastic bottles and 91.3% of drink bottles collected at the Prince Edward Islands. Bottles manufactured in 24 countries were collected (Fig. 4). Most bottles were manufactured in Asia (81.0% when a country or region of manufacture could be ascertained), particularly in China (at least 83.6% of Asian bottles). South America was the second largest source of bottles, with 15.5% of collected bottles manufactured on the continent. Argentina (6.0% of bottles) was the second most frequently identified country of manufacture (Fig. 4). Although the Prince Edward Islands are South African territory, and South Africa is the nearest populated land area, only 2.3% of collected bottles were manufactured in South Africa.
Countries of manufacture for plastic bottles collected at the sub-Antarctic Prince Edward Islands between May 2019 and May 2024 (n = 1066). The shading on the map represents the relative contribution of plastic bottles to the dataset (darker red areas indicate higher contributions). The five biggest contributor countries (in decreasing order: China, Argentina, South Africa, Taiwan and South Korea) are named on the map.

Figure 4. Long description
The shading on the map represents the relative contribution of plastic bottles to the dataset (darker red areas indicate higher contributions). The five biggest contributor countries (in decreasing order: China, Argentina, South Africa, Taiwan and South Korea) are named on the map.
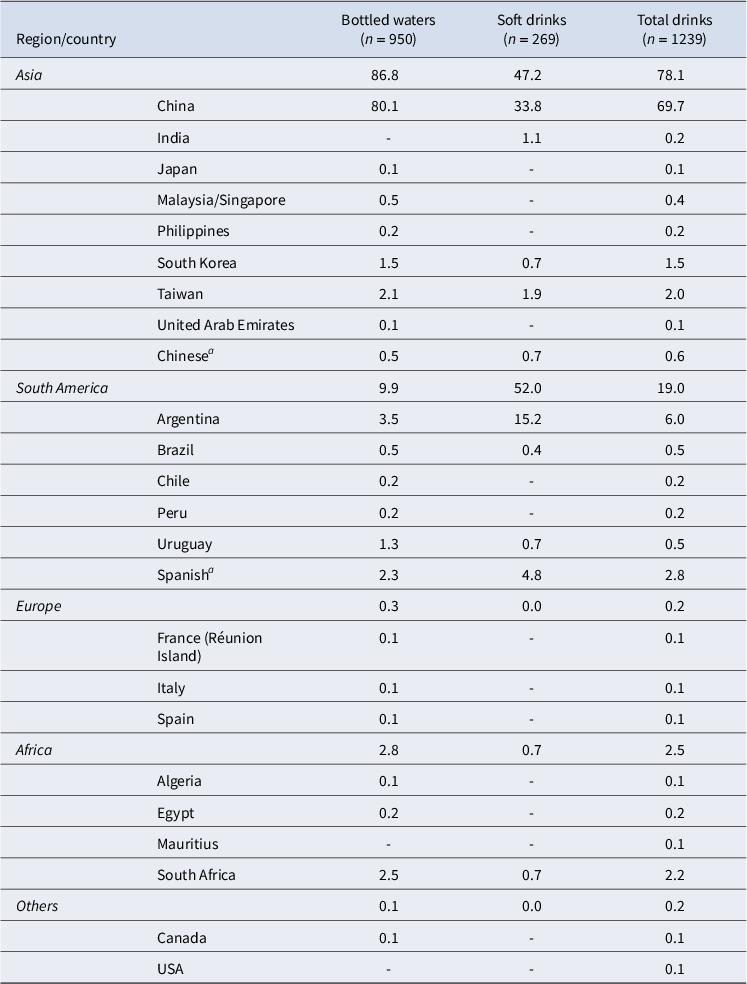
When only considering bottled waters and soft drink bottles (Table I), bottled waters were mostly manufactured in Asia (86.8% of bottles with a known origin), while the origin of soft drink bottles was more balanced, with 47.2% being manufactured in Asia (with 33.8% in China) and 52.0% in South America (with 15.2% in Argentina). An increasing trend in the proportion of bottled waters manufactured in China was clearly observed over the study period, from 65.0% of all bottled waters in 2019–2020 to 87.8% in 2023–2024 (Fig. S2). Regarding soft drink bottles, the proportion of bottles manufactured in China increased between the first 2 years of the study but stabilized for the last 2 years (Fig. S2). For bottles other than PET, the country of manufacture could be assigned to only 9 (out of 49) bottles, with a wide diversity of origins (Argentina, Mauritius, Morocco, South Africa, Taiwan, Uruguay, USA, Vietnam).
Regions and countries of manufacture (%) of bottled waters, soft drinks and total drinks collected at the Prince Edward Islands.

Table I. Long description
The table shows that more than 85% of bottled waters were manufactured in Asia, with 80% originating from China. In contrast, 52% of soft drink bottles were manufactured in South America. Plastic bottles manfactured in at least 22 countries were found stranded at the Prince Edward Islands.
a Language present on the bottles but could not be identified to a particular country in Asia (Chinese) or South America/Spain (Spanish).
From May 2019, the five manufacturers with the most bottles identified were Master Kong/Tingyi (33.8% of all bottles collected), The Coca-Cola Company (12.7%), Nongfu Spring (7.2%), Hangzhou Wahaha (2.7%) and
 /Bīngquán (2.1%; Table S3). Among the top 10 manufacturers, six were from China, two were global companies (The Coca-Cola Company and PepsiCo) and there was one each from Taiwan and South Korea (Table S3). Marks or writing on the bottles from The Coca-Cola Company and PepsiCo indicated that at least 58.7% and 87.5% of their bottles, respectively, were manufactured in Asia.
Ages of bottles
Manufacture dates were inferred for 889 bottles (881 PET and 7 HDPE bottles) collected from May 2019: 58.9% of all bottles from Marion Island (63.0% when considering only bottled waters and soft drinks) and 70.8% for Prince Edward Island (74.1% of bottled waters and soft drinks). The ages of PET bottles ranged from 1 month to approximately 20 years, with both extremes being bottled waters collected at Marion Island. However, bottles were significantly younger on Marion Island than on Prince Edward Island for both bottled waters (median age 1.61 vs 2.14 years; Mann-Whitney U test; U = 23911, P < 0.001) and soft drinks (1.76 vs 2.25 years; U = 1369.5, P = 0.027; Fig. 5). Within islands, there were no differences between the ages of bottled waters and soft drinks (Marion Island: U = 38329, P = 0.055; Prince Edward Island: U = 2142.5, P = 0.316). The age of HDPE bottles ranged from 5 months (a dairy drink manufactured in Mauritius) to ~7 years for a cosmetic bottle of unknown origin.
Ages of bottled water and soft drink bottles collected at sub-Antarctic Marion Island from 2019 to 2024 (n = 714) and Prince Edward Island in November 2023 (n = 151).

Figure 5. Long description
The histogram shows that most water and soft drink bottles stranded on Marion Island were less than two years old, whereas those found on Prince Edward Island were generally slightly older.
Loose lids
Overall, 89 loose lids were collected on Marion Island beaches: 80% from drink bottles, 7% from detergents and 3% from food-related bottles (Table S4A). A country or area of manufacture was determined for 29 lids (32.6%), with Indonesia the most common country of manufacture (41%; Table S4B). In total, 29% of loose lids were traced back to a manufacturer, with the Indonesian water brand Aqua Danone being the most frequently identified (31% of lids of known origin; Table S4C). Only three companies were identified in both bottles and loose lids: Master Kong/Tingyi (China), Nongfu Spring (China) and The Coca-Cola Company (Tables S3 & S4C).
Spatial and temporal patterns of plastic bottles collected at Marion Island
Bottles were collected at 38 sites around the coastline of Marion Island between April 2021 and May 2024 (Fig. S5). Almost 20.4% of the bottles were found at King Penguin Bay on the north-east coast, and bottles collected on the west and south coasts each accounted for ~9% of all bottles, respectively (Table S6).
Bottles were collected every month from a minimum of 2 bottles (January 2022) to a maximum of 71 bottles (October 2023; median = 16.5 bottles per month), with numbers tending to be higher from August to November (Fig. 6).
Heat map of the number of plastic bottles collected at sub-Antarctic Marion Island from April 2021 to May 2024 (n = 930).

Figure 6. Long description
The heatmap shows a seasonal pattern in the number of bottles found stranded on Marion Island coastline, with most bottles found in late winter and Spring.
The two factors ‘Year’ and ‘Period’, as well as their interaction, were significant in the model (all P < 0.001; Supp. Mat. S7A), which indicates a seasonal cycle of collection and yearly differences, with fewer bottles collected in 2021–2022 than in the following 2 years (2022–2023 and 2023–2024: both P < 0.001; Supp. Mat. S7B). The latter 2 years did not differ significantly (P = 0.084). Significantly more bottles were collected between August and November than during the rest of the year (both P < 0.001), and no significant differences were observed between the other two periods (April–July and December–March; P = 0.141). The interaction term was significant, with the most striking outcomes being that all periods differed significantly from each other in the third year, while December–March did not differ from April–July in the previous 2 years (Supp. Mat. S7B).
Discussion
Identifying the sources of marine litter is essential for understanding the pathways of pollution and enabling the development of targeted and effective waste management strategies to mitigate its impact on marine ecosystems. Plastic bottles and loose lids are now commonly found as debris on shorelines worldwide (e.g. Smith et al. Reference Smith, Banister, Fraser and Edgar2018, Falk-Andersson et al. Reference Falk-Andersson, Tairova, Drægni and Haarr2021, Benito-Kaesbach et al. Reference Benito-Kaesbach, Suárez-Moncada, Velastegui, Moreno-Mendoza, Vera-Zambrano and Avendaño2024, Ryan et al. Reference Ryan, Pichegru and Connan2024b), and these items are particularly useful for identifying the sources of general litter, which could come from either land-based or at-sea sources. Over the last 2 decades, plastic bottles have become the most common litter item on Marion Island in the southern Indian Ocean (Ryan et al. Reference Ryan, Makhado, Cebekhulu, Crawford, Dyer and Masotla2026). Our study shows that some marine litter at these remote islands originates from long-distance transport, but most comes from illegal discarding by vessels operating in the region.
Origins of plastic bottles and lids collected on the Prince Edward Islands
The vast majority of bottles washed ashore at the Prince Edward Islands were PET beverage bottles. PET sinks in seawater (Andrady Reference Andrady2011), so PET bottles cannot travel long distances before sinking unless they contain trapped air (i.e. sealed with lids). Nearly all bottles collected had lids, and it is probable that those that did not (6.2%) lost their lids after stranding (suggested by the very battered state of most lidless bottles). Similarly, all newly arrived PET bottles (and most standing stock) were sealed with lids on Inaccessible (Ryan et al. Reference Ryan, Moloney and Connan2024a), Pitcairn (Ryan Reference Ryan2023) and the Galapagos (Benito-Kaesbach et al. Reference Benito-Kaesbach, Suárez-Moncada, Velastegui, Moreno-Mendoza, Vera-Zambrano and Avendaño2024) islands. Unlike PET, the plastic polymer HDPE is positively buoyant; HDPE pieces can thus travel longer distances at the sea surface (Andrady Reference Andrady2011, Ryan et al. Reference Ryan, Pichegru and Connan2024b). Even so, HDPE bottles only comprised a small portion (< 3%) of stranded bottles in this study.
A clear shift in the region of manufacture was detected in bottles collected over 30 years, with South America being replaced by Asia as the main region of manufacture (Fig. 2). This shift was also seen at Inaccessible Island in the central South Atlantic Ocean (Ryan et al. Reference Ryan, Moloney and Connan2024a). From May 2019, the origin of manufacture could be determined for nearly 90% of the bottles collected on the Prince Edward Islands’ shores. Experienced observers, and the good state of most bottles, contributed to this high identification percentage. Overall, 81% of bottles were manufactured in Asia, and this reached 87% for bottled water. When brands could be identified, Chinese brands dominated, particularly the two main manufacturers of bottled water in China: Master Kong/Tingyi and Nongfu Spring (Table S3). Even for the two multinational companies - The Coca-Cola Company and PepsiCo - most of the bottles were manufactured in Asia. The main manufacturers identified at the Prince Edward Islands are the same as the ones responsible for the most bottles found in the South Atlantic (Ryan et al. Reference Ryan, Moloney and Connan2024a), the Indian Ocean (Ryan et al. Reference Ryan, Weideman, Perold, Hofmeyr and Connan2021) and the South Pacific Ocean (Smith et al. Reference Smith, Banister, Fraser and Edgar2018, Ryan Reference Ryan2023).
Regarding the size of bottled waters, there was a trend towards more small bottles (< 1 l). In 2019–2020, larger bottles (≥ 1 l) were slightly more common (54%) than small bottles (46%), but this changed in 2021–2022 (34% vs 66%, respectively), and by 2023–2024, 85% of bottled waters were small (Fig. 3). This trend was also observed with soft drink bottles, but to a lesser extent. A similar pattern was observed on Inaccessible Island in the South Atlantic Ocean (Ryan et al. Reference Ryan, Moloney and Connan2024a). On that island, small bottles already dominated newly arrived bottles in 2018. However, the COVID-19 pandemic may have promoted a shift in consumers’ habits, with smaller, single-serving bottles being favoured and then discarded. This change in consumer habits presumably contributes to the increased number of bottles stranding.
Relatively few loose lids were collected at Marion Island. Most of the island’s beaches are boulder-strewn, where lids can easily be concealed in cracks between rocks. Nearly half of the recovered lids with identifying features were from Indonesian brands (Table S4). Lids typically are made of HDPE or PP and are inherently buoyant (Andrady Reference Andrady2011); loose lids therefore probably represent pollution through long-distance drift (Ryan et al. Reference Ryan, Pichegru and Connan2024b). Differences in the main country of manufacture between plastic bottles and loose lids (i.e. China vs Indonesia) have also been observed in the Seychelles (Duhec et al. Reference Duhec, Jeanne, Maximenko and Hafner2015) and on the South African coast (Ryan et al. Reference Ryan, Pichegru and Connan2024b). Lids from Indonesia also dominate the plastic items that foraging seabirds bring back to their chicks at Marion Island (Perold et al. Reference Perold, Schoombie and Ryan2020).
Probable sources of plastic bottles collected on the sub-Antarctic Prince Edward Islands
Marine litter, and thus plastic bottles, on islands can originate from human activities on land and from intentional or accidental discards from vessels at sea. Some marine litter stranded on Marion Island in the past (Ryan Reference Ryan1987b) and at some Antarctic sites (e.g. Finger et al. Reference Finger, Corá, Convey, Santa Cruz, Petry and Krüger2021, Stark et al. Reference Stark, Johnstone, King, Raymond, Rutter, Stark and Townsend2023, Monràs-Riera et al. Reference Monràs-Riera, Lozoya, Teixeira De Mello and Avila2025, Lozoya et al. Reference Lozoya, González-Pleiter, Lacerot, De Feo, Krojmal and Edo2026) was derived from local activities on land, but this source is now very limited at the Prince Edward Islands (Ryan et al. Reference Ryan, Makhado, Cebekhulu, Crawford, Dyer and Masotla2026). The resupplying vessel is the only vessel authorized to land at the islands, and it generally does so only once a year. Strict waste management rules are enforced at the research station on Marion Island, which houses a team of ~20 personnel from mid-May to March, increasing to ~100 people from April to mid-May (De Villiers et al. Reference De Villiers, Chown and Cooper2011). All waste is sorted on the island and returned to South Africa for responsible disposal. In addition, bottled water and soft drinks (< 1 l) are not available at the island or on the resupplying vessel.
Plastic litter at the Prince Edward Islands could still originate from land-based activities through long-distance drift from other continents. The islands lie in the path of the eastward-flowing Antarctic Circumpolar Current (Ansorge & Lutjeharms Reference Ansorge and Lutjeharms2002), so marine litter would be expected to originate mostly from the west. However, new evidence shows that the series of oceanic frontal systems is not an impassable barrier (Fraser et al. Reference Fraser, Morrison, Hogg, Macaya, van Sebille and Ryan2018). For example, although the release of plastic drift cards in the late 1970s (Shannon et al. Reference Shannon, Stander and Campbell1973) showed that northward movements happen, a recent model shows that southward movements are also possible (Dawson et al. Reference Dawson, England, Morrison, Tamsitt and Fraser2024). Another circulation model of marine litter showed that wind is also paramount to the movement of litter across the oceanographic frontal system that was thought to isolate the Southern Ocean from the waters further north (Ko et al. Reference Ko, Hsin and Jeng2020). Garbage patches have been identified in the Indian Ocean (Eriksen et al. Reference Eriksen, Lebreton, Carson, Thiel, Moore and Borerro2014, Connan et al. Reference Connan, Perold, Dilley, Barbraud, Cherel and Ryan2021, Thibault et al. Reference Thibault, Fajeau, Ramanampananjy, Royer, Fustemberg and Marillac2025, Chauchadis et al. Reference Chauchadis, Maes, Blanke and Carton2026); some of the litter stranding on the Prince Edward Islands’ shores might originate from long-distance transport, particularly the buoyant loose lids and HDPE bottles. However, due to their countries of manufacture and ages, it is implausible that many (if any) PET bottles disperse from land-based releases; they most probably originate from maritime activities (i.e. shipping, leisure and/or fishing vessels). The maritime origin of beach litter has also been highlighted on the Scotia Arc (Convey et al. Reference Convey, Barnes and Morton2002, Waluda et al. Reference Waluda, Staniland, Dunn, Thorpe, Grilly, Whitelaw and Hughes2020) and Antarctic Peninsula (e.g. Vesman et al. Reference Vesman, Ershova, Litina and Chukmasov2024, Monràs-Riera et al. Reference Monràs-Riera, Lozoya, Teixeira De Mello and Avila2025).
The Prince Edward Islands lie away from major shipping routes, which are all located well north of the islands; only a few cargo vessels travel down to 45°S in this region (www.globalfishingwatch.org). Similarly, tourist activities are concentrated along the Antarctic Peninsula and the south-west sector of the Southern Ocean (McCarthy et al. Reference McCarthy, Peck and Aldridge2022); no tourism is permitted at the Prince Edward Islands. Considering that the youngest PET bottles were 1 month old and that over 60% of PET bottles were < 2 years old, the bulk of PET bottles are unlikely to originate from faraway lands and shipping routes. Most plastic bottles found at the Prince Edward Islands probably originate from fishery activities. Providing safe drinking water to seafarers is part of the Maritime Labour Convention (World Health Organization 2011), and supplying bottled waters for drinking and/or cooking on fishing vessels is one of the options (Chen & Liu Reference Chen and Liu2013). Limited data exist on the disposal of used bottled waters by fishing vessels, but a questionnaire in the coastal Taiwanese fleet in the early 2010s found that 37.5% were discarded at sea (Chen & Liu Reference Chen and Liu2013).
The Prince Edward Islands lie within a MPA with limited fishery rights (Department of Environmental Affairs 2013). Over the 4 years of bottle collection at Marion Island, the only fishing vessels recorded visiting the MPA were from South Africa and Uruguay (www.globalfishingwatch.org). Due to the particular shape of the MPA (Lombard et al. Reference Lombard, Reyers, Schonegevel, Cooper, Smith-Adao and Nel2007), this may not represent all fishing activities conducted around the islands. When considering a rectangularly shaped area using the MPA limits as its borders, vessels from 22 countries were detected, with South Africa, Uruguay and China being the countries with the most hours spent in the 547 000 km2 area (www.globalfishingwatch.org). South Africa and Uruguay contributed very little to these plastic bottles, but China was the leading country of manufacture of PET beverage bottles stranded ashore at the Prince Edward Islands (Table I). In addition to these detected vessels, illegal fisheries exist in the area (Weimerskirch et al. Reference Weimerskirch, Collet, Corbeau, Pajot, Hoarau and Marteau2020) that may also contribute plastic bottles. Plastic bottles manufactured in China may also be supplied to vessels other than those from China.
The regular collection of bottles on Marion Island revealed a clear seasonal pattern, with more collected in spring, between August and November (Fig. 6), continuing the pattern detected over the last 30 years (Ryan et al. Reference Ryan, Makhado, Cebekhulu, Crawford, Dyer and Masotla2026). A temporal pattern in the stranding of marine litter was also observed on South Georgia and the South Orkney Islands in the south-west Atlantic Ocean sector of the Southern Ocean, but it varied among the years (Waluda et al. Reference Waluda, Staniland, Dunn, Thorpe, Grilly, Whitelaw and Hughes2020). Various factors may explain the seasonality in litter collections: seasonal differences in search effort, environmental conditions and/or at-sea activities surrounding the islands. Seasonality in bottle arrival rates was still detected after removing high-frequency visit sites (Supp. Mat. S8), so changes in search effort are unlikely to have greatly influenced the observed seasonality. Regarding possible seasonal changes in environmental conditions, Eriksson et al. (Reference Eriksson, Burton, Fitch, Schulz and van den Hoff2013) found that litter arrival depended on the tide and onshore winds at Macquarie Island. At Marion Island, winds are stronger in winter (Momberg et al. Reference Momberg, Ryan, Hedding, Schoombie, Goddard, Craig and Le Roux2023); an onshore wind effect might thus partly explain the seasonality of the bottles collected (Ryan et al. Reference Ryan, Makhado, Cebekhulu, Crawford, Dyer and Masotla2026). The third hypothesis - that seasonality in bottle numbers reflects seasonality in at-sea activities - is thus the most probable. Indeed, vessel presence data suggest a high seasonality in the vessels visiting the area (peaking between October and January, lowest between June and August; www.globalfishingwatch.org; Fig. S9). Seasonality in at-sea activity may thus explain the seasonal pattern in the bottles stranding on Marion Island, supporting the conclusion that vessels are illegally discarding plastic bottles at sea.
Finally, most bottles were collected on the east side of the island, particularly on the north-east side. This spatial pattern can be explained by three non-exclusive reasons: 1) there are three times fewer beaches on the west side of the island than the east side, 2) search effort was lower on the west coast (monthly visits vs at least three visits per month on the east side), and 3) the west coast is battered by stronger seas and winds that may displace stranded plastic bottles more than on the east coast, which is more sheltered due to it facing the inter-island channel (Fig. S5).
Residence time and fate of plastic bottles
Marine litter has regularly been removed from the Marion Island shores and scored following the CCAMLR marine debris protocol since 1993 (Ryan et al. Reference Ryan, Makhado, Cebekhulu, Crawford, Dyer and Masotla2026). By comparison, the Prince Edward Island shores have never been cleaned. Nevertheless, few differences were observed between the standing stock of bottles at Prince Edward Island and the newly arrived bottles at Marion Island. The composition was similar, and the bottles on Prince Edward Island averaged only slightly older than those from Marion Island (Fig. 5). The absence of strong differences in the compositions and ages of bottles between the two islands suggests a rapid turnover of bottles, which is unsurprising along such a dynamic coastline. Bottles stranded on the coast that are not collected have two fates under the crashing waves from the Roaring Forties: they may get broken down into smaller pieces between the boulders that dominate the beaches, or they may be blown back out to sea, where PET bottles eventually sink to the seabed (see earlier). In temperate and tropical areas, the backshore vegetation and dunes can be important sinks for marine plastic litter (Ryan Reference Ryan2020). However, these habitats do not exist (dunes) or are relatively sparse (backshore vegetation) on the sub-Antarctic islands in the Indian Southern Ocean, and thus they are unlikely to conceal litter.
Illegal dumping of litter at sea: what can be done?
Our study shows that most bottles in the Indian Ocean sector of the Southern Ocean are probably dumped at sea, with relatively little litter originating from distant land-based sources. These results reinforce findings from previous research on marine litter on sub-Antarctic islands and Antarctic shores (e.g. Waluda et al. Reference Waluda, Staniland, Dunn, Thorpe, Grilly, Whitelaw and Hughes2020, Vesman et al. Reference Vesman, Ershova, Litina and Chukmasov2024, Monràs-Riera et al. Reference Monràs-Riera, Lozoya, Teixeira De Mello and Avila2025). Several global regulations prohibit the discarding of litter at sea (e.g. Annex V of the MARPOL Convention), and this regulation was enhanced within the Antarctic Treaty (Waluda et al. Reference Waluda, Staniland, Dunn, Thorpe, Grilly, Whitelaw and Hughes2020; Annex IV to the protocol on environmental protection to the Antarctic Treaty). Guidelines for waste management have also been produced within the framework of the Antarctic Treaty (www.ats.aq), although the Prince Edward Islands lie north of 60°S, the northern boundary at which the Treaty applies. However, ample evidence shows that this regulation is not being adhered to (e.g. this study, Chen & Liu Reference Chen and Liu2013, Vesman et al. Reference Vesman, Ershova, Litina and Chukmasov2024, Monràs-Riera et al. Reference Monràs-Riera, Lozoya, Teixeira De Mello and Avila2025). Beach clean-ups are logistically challenging on remote beaches on often-uninhabited sub-Antarctic islands and Antarctic coastlines; the best solution is to curb this pollution at its source.
If improving waste reception facilities at ports and continuing the environmental education of seafarers is important (Osmundsen Reference Osmundsen2023, Ryan Reference Ryan2023), three additional non-exclusive avenues could be followed to restrict the dumping of plastic bottles. The first obvious measure would be to phase out single-use or short-term-use plastics (Cowger et al. Reference Cowger, Willis, Bullock, Conlon, Emmanuel and Erdle2024) by encouraging safe drinking water production on board vessels. One possible strategy would be to install desalination systems on vessels, thereby reducing dependence on bottled water and ultimately limiting plastic leakage into the ocean. Although this may be challenging in the short term due to the affordability and usefulness of plastic bottles, a global extension of the extended producer responsibility system could be considered (Zhou & Luo Reference Zhou and Luo2024). In the context of an extended producer responsibility system, the same manufacturers of bottled waters and soft drinks are identified across sites in the Southern Ocean (this study, Gallagher et al. Reference Gallagher, Selig and Cimino2024, Johnston et al. Reference Johnston, Manno and Salinas2024, Vesman et al. Reference Vesman, Ershova, Litina and Chukmasov2024) and further afield (e.g. Duhec et al. Reference Duhec, Jeanne, Maximenko and Hafner2015, Ryan et al. Reference Ryan, Weideman, Perold, Hofmeyr and Connan2021, Reference Ryan, Moloney and Connan2024a, Ryan Reference Ryan2023, Garcés-Ordóñez et al. Reference Garcés-Ordóñez, Ergas, Baeza-Álvarez, Honorato-Zimmer, López-Xalín and Vásquez2025), suggesting that producer-focused interventions could have widespread benefits. In addition, traceability could be improved; for example, ship chandlers could be obliged to stamp the names of vessels or vessel companies onto bottles (Ryan Reference Ryan2023).
Conclusion
Recent marine litter studies in the Southern Ocean have focused predominantly on the Antarctic Peninsula and nearby islands in the south-western Atlantic Ocean sector, leaving much of the Southern Ocean overlooked. Using plastic bottles as marine litter tracers, our study helps to fill this gap by providing the first comprehensive assessment of the geographical origins of marine litter in the sub-Antarctic Indian Ocean. A marked increase in the abundance of stranded plastic drink bottles has been recorded on Marion Island over the last 15–20 years (Ryan et al. Reference Ryan, Makhado, Cebekhulu, Crawford, Dyer and Masotla2026). Our study indicates a steady shift in the counties of manufacture of these bottles from South America to Asia. Given the recent dates of manufacture, it is clear that most bottles from Asian countries are discarded at sea, in contravention of international maritime legislation. Similar findings at remote islands further north in the South Atlantic and South Pacific oceans indicate that this problem is widespread around the southern oceans, demonstrating an urgent need to improve waste management practices at sea. Further studies are needed to identify which fleets are responsible for this illegal dumping and to devise effective interventions to stop this practice.
Supplementary material
To view supplementary material for this article, please visit http://doi.org/10.1017/S095410202610087X.
Acknowledgements
We thank Dr Vonica Perold for her help with the 2019–2020 data. We are grateful to the numerous team members who helped collect the bottles on Marion Island since 1993, and particularly the ones from the overwintering years 2019–2020, 2021–2022, 2022–2023 and 2023–2024. This work utilizes data and analysis provided by Global Fishing Watch, a collaboration of Bloomberg Philanthropies, Oceana and Google. The authors would like to thank the editor and two reviewers for their valuable comments, which greatly improved the manuscript.
Financial support
Financial and logistical support was provided by the South African Department of Science, Technology and Innovation through the National Research Foundation (South African National Antarctic Programme - grants #110738 and #129226) and the South African Department of Forestry, Fisheries and the Environment.
Competing interests
The authors declare none.
Credit authorship contributions
Maëlle Connan: Conceptualization, Data curation, Formal analysis, Funding acquisition, Investigation, Methodology, Project administration, Resources, Visualization, Writing - original draft. Peter G. Ryan: Conceptualization, Formal analysis, Funding acquisition, Investigation, Methodology, Resources, Visualization, Writing - review and editing. Azwianewi Makhado: Project administration, Data curation, Funding acquisition, Investigation, Writing - review and editing. W. Chris Oosthuizen: Investigation, Formal analysis, Writing - review and editing. Michelle M. Risi, Christopher W. Jones, Lucy K. Smyth, Eleanor Weideman, Stefan Schoombie, Rowan K. Jordaan, Thando Cebekhulu, Danielle Conry, Banele Dosi, Tamara Eggeling, Laurie Johnson, Monica Leitner, Mpumelelo Mabutyana, Makhudu J. Masotla, Kyle Maurer, Andile Mdluli, Isabel Micklem, Zafar Monier, Samuel Peta, Jelena Reljic, Michael D. Ross, Dylan Seaton, Yinhla Shihlomule and J.S. Frederik van der Vyver: Investigation, Writing - review and editing.




 Open access

