1. Introduction
Several authors (e.g.Reference WeertmanWeertman, 1974) have noted that the position of an ice-stream grounding zone is particularly sensitive to the thickness of the ice stream and so to the state of mass balance of the ice-stream/ice-shelf system, or to changes in eustatic sea level.Where the bed beneath an ice stream slopes down towards the sea with a 2() dip, a fairly typical value for West Antarctic ice streams (Reference HentleyBentley, 1987), we could expect a groundingzone movement of around 250 m to follow a change in ice thickness of 10m. In many areas, glacier beds slope upward toward the grounding zone, and under these conditions the position of the grounding zone could be even more sensitive to mass-balance or sea-level changes. Despite the knowledge that a significant alteration in the state of the West Antarctic ice sheet might be first indicated by a change in ice-stream grounding-zone positions, there have been few attempts to locate the positions of current grounding zones with the accuracy that would be required for base-line measurements to which future studies can be compared. To detect a 1% change in the thickness of a 2000 m thick ice stream, we should devise methods capable of detecting some feature of the grounding; zone to horizontal precision of 250-500m.
2. The features of the grounding zone
Reference HentleyBoulton 1972 Reference StephensonStephenson (1984) and Reference SmithSmith (1991) discusscd a typical grounding-zone configuration with reference to Rutford lce Stream, Antarctica. Smith's schematic diagram (Fig. 1) shows that there arc several distinct featurcs within the grounding zone: the point at which the glacier loses contact with the bed (the grounding line); the point at which the glacier first reaches hydrostatic equilibrium; the limit of tidal flexing; and the zone of active strand cracking. Given that the ice in the grounding zone has some flexural strength, the grounding line must be landward of the hydrostatic point. Likewise, the grounding line must lie seaward of the flexing limit. It seems reasonable that strand cracks should not appear far above the flexing limit since they are themselves formed by flexing.
The method described here can be used to determine only the limit of flexure. There remains no proven method of precisely locating the point of contact with the bed (the grounding line), although this can be inferred with limited accuracy from the position of flexing limit and hydrostatic point. Seismic and radio-echo sounding may prove useful in locating grounding lines, but a simple argument invoking Fresnel diffraction shows the limit of the precision available without recourse to complex migration techniques. For Rutford Ice Stream, with a thickness of around 2000 m, seismics at around 200 Hz would have a footprint of around 260 m, and at 60 MHz around 100 m.
Schematic grounding zone showing, the limit of flexure (F), the grounding line (G), the drostatic point(H), the point of gradient change (I) and the region over which strand cracks may be expected. After Reference SmithSmith (1991) and expected for Rutford Ice Stream.

Summary of estimates of the precision locating grounding-zone features (F, G, Hand 1 defined in Figure I) by the various techniques described in section 3 for Rutford Ice Stream. * implies that the method is theoretically not capable of locating this feature of the grounding ZOne

3. Previous methods of locating grounding zones
3.1. Visible imagery
Visible satellite imagery has been widely used to locate grounding zones for mapping purposes. For example, Reference Swithinbank, Brunk and SieversSwithinbank and others (1988) showed that most of the grounding zones around Filchner Ronne Ice Shelf could be mapped from Landsat TM imagery, Unfortunately, the hardest sections to map were those across the ice streams, where the change in surface gradients between grounded and floating ice are very small. For the image of Recovery Glacier, for example, it would be hard to locate the grounding zone to less than 5 km.
3.2. Strand cracks
Strand cracks are fractures in the surface of a glacier that occur in the grounding zone and are caused by the tidal displacement of the ice shelf. Strand cracks have been used as an indication of the position of grounding zones (Reference StephensonStephenson, 1984: Reference Thomas, Stephcnson, Bindschadler, Shabtaie and BentleyThomas and others, 1988) but there arc limitations on their usefulness for precise location of grounding, Active strand cracks can be as narrow as 1 cm when fully open and even to an observer on foot they can be diflicult to find, During this study on Rutford Ice Stream, many previously obvious strand cracks were completely hidden to the eye for several days by a fall of snow. Furthermore, active strand cracks were seen to extend over a horizontal distance of2 km (equivalent to the ice thickness at this point) both upstream and downstream of the hydrostatic point, and their orientation was highly variable, It docs appear, however, that the most landward strand cracks lic close to the limit of flexure.
3.3. Tiltmeter
Tiltmeters capable of measuring angles to tens of microradians have been used on Rutford Ice Stream and Doake Ice Rumples by Reference StephensonStephenson (1984) and Reference SmithSmith (1991) to measure the periodic tilting due to ocean tides within the grounding zone, By modelling the amplitudes of the tilt signals obtained, Stephenson and Smith have estimated the limit flexure, Unfortunately, this method requires time-consuming data collection and gives positions for the limit of flexure that are sensitive to the strength parameters used in the models.
3.4. Satellite altimetry
Reference Partington, Cudlip, Meintyre and helePartington and others (1987) used Seasat altimetry to locate the change in surface slope that marks the grounding zone around the lateral margins of Amery Ice Shelf. They used two methods to determine the exact position which agreed to around 600 m. As with visible satellite imagery, this method is suitable only for grounding zones that show a strong change in surface slope.
3.5. Interferometric sar
Recent developments in interferometric analysis of satellite synthetic-aperture radar (SAR) imagery show that grounding zones can be located by comparison of phase in images collected at different states of the ocean tide (Reference Goldstein, Engelhardt, Kamb and FrolichGoldstein and others, 1993). The method promises to be widely applicable but may only yield the positional accuracy required for change studies when SAR targets (probably corner-cube rdlectors) are deployed within the study area.
4. Kinematic gps
4.1. Background
The simplest method for determining the trajectory of a moving vehicle by GPS uses a single GPS receiver to read the coded information on signals from the Navstar satellites. This information contains ephemeris data for the satellite transmitting it and clock signals to give the time of the transmission. Simultaneous tracking of four satellites enables the receiver to calculate so-called pseudo-ranges for each of the satellites, and then the four unknown coordinates: latitude, longitude, ellipsoidal height and time. The calculated position can be recorded directly. The precision available from this technique is strictly con trolled by the U.S. military and varies from approximatdy 30 to 100 m.
This precision in the trajectory determination can be improved by a number of methods, the most usual being a differential technique. Here, a second GPS receiver records the satellite transmissions simultaneously at a known base station, whilst the rover is travelling. The pseudo-range data from both receivers is processed together after the event. This post-processing allows correction for imprecise broadcast ephemeris, clock signals and atmospheric/ionospheric variations. In this way, the precision of the rover trajectory may be improved to a few metres.
“Kinematic GPS” (Reference Hoffmann-Wellenhof, Lichtenegger and CollinsHofmann-Wellenhof and others, 1992), more correctly "carrier-phase GPS" (Reference RemondiRemondi, 1985; Reference MinkelMinkel, 1989) is now well established and routinely applied in commercial and research applications but has not yet been widely used in glaciology, although Reference Whillans, Vander veen and TsengWhillams and others (1990) showed its potential. This method is distinct from either of the previous methods and allows the rover trajectory to be measured to centimetre precision. As in the differential method, two receivers are used, the base station and the rover. The receivers used must be specifically designed for carrier-phase measurement, since they are required to strip away the coded information on the GPS broadcasts and track the relative phase of the carrier signals from the visible satellites. The data recorded in the receivers consist of the relative phases of signals from each satellite. Changes in the relative phase occur as a result of changes in relative positions of the satellites and changes in the positions of the receivers. Post-processing of the phase data from the two receivers allows the trajectory of the rover to be calculated. Reference Hoffmann-Wellenhof, Lichtenegger and CollinsHofmann-Wellenhof and others (1992) gave a brief description of the mathematical aspects of the technique but, given reliable post-processing software, the user need not be fully conversant with it.
The initial phase ambiguity between the receivers can be resolved in several ways. Here it was done by the "antenna-swap" method, in which the receivers record data for a few minutes and then the positions of their antennae are swapped and there is a second period of data recording, and the antennae are returned to their original positions. In this study, two tribrachs on fixed tripod mounts were used. This procedure provides sufficient data to solve the initial phase ambiguities.
4.2. Limitations on use of the kinematic GPS method
The kinematic GPS method relies on the uninterrupted tracking of the satellite signal and so at least five Navstar satellites must be visible throughout the session. Four are required for position and time solution and one to allow for error identification. In practice, it is wise to choose a period during which seven or more satellites are visible, Since this reduces the likelihood of undetected cycle slips and allows the isolation ofcyele slips to one satellite. Since there are currently 24 Navstar satellites in the constellation, this is not a very restrictive requirement.
During the 1992-93 season, it was found that if the roving antenna was subjected to persistent vibration, although lock on the satellites signals was not lost, ambiguities in the solution wcrc found to multiply until the position was unreliable. To reduce this problem, the GPS antenna should be isolated from as much vibration as possible. A similar failure gencrally occurred if the kinematic session was too long. A practical rule of thumb was found to be that the session should not exceed 2 h.
4.3. Field procedure
The field work described below was conducted during the 1992–93 summer fidd season using Ashtech MD XII receivers and post-processed using the Ashtech GPPS software package. The base-station antenna was mounted on a tripod with its legs buricd in the snow and which remained fixed throughout the duration of the experiment. The roving antenna was mounted on a 1.5 m long 3 cm diameter aluminium pole which was securely fixed and braced on the back of a Skidoo.
The state of lock of the satellite was continually monirored during the sessions and it was found that, given a smooth surface, the Skidoo could be driven at 25 km h1 without loss of lock. In areas of particularly high or hard sastrugi this speed was reduced, sometimes to as low as 5 km h1.
By inspection of the calculated trajectory from periods during the session when the Skidoo was stationary, we estimatc the uncertainty in position due to the kinematic GPS method alone to be around ± 3 cm. This figure includes both the observation error and the uncertainty introduccd by the post-processing software. From repeated profiles on grounded icc, we estimate that the method of mounting and driving introduces a fllrther ± 8 cm.
4.4. Investigation of tidal flexure with kinematic GPS
For the investigation of tidal flexure, we selected a base station on part of the ice sheet expected to be well above the grounding zone. From here, a route across the grounding zone and out on to the floating ice shelf was establishcd. The GPS sessions were planned to coincide with the extremes of tide. Several kinematic GPS profiles were collected along exactly the same route from grounded to floating ice across the grounding zone. Exact coincidence of the profiles was achieved by driving the Skidoo in the track left by the previous session. The tidal-deflection profiles were derived by linearlv interpolating the irregular elevation data on to a regular spacing. These intcrpolated elevation profiles were subtracted to give the tidal-deflection profile.
Unfortunately, GPS has not yet completely superseded the Transit system, which still providcs the most accurate absolute positioning system where no reference station is available. Post-processing with precise satellite ephemeris can yield ±2 m in precision (Reference Mcdonald and WhillansMcDonald and Whillans, 1988). After the GPS experiment, the base- station tripods were fixed using Transit Doppler satellite positioning (Magnavox 1502b, 30 satellite passes, ±5 m) in order to give the suryey the best available absolute position.
5. Examples of results
5.1. An ice-stream grounding zone
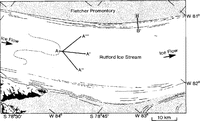
The method described above was first used at the grounding zone of Rutford Ice Stream (Fig. 2). Reference Goldstein, Engelhardt, Kamb and FrolichStephenson (1984) used tiltmeters and observations of strand cracks to infer the limit of flexing in this area. He found that the grounding zone was sinuous and passed around a surface knoll (generated by a bedrock knoll). He used an elastic beam model to extrapolate the tilt data and attempted to map the position of the limit of flexure. Reference SmithSmith (1991) reinterpreted these tilt data and used an improved estimate for the elastic thickness. In places, Smith's estimate of the position of the limit of flexure differs from Stephenson's by 2 km. This highlights the complexity involved in using tilt meter data to map the limit of flexure and reliance placed on the mathematical model.
In this study, repeated profiles were made along the lines shown in Figure 2. The base station was installed at the summit of the knoll. Figure 3a .shows the result of the repeated profiles along line A-A. The tidal-deflection profile (Fig. 3b) shows that the limit of flexure is between 5OO and 800m along the profile. This is very close to the summit of the knoll, closer than either Smith's or Stephenson±s estimates. The other two tidal-deflection profiles, A A” and A A‴ (not presented here), show the same behaviour.
These results were confirmed using tiltmeters placed at the base station and point X. No tidally forced tilting was measured at the base station. At point X, around 400 µrad of tidal tilting was recorded, consistent with the tidal-deflection profile.
It is notable that the flexing limit occurs 2000 m upstream and 50m vertically above the hydrostatic point. Supposing that the limit of flexing coincides with the grounding line implies that the strength of the ice sheet supports a considerable hydrostatic anomaly between the hydrostatic point and grounding line. A simple shear-stress calculation shows that the shear stress required to support the hydrostatic anomaly is around 100 kPa. This is not excessive when compared with the value of 700 kPa found by Reference Collins and SwithinbankCollins and Swithinbank (1968) hy the same method to be required to cause full thickness rifting under similar circumstances at the foot of Beardmore Glacier, Antarctica.
The result of the investigation shows that the limit of flexing, and perhaps the grounding line, are very close to the crest of the surface knoll. Indeed, the original schematic presented by Stephenson is, since the ice stream loses contact with the bed at the crest of the knoll, not as thought on a downward-sloping bed. Thus, the grounding line of Rutford Icc Stream is probably pinned at this point. At least on this flowline, it will be insensitive to small changes in thickness or sea level. The grounding zones to either side of the knoll, where the surface gradients appear more gentle, would, on reflection, have better sites to attempt monitoring groundingzone migration.
Grounding zone of Rutford lce Stream. Bold lines indicate repeated kinematic GPS profiles: A-A shows example 1, the. grounding line; B-B shows example 2, the shear margin. The dashed line marks the grounding line given by Reference StephensonStephenson (1984).

Repeated elevation profiles and tidal-deflection profile over Rutford lce Stream grounding line (A-A').

5.2. A shear margin
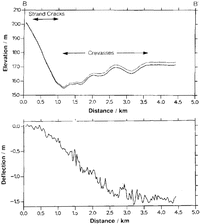
The second investigation site was chosen about 30 km, downstream from the first, across an active shear margin between Ronne lee Shelf and Fletcher Promontory. At this point, around 400 m a–1 of movement is taken up by a shear margin 5 km wide (personal communication from R.M. Frolich). The profiles presented here were collected using a base station on Fletcher Promontory. Crevassing across the shear margin made Skidoo access unwise and the measurements were performed on skis, causing an increase in the mounting noise to around ±10 em.
The tidal-deflection profile is given in Figure 4 and clearly shows that the limit of flexure is between 200 and 500 m along the profile. This point is about 25 m above the hydrostatic level of the ice shelf.
Reference HentleyMacAyeal and others (1986) modelled the dynamics of the Ross Ice Shelf using a finite-element analysis. They found that, in order to reproduce the observed velocity pattern for the ice shelf, they had to postulate a very low strength for shear margins. Indeed, they discovered that an acceptable velocity match was obtained even assuming the shear margins had no strength whatsoever. They suggested that within the she:ar margin there were fracture planes extending from the ice base to sea level, reducing the competent ice thickness by a factor of 10. Given this scenario, we would expect the tidal-deflection profile across a swar margin to show a distinct concentration of the tidal flexure in the area of the fractures; a number of en echelon faults would cause a stepped appearance to the profile. The deflection profile through the shear margin between Ronne Ice Shelf and the grounded Fletcher Promontory shows an elastic response very similar to the grounding zone of Rutford Ice Stream. There is no evidence for steps in the tidal deflection profile or strong localization of the deformation. ation. We conclude that fault planes of the type suggested by MacAyeal do not exist in this area.
Repeated elevation profiles and tidal-deflection profile through the shear margin between Rutford Ice Stream and Fletcher Promontory(B-B')

6. Summary
The collection of repeated kinematic GPS profiles is a quick and efficient method of locating the limit of flexing across a grounding zone. It is more accurate than previous methods and given good conditions can be completed within a day of field work. Further analysis will yield the tidal-deflection profile which can give insight into the behaviour of the ice sheet.
Thc method has shown the location of the flexing limit on Rutford Ice Stream is much closer to the crest of the surface knoll than was previously thought, altering our picture of the grounding-zone geometry. The tidal deflection profile will in future be analysed in terms of elastic-beam theory.
Applying the method across an actiye ice-shelf shear margin showed the flexing zone is about 3 km as compared to 9 km in the grounding zone. It has still to be determined whether this localization of flexure is due to strain softening of the type described by Reference Jacka and BuddJacka and Budd (1989) or if it can be eXplained solely by thinning of the ice shelf in the shear margin. However, despite much surface creyassing in the shear margin, the tidal-deflection profile obtained across it shows that the response to the semi-diurnal tide is primarily flexural rather than by faulting.
Acknowledgements
My thanks are due to the U.K. NERC Geophysical Equipment Pool who loaned the GPS receivers, C. Day for his tireless assistance in the field, and C. Doake and A. Smith, who provided advice. Two anonymous reviewers have greatly contributed to the quality of the manuscript.