I. INTRODUCTION
ABO3-type microwave dielectric ceramics are materials widely used as components in resonators and filters because of their following characteristics: suitable permittivities (εr), near-zero temperature coefficients at resonant frequencies (τf), and high quality factors (Qf). Among ABO3 perovskites, SrZrO3 shows a great potential for a large variety of technological applications in the field of optical waveguides, highly intense violet-blue light emission, laser-host crystals, high-temperature oxygen sensors, and capacitors. Reference Feng, Hu, Cui and Bai1
X-ray diffraction (XRD), Raman and Fourier transform far-infrared (FTIR) reflection spectroscopy are the common measurements for the characterization of solid materials. XRD is used to investigate the crystal structures of ceramics, while, Raman and FTIR reflection spectroscopy are often used to investigate the vibrational modes of ceramics. In addition, the four-parameter semiquantum models can be used to analyze the IR vibrational modes. It may provide new insights to improve the properties or to design new material by studying the lattice vibrational characteristics of materials. Reference Diao, Wang, Lu, Shi and Jing2,Reference Diao and Shi3
H. Fujimori et al. Reference Fujimori, Kakihana, Ioku, Goto and Yoshimura4,Reference Fujimori, Yashima, Kakihana and Yoshimura5 studied the phase change of SrZrO3 from 700 °C to 1200 °C. A. Slodczyk et al. Reference Slodczyk, Limage, Colomban, Zaafrani, Grasset, Loricourt and Sala6 conducted a high-pressure Raman study of Yb-doped SrZrO3. Parida et al. Reference Parida, Rout, Subramanian, Barhai, Gupta and Gupta7 analyzed the system Sr(Zr x Ti1−x )O3 by x-ray diffraction, FT-Raman and FTIR spectroscopy. Amisi et al. Reference Amisi, Bousquet, Katcho and Ghosez8 reported a first-principles study of the structural, electronic, dielectric, and dynamical properties of the different phases of SrZrO3. Kamishima et al. Reference Kamishima, Hattori, Ohta, Chiba and Ishigame9 assigned the Raman bands of SrZrO3 single crystal, which was grown by a floating-zone method using a xenon arc-imaging furnace. Grube et al. Reference Grube, Martin, Weber, Mikolajick and Riechert10 used grazing incidence x-ray diffraction (GI-XRD) to investigate the crystallization behavior of Sr x Zr1−x O y . Malghe et al. Reference Malghe and Yadav11 studied the characteristics of SrZrO3 powders by TG, DTA, XRD, FTIR, SEM, and TEM techniques. Effects of sintering time on crystal structure, dielectric properties, and conductivity of (Ca0.8Sr0.2)ZrO3 ceramics were studied by Fan et al. Reference Chen, Fan, Long and Lei12
However, few studies researched the crystal structure and the vibrational modes of SrZrO3 ceramic using XRD, Raman, and FTIR spectroscopy together. In particular, none of the studies used the four-parameter semiquantum model to analyze the IR vibrational modes. In this work, SrZrO3 ceramic was synthesized by solid-state reaction, and the characteristics of the samples were analyzed by XRD, Raman, and FTIR spectroscopy together. The crystal structure was discussed and the vibrational modes of the Raman and FTIR spectra were assigned. The dielectric properties were analyzed based on the spectral data, that is, the FTIR spectrum was analyzed by curve fittings with the four-parameter semiquantum models, and the theoretical values (the permittivity and the dielectric loss) were calculated.
II. EXPERIMENT
SrZrO3 ceramic was synthesized by a conventional solid-state sintering technique. The raw materials were SrCO3 (analytical reagent, AR) and ZrO2 (AR). The materials were weighed minutely and mixed for 12 h in a plant ball-milling with polyethylene jars, then dried and heated at 1200 °C for 4 h. After mesh screening, the powders were pressed into pellets (15 × 1 mm) in 82 MPa. Finally, the pellets were sintered for 3 h at 1500 °C.
A Hewlett–Packard 4278A capacitance meter was used to measure the capacitance (C) and dielectric loss (tan δ, Q = 1/tan δ) at 1 MHz. The permittivity (εr) was calculated by
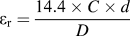 ${\varepsilon _{\rm{r}}} = {{{\rm{14}}{\rm{.4}} \times C \times d} \over D}$
(C is the capacitance at room temperature, D is the average diameter, and d is the thickness of the sample). The pellet surface was carefully polished using micron-scale Al2O3 powders prior to XRD, SEM, Raman and FTIR spectroscopy, which were rubbed off about 20 µm.
X-ray diffraction (XRD) was obtained via a Rigaku D/max-rB X-ray diffractometer (Rigaku Corporation, Tokyo, Japan) at room temperature. The range was from 10° to 120° with Cu Kα incident source (0.02°, 2θ step size, and 1 s per step). Raman scattering spectra were measured from 100 to 800 cm−1 at room temperature by using a Nexus 670 spectrometer (Thermo Electron Corporation, Waltham, Massachusetts) equipped with a liquid-N2-cooled CCD detector and an Olympus BXL microscope (Olympus Corporation, Tokyo, Japan; 100× and 20× objectives). Measurements were obtained in back-scattering geometry by using a Nd:YVO4 laser at 514 nm line as the excitation source (10 mW). Accumulation times were typically 10 collections at an interval of 5s, and the spectral resolution was greater than 2 cm−1. FTIR reflection spectra (30–1000 cm−1) were collected at room temperature via a Bruker IFS 66v FTIR spectrometer (Bruker Corporation, Karlsruhe, Germany) with a high sensitivity DTGS detector. The laser source was He–Ne.
III. RESULTS AND DISCUSSION
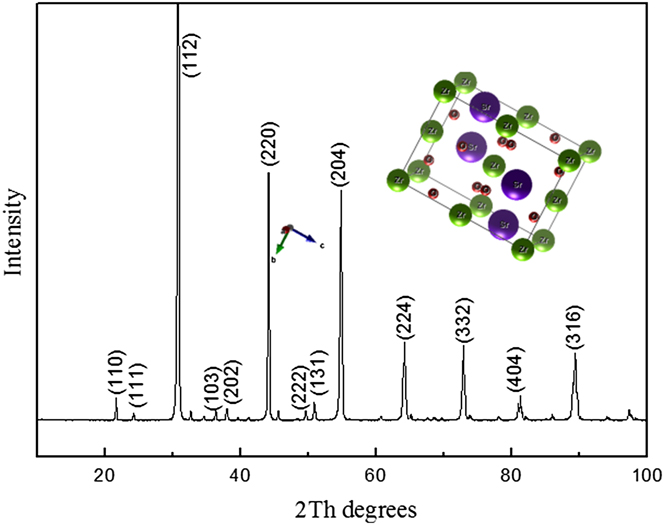
The XRD pattern of the SrZrO3 ceramic (10–100°), as shown in Fig. 1, was indexed according to the Joint Committee on Powder Diffraction Standard (JCPDS) card No. 70-0283, which proves the main phase of the SZ sample has an orthorhombic structure (space group Pbnm, no. 62).
XRD pattern for the SZ ceramic sintered at 1500 °C for 3 h and the unit cell of SZ.

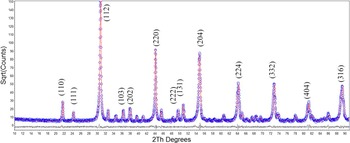
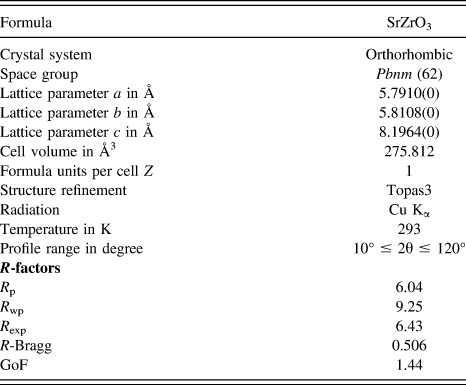
The XRD pattern of the SZ ceramic and the Rietveld refinement results are illustrated in Fig. 2. The orthorhombic structure model (JCPDS# 70-0283) with space group Pbnm (62) was chosen for refinement, and the cell parameters of a = 5.7910 Å, b = 5.8108 Å, c = 8.1964 Å and α = β = γ = 90° were obtained. A unit cell figure of SZ is included in Fig. 1. Reference Kamishima, Hattori, Ohta, Chiba and Ishigame9 The Wyckoff positions for each atom of the sample are listed as below: Sr (4b) (0.004 0.524 0.250), Zr (4a) (0 0 0), O1 (4e) (−0.089 −0.012 0.250), O2 (8i) (0.220 0.292 0.025). In this model, both Sr and Zr atoms are at special sites, but only O is at a general site, in which the sites were not refined. Reference Diao, Wang, Lu, Shi and Jing2 According to the literature, the quality of the data from structural refinement is generally checked by R-values (R p, R exp, R wp) and the goodness of fit (GoF = R wp/R exp). Reference Ferrari and Lutterotti13 The refinement results has a high quality with R p = 6.04, R wp = 9.25, R exp = 6.43, and GoF = 1.44, which indicates that the measured pellet of SZ has an orthorhombic perovskite structure. The refinement results are listed in Table I.
Observed (cycles) and calculated (line) XRD patterns as well as the difference profile (line below the pattern) for the Rietveld structure analysis of the SZ sample.

Crystallographic data of SrZrO3 derived from the Rietveld refinement of XRD data.

Each unit cell of SrZrO3 contains four molecules at room temperature. The irreducible representation Г of the phonon modes at the zone center can be decomposed as follows according to a factor group analysis: Г = 7Ag + 5B1g + 7B2g + 5B3g + 8Au + 10B1u + 8B2u + 10B3u, where 24 are Raman active (7Ag + 5B1g + 7B2g + 5B3g) with 3 acoustic modes (B1u + B2u + B3u), and 25 are infrared active (9B1u + 7B2u + 9B3u) with 8 silent modes (8Au). Reference Amisi, Bousquet, Katcho and Ghosez8,Reference Kamishima, Hattori, Ohta, Chiba and Ishigame9
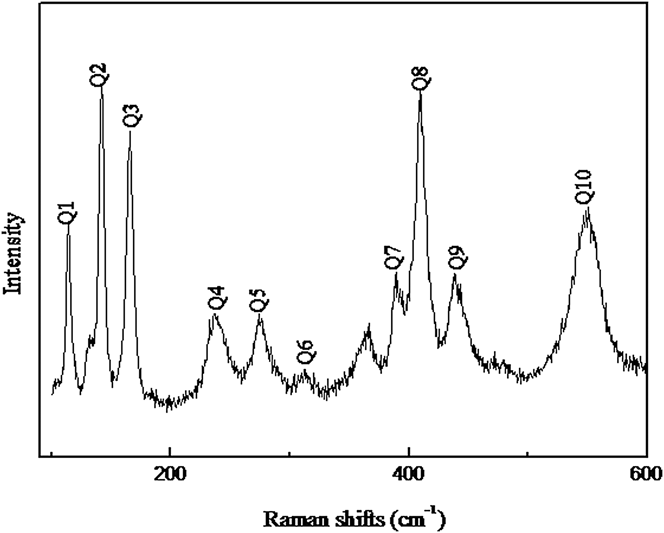
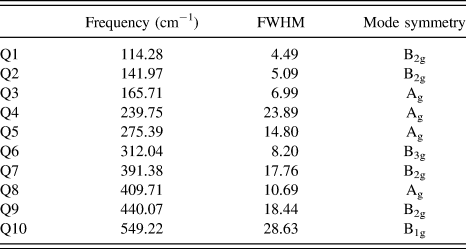
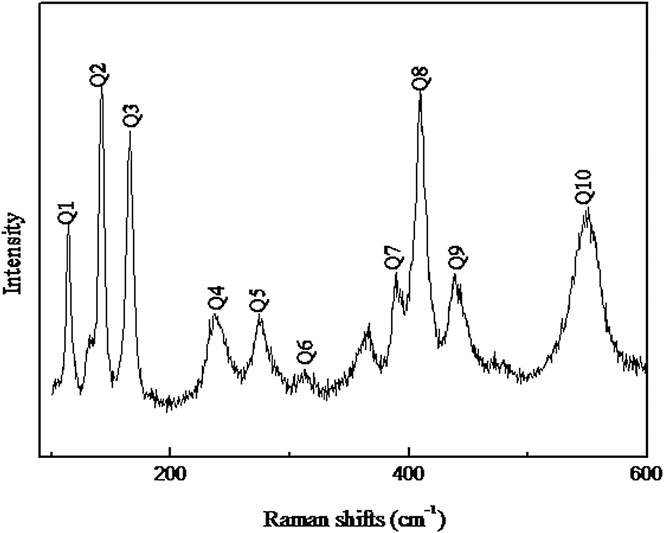
The Raman spectroscopy is widely used to determine the relationship between the lattice vibrational modes and the resonant patterns. Reference Diao and Shi3 The Raman spectrum of SZ ceramic is shown in Fig. 3 from 100 cm−1 to 600 cm−1, and the peaks are assigned according to the related compounds of SZ. Reference Zhao and Weidner14–Reference Slodczyk, Colomban, Lamago, Limage, Romain, Willemin and Sala16 The Raman shifts and full width at half-maximum (FWHM) values are two important parameters to distinguish Raman normal modes. Reference Diao and Shi3 The parameters of the phonon modes were fitted by Lorentzian function. All phonon modes and their descriptions are shown in Table II.
Raman spectrum of the SZ samples in the range of 100–600 cm−1.
Phonon mode parameters from Raman data of SrZrO3.

In our study, 10 main bands out of 24 possible Raman vibrators were observed from 100 cm−1 to 600 cm−1, another three vibrators between Q1 and Q2 were neglected due to their weak intensities. Based on recent studies, Reference Parida, Rout, Subramanian, Barhai, Gupta and Gupta7–Reference Kamishima, Hattori, Ohta, Chiba and Ishigame9 in the range of 100 cm−1 to 200 cm−1, the lowest frequency vibrator Q1 at 114 cm−1 is attributed to the lattice vibration related to Sr2+ ion in the A-site with ZrO6 octahedron. As shown in Table II, the vibrators Q2 and Q3 are also generated by the vibrations of Sr2+ with the ZrO6 octahedron. From 200 cm−1 to 400 cm−1, the vibrators Q4, Q6, and Q7 are essentially associated with O2− and the mode Q5 at 275 cm−1 relates to Sr2+ ion. In the range of 400 cm−1 to 600 cm−1, the three phonon vibrators are all related to Zr–O. The vibrators Q8 and Q9 are caused by the bending vibrations of Zr–O, while the vibrator Q10 is the stretching vibrations of Zr–O. In a word, the phonon vibrators were assigned as follows: B2g (114.28 cm−1), B2g (141.97 cm−1), Ag (165.71 cm−1), Ag (239.75 cm−1), Ag (275.39 cm−1), B3g (312.04 cm−1), B2g (391.38 cm−1), Ag (409.71 cm−1), B2g (440.07 cm−1), and B1g (549.22 cm−1).
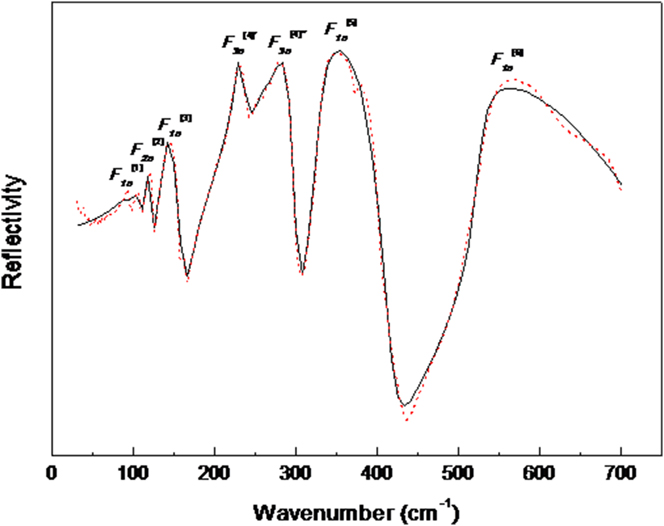
The infrared reflection spectra are obtained by the absorption of the polar lattice vibration. Reference Kamba, Hughes, Noujni, Surendran, Pullar, Samoukhina, Petzelt, Freer, Alford and Iddles17 The wave number of infrared reflection spectra has a close relationship with the dielectric constant. Thus, the research of infrared reflection spectra is also very important. Reference Prasanth, Kumar, Pazhani, Solomon and Tomas18 As shown in Fig. 4, the FTIR reflection spectrum is from 30 to 700 cm−1. The solid line shows the four-parameter fitting curve, and the small circle represents the original data curve. According to the relevant research, Reference Parida, Rout, Subramanian, Barhai, Gupta and Gupta7,Reference Amisi, Bousquet, Katcho and Ghosez8 the modes, below 160 cm−1, are related to the ion movement of Sr2+ ions with ZrO6 octahedron. The modes between 180 and 300 cm−1 are associated with O–Zr–O– bending vibrations. The modes above 500 cm−1 are assigned as the Zr–O stretching modes.
Fourier transform far-infrared reflectivity between 30 and 700 cm−1 for the SZ ceramic and fitting results for the FTIR reflection spectrum of SZ by using the four-parameter model.

Each vibration mode is used as a damped harmonic oscillator. According to the curve fittings with the four-parameter semiquantum model, the vibrational frequencies of the IR modes were obtained, Reference Li, Gao, Li, Pan, Yan and Zhu19 which describes the connection between the complex permittivity ε(ω) and the vibrational modes of the materials as:
 $$\varepsilon \left( \omega \right) = \varepsilon '\left( \omega \right) - {\rm{i}}\varepsilon ''\left( \omega \right) = {\varepsilon _\infty }\prod\limits_{j = 1}^n {{{\Omega _{j{\rm{LO}}}^2 - {\omega ^2} + {\rm{i}}\omega {\gamma _{j{\rm{LO}}}}} \over {\Omega _{j{\rm{TO}}}^2 - {\omega ^2} + {\rm{i}}\omega {\gamma _{j{\rm{TO}}}}}}} \quad ,$$
 $$R = {\left| {{{\sqrt \varepsilon - 1} \over {\sqrt \varepsilon + 1}}} \right|^2}\quad .$$
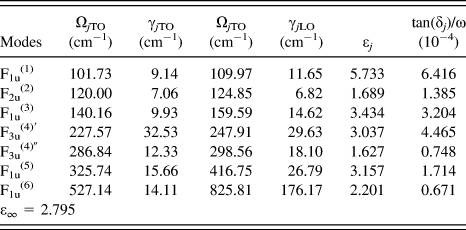
ε∞ is the optical permittivity, n is the number of vibrational modes, Ω jTO and γ jTO are the frequencies and damping factors of the jth transverse modes of vibration, respectively. Ω jLO and γ jLO are the frequencies and damping factors of the jth longitude modes, respectively. Reference Diao, Wang, Lu, Shi and Jing2 Reflectivity (R) is an important parameter in the infrared reflectance spectrum. The Fresnel equation [Eq. (2)] represents the correlation between the IR reflection spectrum and the complex permittivity. This fitting procedure is carried out by FOCUS program and the fitting results from the four-parameter model are shown in Fig. 4 and Table III.
Parameters of the IR-active modes based on the four-parameter model.

There are 25 IR possible modes (9B1u, 7B2u, and 9B3u) which are polarized respectively along the x, y, and z directions. Reference Amisi, Bousquet, Katcho and Ghosez8 From 30 cm−1 to 700 cm−1, six main bands of these modes were observed. The modes near F1u (1) and F1u (5) were ignored due to their weak relative strength. Based on the fitting results, the IR-active modes were assigned as follows: F1u (1) (102 cm−1), F2u (2) (120 cm−1), F1u (3) (140 cm−1), F3u (4)′ (228 cm−1), F3u (4)″ (287 cm−1), F1u (5) (326 cm−1), and F1u (6) (527 cm−1). The first-principle calculations indicated that almost all the symmetric coordinates are involved in each vibrational mode. Reference Diao, Wang, Lu, Shi and Jing2 The mode F1u (1), F2u (2), and F1u (3) are primarily represented as the Sr–ZrO6 inverted translational vibration. The F3u (4) mode, that breaks into F3u (4)′ and F3u (4)″ modes, is regarded as the O–Zr–O bending mode. The mode F1u (5) is described as the inverted ion movement of Zr4+ atoms in the ZrO6 octahedron. The mode F1u (6) is due to the Zr–O stretching vibration, which is caused by the antisymmetrical breathing vibrations of the ZrO6 octahedron. Reference Lei, Fan and Chen20
The complex permittivity is determined from the attenuation of electromagnetic waves in the ceramic. The equation of the dielectric constant frequency is ε(ω) = ε′(ω) + iε′′(ω). Kramers–Krönig analysis (K–K) is a widely adopted standard method to obtain the vibrator parameters from the reflection spectra. Reference Diao and Shi3 In this study, we performed K–K analysis by the formula deduction of Mathematica Software to obtain both the imaginary and real parts of the dielectric constant, Eqs. (1) and (2) were used.
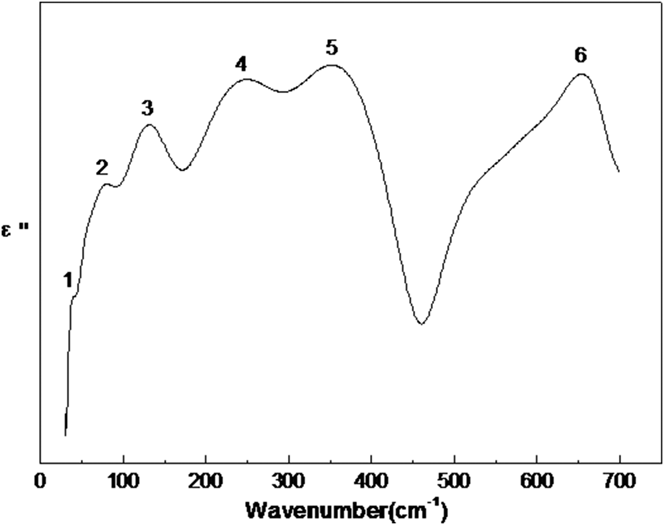
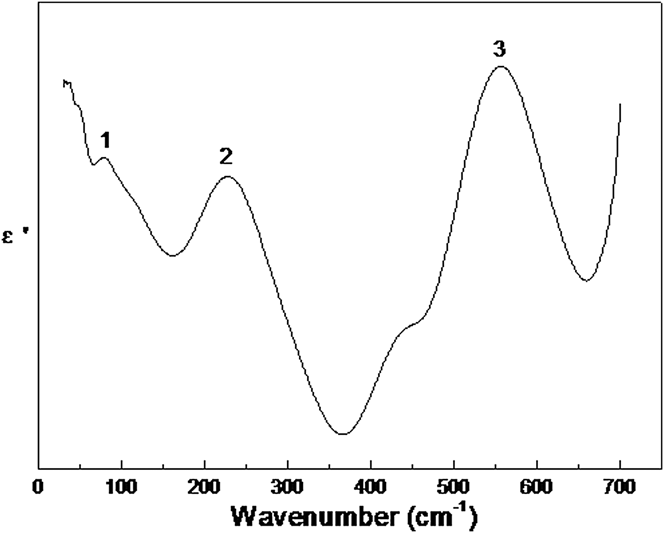
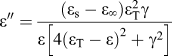
The imaginary part characterizes the absorption characteristics of the vibrator to electromagnetic wave, as shown in Fig. 5. The peaks are numbered from the lowest to the highest frequency, i.e., from 1 to 6. Each peak corresponds to an IR-active mode. The real part is shown in Fig. 6 with three modes. Based on
 $\varepsilon '' = {{\left( {{\varepsilon _{\rm{s}}} - {\varepsilon _\infty }} \right)\varepsilon _{\rm{T}}^2\gamma } \over {\varepsilon \left[ {4{{\left( {{\varepsilon _{\rm{T}}} - \varepsilon } \right)}^2} + {\gamma ^2}} \right]}}$
, when ε″(ω) reaches a maximum value, the resonant frequency ωTO of the vibrator can be determined from the imaginary part of the dielectric constant,
Reference Diao and Shi3
so peak frequency is concerned with resonant frequency ωTO. In these six modes, mode 5 has the maximum value of the imaginary part.
Imaginary part of dielectric constants ε″(ω) calculated from K–K analysis for the SZ ceramic in the far-IR region (30–700 cm−1).

Real part of dielectric constants ε′(ω) calculated from K–K analysis for the SZ ceramic in the far-IR region (30–700 cm−1).

According to the fitting results of four-parameter models, the contribution of each vibrational mode to the permittivity (εr) and dielectric loss tan(δ j ) is discussed. The results can be deduced from:
 $${\varepsilon _j} = {{{\varepsilon _\infty }} \over {\Omega _{j{\rm{TO}}}^{\rm{2}}}}{{\prod\limits_k {\left( {\Omega _{k{\rm{LO}}}^{\rm{2}} - \Omega _{j{\rm{TO}}}^{\rm{2}}} \right)} } \over {\prod\limits_{k \ne j} {\left( {\Omega _{k{\rm{TO}}}^{\rm{2}} - \Omega _{j{\rm{TO}}}^{\rm{2}}} \right)} }}\quad .$$
 $${{{\rm{tan}}\left( {{\delta _j}} \right)} \mathord{\left/ {\vphantom {{{\rm{tan}}\left( {{\delta _j}} \right)} \omega }} \right. \kern-\nulldelimiterspace} \omega } = {{{{{\varepsilon _j}{\gamma _{j{\rm{TO}}}}} \mathord{\left/ {\vphantom {{{\varepsilon _j}{\gamma _{j{\rm{TO}}}}} {\Omega _{j{\rm{TO}}}^2}}} \right. \kern-\nulldelimiterspace} {\Omega _{j{\rm{TO}}}^2}}} \over {{\varepsilon _\infty } + \sum\limits_j {{\varepsilon _j}} }}\quad .$$
The calculated values of εr and
 ${{{\rm{tan}}\left( {{\delta _j}} \right)} \mathord{\left/ {\vphantom {{{\rm{tan}}\left( {{\delta _j}} \right)} \omega }} \right. \kern-\nulldelimiterspace} \omega }$
are also listed in Table III. The first five modes are all below 400 cm−1. They are mainly affected by Sr2+ and Zr4+ and contribute most of the permittivity and dielectric loss. However, the last-mode is caused by the breathing vibrations of the ZrO6 octahedron and has little effect on the dielectric properties.
Reference Fontana, Metrat, Servoin and Gervais21–Reference Silva, Moreira, Almeida, Paniago and Paschoal23
It can be seen that the vibration modes with large contributions to the permittivity also have large contribution to the dielectric loss. The vibrational modes at low frequencies have larger contributions to εr and
 ${\rm{tan}}\left( {{\delta _j}} \right)$
. The dielectric properties are mainly affected by the modes involving more movements of heavier metal atoms. The mode F1u
(1), that can be represented as the Sr–ZrO6 inverted translational vibration, has the highest contribution to the permittivity and dielectric loss.
The value of IR fitting by summing the ε
j
values of all the modes is 23.7 (as shown in Table III). The permittivity value (εr) obtained in this study is 22.4. The calculated value of dielectric loss is
 $\sum {{{{\rm{tan}}\left( {{\delta _j}} \right)} \mathord{\left/ {\vphantom {{{\rm{tan}}\left( {{\delta _j}} \right)} \omega }} \right. \kern-\nulldelimiterspace} \omega }} = 1.9 \times {10^{ - 3}}$
and the experimental data of dielectric loss is 3.1 × 10⁻³. Parida et al.
Reference Parida, Rout, Subramanian, Barhai, Gupta and Gupta7
reported that the measured permittivity is 25 and the dielectric loss is 2.4 × 10⁻³. The calculated values agree well with the experimental data and previous results reported by Ref. Reference Parida, Rout, Subramanian, Barhai, Gupta and Gupta7.
IV. CONCLUSION
The SrZrO3 ceramic was synthesized by a conventional solid-state reaction method at 1500 °C for 3 h. The crystal structures were evaluated by XRD, and the vibrational phonon modes were investigated by Raman and FTIR reflection spectroscopy together. The refined XRD pattern indicates that the material has an orthorhombic perovskite structure (Pbnm, no. 62). The Raman spectrum was researched, and the vibrators were assigned. The FTIR reflection spectrum was obtained and fitted using the four-parameter model. The IR-active modes were assigned as F1u (1) (102 cm−1), F2u (2) (120 cm−1), F1u (3) (140 cm−1), F3u (4)′ (228 cm−1), F3u (4)″ (287 cm−1), F1u (5) (326 cm−1), and F1u (6) (527 cm−1). Almost all atoms are involved in each IR vibrational mode, but each atom has a different contribution to the modes. The contribution of the Sr2+, Zr4+ ion movement in the low frequency modes is larger than that of O2− movement in the high frequency modes. The FTIR indicates that the mode F1u (1) has the highest contribution to the dielectric properties, which is dominated by the Sr–ZrO6 inverted translational vibration. In this study, the calculated data agrees well with the measured values.
ACKNOWLEDGMENTS
We thank Mr Jun Yang and Dr Haiqing Sun for their help during the revision process of this paper.