I. INTRODUCTION
The unprecedentedly high dielectric constant (ε r∼104) of the cubic perovskite CaCu3Ti4O12 (CCTO) ceramics without any phase transition over a wide temperature region of 100–600 K has drawn considerable attention for both its physical origin and practical applications.Reference Subramanian, Li, Duan, Reisner and Sleight1 First of all, related to the physical origin of the colossal dielectric response (CDR) of CCTO ceramicsReference Chung, Kim and Kang2–Reference Adams, Sinclair and West6 and films,Reference Fang, Shen and Yao7, Reference Li, Hu, Sun, Meng and Chu8 many research groups seem to accept the grain boundary internal barrier layer capacitor (IBLC) model as the mechanism for CDR. The CDR is, however, observed also in CCTO single crystalsReference Homes, Vogt, Shapiro, Wakimoto and Ramirez9, Reference Li, Sleight and Subramanian10 without grain boundaries, indicating that it is unexplainable only by the grain boundary IBLC model. Thus, for explaining the CDR in both CCTO ceramics and single crystals, it has been suggested as an alternative mechanism that CDR is attributable to the presence of insulating barriers such as domain boundariesReference Fang and Liu11–Reference Krohns, Lunkenheimer, Ebbinghaus and Loidl13 and twin boundaries.Reference Li, Sleight and Subramanian10, Reference Whangbo and Subramanian14 Recently, Ferrarelli et al.Reference Ferrarelli, Sinclair, West, Dabkowska, Dabkowski and Luke15 have proposed that a nonohmic contact between the electrodes (Au, InGa) and CCTO single crystal is responsible for CDR. Consequently, it can be said that the mechanism of CDR in CCTO is still controversial. On the other hand, for practical applications, CCTO should be made in the form of film devices. Thus many research groups fabricated CCTO films and reported their properties.Reference Fang, Shen and Yao7, Reference Li, Hu, Sun, Meng and Chu8, Reference Si, Cruz, Johnson, Barnes, Woodward and Ramirez16–Reference Nigro, Toro, Malandrino, Fragala, Fiorenza and Raineri37 Up to date, various deposition techniques, including pulsed laser deposition (PLD),Reference Fang, Shen and Yao7, Reference Si, Cruz, Johnson, Barnes, Woodward and Ramirez16–Reference Fang and Shen28 sol–gel,Reference Li, Hu, Sun, Meng and Chu8, Reference Maurya, Singh, Agrawal and Mohapatra29–Reference Singh, Mohapatra and Agrawal33 sputtering,Reference Joanni, Savu, Bruno, Longo and Varela34–Reference Prakash, Varma, Michau and Maglione36 and metalorganic vapor phase deposition,Reference Nigro, Toro, Malandrino, Fragala, Fiorenza and Raineri37, Reference Nigro, Toro, Malandrino, Fragala, Fiorenza and Raineri38 have been used for the fabrication of the CCTO films on Si substrates. As previously suggested by Li et al.,Reference Li, Hu, Sun, Meng and Chu31 it is important to fabricate high-quality CCTO films on Si substrates for real applications, including high capacitive dynamic random access memory. Although the CCTO films fabricated on platinized Si substrates by PLDReference Fang, Shen and Yao7, Reference Fang and Shen18–Reference Deng, Yamada and Muralt20, Reference Fang, Shen, Yang and Li24–Reference Fang and Shen28 show ε r values in the region of 1500–2500 at 10 kHz, relatively low ε r values below ∼1500 at 10 kHz are observable for the films on platinized Si substrates by the sol–gel technique.Reference Maurya, Singh, Agrawal and Mohapatra29, Reference Jimenez, Calzada, Bretos, Goes and Sombra30, Reference Chang, Lee, Ho and Chiou32, Reference Singh, Mohapatra and Agrawal33
Most of CCTO films on platinized Si substrates by PLD are deposited at a fixed substrate temperature.Reference Fang, Shen and Yao7, Reference Fang, Shen and Cao19, Reference Deng, Yamada and Muralt20, Reference Fang, Shen, Yang and Li24, Reference Deng, He and Muralt26–Reference Fang and Shen28 Within the best of our knowledge, only one systematic study is available from Fang et al.Reference Fang and Shen18 They reported the effects of deposition temperature ranging from 450 to 700 °C and oxygen pressure ranging from 2.66 to 26.6 Pa on the microstructures and dielectric properties of CCTO films. In contrast, in the deposition temperature region above 700 °C, we have recently reported that the dielectric properties of CCTO films were remarkably varied by deposition temperature so that ε r values at 10 kHz were increased from ∼300 to ∼2000 with increasing deposition temperature from 700 to 750 °C, respectively, and then decreased to ∼900 at 800 °C.Reference Lee, Kim, Choi, Jung and Yoo25 However, the reason for this variation in dielectric properties with deposition temperature has been unclarified yet. Therefore, in this study we tried to understand the effect of deposition temperature, ranging from 700 to 800 °C, on the dielectric and leakage current properties of PLD-processed CCTO films on the Pt/TiO2/SiO2/Si substrates by carefully investigating detailed microstructures with high-resolution transmission electron microscopy (HR-TEM) and compositional distributions of samples using various analysis methods, including energy dispersive spectroscopy (EDS) and electron energy loss spectroscopy (EELS) in HR-TEM, and Auger electron spectroscopy (AES).
II. EXPERIMENTAL
A stoichiometric polycrystalline CCTO target was prepared by using a conventional solid-state reaction process, and the detailed process was reported in elsewhere.Reference Lee, Yoo and Yoo39 Polycrystalline CCTO thin films were deposited under the optimized copper oxide segregation free deposition process on substrates of Pt/TiO2/SiO2/Si substrates using a KrF excimer laser (λ = 248 nm; LAMDA PHYSICS, Santa Clara, CA), and the details were reported in our previous report.Reference Lee, Kim, Choi, Jung and Yoo25 The 20-nm-TiO2 layer is used for improving the adhesion between Pt and SiO2 layer. The intermetallic compounds and detailed composition analysis were carried out by high-resolution x-ray diffraction (XRD; X’pert Pro, PANalytical, Westborough, MA) with a θ–2θ scan using Cu-Kα radiation (λ = 1.54056 Å). The surface morphology and thickness of each CCTO film were observed by field-emission scanning electron microscopy (FE-SEM; NOVA NanoSEM 200, FEI, Hillsboro, OR). The cross-sectional images of CCTO films and segregated nanocrystallized TiO2 at grain boundary were analyzed by using HR-TEM (3000F, JEOL, Tokyo, Japan) with an acceleration voltage of 300 kV. The interdiffusion at the interfaces of CCTO/Pt and Pt/TiO2 was identified using EDS analysis attached to the HR-TEM. The existence of the intermetallic compound of PtCu3 on the surface of Pt electrode is identified using fast Fourier transformation (FFT) image from the HR-TEM image of Pt electrode. The stoichiometry of nanocrystallized TiO2 was confirmed using EELS (Gatan, Pleasanton, CA) attached to another transmission electron microscopy (TEM; Tecnai F20, FEI, Hillsboro, OR). The compositional depth profile was obtained using AES (PHI660, RBD instrument, Bend, OR). For the measurement of the electrical properties, a silver top electrode was deposited on the CCTO films by DC sputtering with a 150-μm-diameter shadow mask. The ε r and loss (tan δ) of the thin films were measured using an impedance/gain-phase analyzer (HP 4194a, Agilent, Santa Clara, CA) as a function of the frequency (w: 100 Hz–1 MHz) with an oscillation voltage of 100 mV. To reveal the leakage current mechanism of CCTO films under DC bias conditions, current–voltage (I–V) measurements were performed by using a LCR (L: Inductance, C: Capacitance, R: Resistance) source meter (KEITHLEY-4200 SCS, KEITHLEY, Cleveland, OH).
III. RESULTS AND DISCUSSION
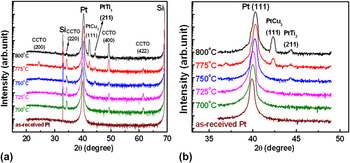
Figure 1(a) shows XRD patterns of the CCTO films deposited at various high temperatures ranging from 700 to 800 °C. The (220)-, (400)-, and (422)-reflection peaks of CCTO represent that all films are polycrystalline in JCPDS (No. 01-072-5884). Except these CCTO peaks, two other peaks are also observed at 2θ ∼42° and ∼44°at elevated temperatures. Unlike previous reportsReference Li, Hu, Sun, Meng and Chu8, Reference Lee, Kim, Choi, Jung and Yoo25 on these peaks, indexing them as CCTO (222) and TiO2 (210), respectively, a careful investigation enabled us to identify these peaks at 2θ ∼42° and ∼44° as PtCu3 (111) and PtTi3 (211), respectively. Because, the CCTO (222) peak is one of minor peaks in polycrystalline CCTO, and the peak of PtCu3 at 2θ ∼42° is the strongest in JCPDS (No.00-035-1358). The PtCu3 compound formation could be confirmed by TEM analysis, which will be described later. Figure 1(b) shows that, comparing with as-received substrate, the (111) diffraction peak of Pt electrode is shifted to higher diffraction angle in all films with increasing deposition temperature, implying that a severe Cu diffusion from CCTO film to Pt layer occurred at the interface to form a Pt–Cu solid solution from 700 to 750 °C, and further Cu diffusion over the solubility limit of Cu in Pt at 775 and 800 °C might form the PtCu3 intermetallic compound as well. However, large amount of copper oxide segregation at grain boundary is observed in Fig. 1(e) of Ref 25, implying that the diffused Cu in Pt layer is squeezed out through grain boundary after cooling process under high oxygen pressure of 500 Torr with slow cooling rate of 3 °C/min. Similarly, copper oxide segregation at grain boundary is also observed at previous study because of the grain boundary grooving after thermal etching process.Reference Lee, Yoo and Yoo39 Consequently, the Pt peak of CCTO film deposited at 800 °C is shifted from higher diffraction angle of 2θ ∼40.3° to lower diffraction angle of 2θ ∼40.1°(not shown). On the other hand, the reason for our argument that the peak at 2θ ∼44° in Fig. 1(a) is not TiO2 (210) but PtTi3 (211) is the following. Because TiO2 (210) peak is a small minor peak in JCPDS (No.00-021-1276), it is surely inappropriate to designate only one peak as TiO2 (210). Instead, this peak is coincident with the (211) main diffraction peak of PtTi3 in JCPDS (No.00-018-0979). In addition, though not represented, these peaks were also observable when as-received Pt/TiO2/SiO2/Si substrates were in situ annealed within the deposition chamber at the temperature region of 750–800 °C in the oxygen pressure of 800 mTorr.
(a) X-ray diffraction patterns of CaCu3Ti4O12 (CCTO) films deposited under various substrate temperatures ranging from 700 to 800 °C on Pt/TiO2/SiO2/Si substrates and (b) enlarged diffraction patterns of Pt electrode. Notice that this is semilogarithmic plot and all data are from our previous report of Ref. Reference Lee, Kim, Choi, Jung and Yoo25.

For a quantitative analysis of any preferred orientation, we estimated the relative intensity ratios of (220) main diffraction peaks of CCTO films, {I(220)/(I(220) + I(422) + I(400))}, and obtained the values of 0.63, 0.6, and 0.6 for the films grown at 700, 725, and 750 °C, respectively. Since the value of 0.6 is calculated from the JCPDS data, these results strongly support that films are composed of randomly oriented polycrystalline grains. With increasing deposition temperature above 750 °C, however, the intensity of (400) diffraction peak is abruptly increased at 775 °C and becomes dominant at 800 °C, representing that CCTO films grow with a strong (400)-preferred orientation. In accordance with this observation, estimated relative intensity ratios of (400)-orientation, {I(400)/(I(220) + I(422) + I(400))} increase from 0.21 at 750 °C to 0.46 and 0.78 at 775 and 800 °C, respectively, whereas the value of 0.16 is estimated from JCPDS. These results are completely different from those in previous reportsReference Fang, Shen and Yao7, Reference Fang and Shen18 because (422)-preferential orientation has been observed for PLD–CCTO films on platinized Si substrates in the literature, whereas (400)-preferential orientation is observed in our films. According to Fang et al.,Reference Fang and Shen18 (422)-preferential growth of CCTO film is favored with decreasing deposition temperature below 700 °C, or oxygen pressure below 200 mTorr at 720 °C, or film thickness below 480 nm at 720 °C in 200 mTorr. Thus, this discrepancy must be because of the difference in the deposition temperature. The origin for (400)-preferential growth of CCTO films will be described later on the basis of TEM analysis.
Referring to the FE-SEM micrographs in our previous report,Reference Lee, Kim, Choi, Jung and Yoo25 one can observe that films grown at 700, 725, and 750 °C reveal smooth and uniform square-shaped grains without any microcracks. The grain morphologies are in good agreement with those of previous report by Fang et al.Reference Fang and Shen18 However, as the deposition temperature is increased above 750 °C, square-and round-shaped grains coexist [Figs. 1(i) and 1(j) in Ref. Reference Lee, Kim, Choi, Jung and Yoo25]. The occurrence of round-shaped grains on the film surface might be due to the formation of (400)-preferential orientation in Fig. 1(a) because these phenomena occur at the same deposition temperatures.
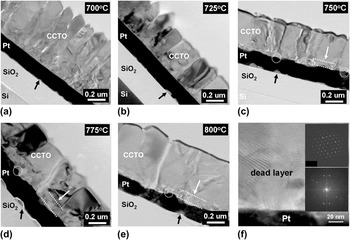
The cross-sectional TEM images of CCTO films are represented in Fig. 2. It is shown that somewhat loosely connected small columnar grains are converted into dense large grains as the deposition temperature is increased from 700 to 800 °C. Although the interfaces of Pt electrode toward CCTO layer in Figs. 2(a) and 2(b) are flat, those in Figs. 2(c)–2(e) are relatively rough and in addition, large amount of Pt hillocks, indicated by white circles, are also observed. Jung et al.Reference Jung, Choi, Kweon and Yeom40 have reported that Pt hillock formation is accelerated for relieving the compressive stress of Pt electrode caused by Ti diffusion from the Ti adhesion layer to Pt electrode. They also report that the Pt hillocks show strong (100) electron diffraction patterns compared to that of Pt (111) electrode. Strong (400)-preferential growth of CCTO films in the XRD patterns of Fig. 1(a) above 750 °C may be ascribed to the formation of [100]-oriented Pt hillocks at the Pt electrode surface. Similar to the “dead layer” frequently observed at the interface between functional dielectric films and Pt electrode,Reference Chen, Yang, Fu, Zhang, Liao and Hu41–Reference Zhao, Zhu, Wu and Li44 it is also observed in our samples as indicated by white arrows in Figs. 2(c)–2(e). In contrast to clear selected area diffraction pattern (SADP) of CCTO grains in the upper inset of Fig. 2(f), the dead layer shows randomly orientated lattice fringes in the Fig. 2(f) and ambiguous SADP in the lower inset of Fig. 2(f), representing that the dead layer consists of randomly oriented grains of 30–50 nm although it is undetectable on the XRD patterns in Fig. 1.
Cross-sectional transmission electron microscopic (TEM) images of CCTO films deposited at (a) 700, (b) 725, (c) 750, (d) 775, and (e) 800 °C on platinized Si substrate, respectively. The Ti diffusion from the glue layer of TiO2 is indicated by black arrows. (f) The upper and lower inset shows the selected area diffraction pattern images of CCTO grain inside and dead layer of CCTO film deposited at 775 °C, respectively.

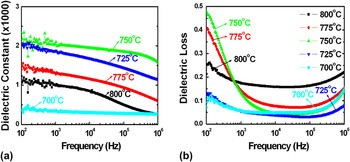
Figure 3 shows ε r and tan δ as functions of frequency for the CCTO film at room temperature. The CCTO film grown at 750 °C shows the highest dielectric constant of 2000 at 10 kHz, whereas other films show lower dielectric constants at 10 kHz, i.e., ε r ∼300, 1700, 1100, and 850 at 700, 725, 775, and 800 °C, respectively. As the deposition temperature is increased from 700 to 750 °C, the dielectric constant is increased because of the presence of enlarged grains with densely packed structure in Figs. 2(a)–2(c), of which results are in good agreement with previous results of CCTO films.Reference Fang and Shen18 However, the severe dielectric constant drop is observed when the deposition temperature is increased over 750 °C. Dielectric loss exhibited unpredictable behavior in their frequency dependence. In general, large dielectric loss at the low frequency is greatly reduced in the medium frequency region, but the loss increases again at high frequencies. The dielectric loss of 0.1 or higher at low frequency is much larger than that of other dielectrics and ferroelectrics.Reference Abazari, Akdogan and Safari45, Reference Gonon and Kamel46 This may be related to their DC resistivity characteristics because the low frequency loss is attributed to space charges and interfacial disorders. The large loss in the high-frequency region between 105 and 106 kHz is due to dipolar oscillations of the materials.
(a) Dielectric constant and (b) loss properties of CCTO films as a function of frequency from 100 Hz to 1 MHz. Note that all the measured ε r and tanδ values are from our previous report of Ref. Reference Lee, Kim, Choi, Jung and Yoo25.

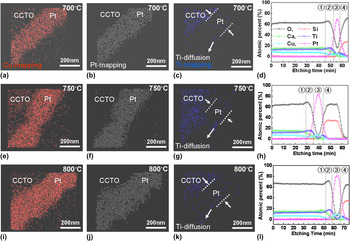
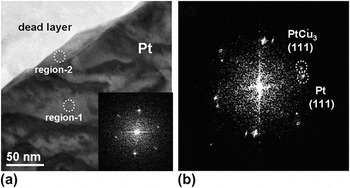
For identifying the chemical reactions at the interface between CCTO films and Pt electrode, both AES and EDS analyses were performed as shown in Fig. 4. Compared with the small amount of Ti diffusion from the adhesive layer of TiO2 to Pt electrode in Figs. 4(c), 4(g), and 4(k) indicated by white arrows, a severe Cu diffusion from CCTO films to Pt electrode is clearly observed in the Cu-mapping images by EDS analysis in Figs. 4(a), 4(e), and 4(i). In addition, AES analysis data in Figs. 4(d), 4(h), and 4(l) exhibit that the amount of diffused Cu into Pt electrode is increased with increasing deposition temperature from 700 to 800 °C. Therefore, it is obvious that the Pt (111) peak shifts to the higher diffraction angle in Fig. 1(b) is due to an increased diffusion of Cu into Pt. As previously mentioned, more serious Cu diffusion in Pt over the solubility limitReference Massalski, Okamoto, Subramanian and Kacprzak47 might result in the formation of PtCu3 compound above 750 °C in Fig. 1(b). The PtCu3 phase mainly exists at the surface of Pt electrode as shown in Fig. 5(a) indicated by white circle in the region 2. In contrast to the FFT image of Pt (111) electrode (Pt 111, d 111 = 2.265 Å) in the inset of Fig. 5(a), the diffraction peak of PtCu3 (PtCu3 111, d 111 = 2.137 Å) in region 2 is clearly observable in Fig. 5(b). However, the PtTi3 phase in Fig. 1 was hardly observed with HR-TEM analysis probably because of its relatively small amount.
The energy dispersive spectroscopy (EDS) mapping images of CCTO films deposited at 700, 750, and 800 °C by (a, e, and i) Cu-mapping, (b, f, and j) Pt-mapping, and (c, g, and k) Ti-mapping, respectively. The compositional depth profiles by Auger electron spectroscopy of CCTO films deposited at (d) 700, (h) 750, and (l) 800 °C, respectively. The each divided region of ①, ②, ③, and ④ indicates CCTO films, dead layer, Pt electrode, and SiO2, respectively.

(a) The low-magnification TEM image of Pt electrode in the CCTO deposited at 800 °C. The inset of (a) shows the fast Fourier transformation (FFT) image of region 1 in Pt electrode. (b) shows the FFT image of PtCu3 (111) in region 2 with Pt (111) electrode.

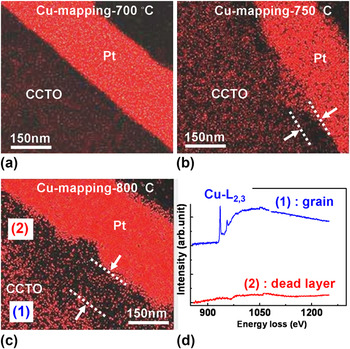
AES analyses in Figs. 4(d), 4(h), and 4(l) for revealing the chemical composition of the dead layer between CCTO films and Pt electrode indicate that the atomic percentages of Ti and O are relatively increased at the dead layer region ② compared to that of other elements. In contrast to the existence of Cu-L2,3 spectrum of CCTO grain near the energy loss region of 940 eV by the EELS analysis, no trace of Cu spectrum appeared in the dead layer as shown in Fig. 6(d). Therefore, the dead layer is mainly composed by the TiO2 phase. In addition, the thickness of TiO2-rich dead layer is increased as the Cu diffusion is accelerated with increased deposition temperature in Figs. 6(a)–6(c). Consequently, a serious decrease in the dielectric constants of CCTO films above 750 °C in Fig. 3(a) is attributed to the TiO2-rich dead layer of relatively lower dielectric constant (ε r,TiO29100), which is connected with CCTO films in seriesReference Fang, Shen, Yang and Li24, Reference Singh, Mohapatra and Agrawal33 The dead layer is known detrimental to other dielectric films on the Pt/TiO2/SiO2/Si substrates because it usually shows much lower dielectric constant compared with dielectric films.Reference Liao, Yang, Zhang, Fu, Chen and Leng43 Also, the measured dielectric constant could be related to the carrier concentration of films, which may vary with deposition temperature so that leakage current behaviors of CCTO films will be discussed in the following paragraph.
The TEM-EDS Cu-mapping images of CCTO films deposited at (a) 700, (b) 750, (c) 800 °C, and (d) electron energy loss spectra (EELS) of (1) CCTO grain and (2) TiO2-rich dead layer region of CCTO film deposited at 800 °C, respectively.

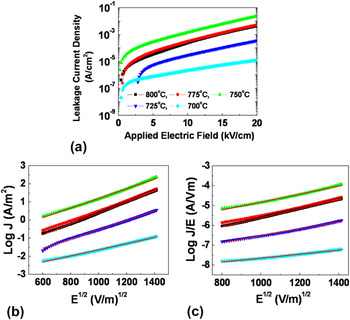
Figure 7 shows the I–V characteristics of the CCTO films measured at room temperature. The CCTO film deposited over 750 °C shows relatively high leakage current compared to the CCTO films deposited at 700 and 725 °C. These results show strong consistency with the low-frequency dielectric loss behaviors in Fig. 3(b). To explain the conduction mechanism, two conventional models are addressed in this study. One is Schottky thermionic emission (SE) and the other is Poole–Frenkel (PF) conduction. These models are basically thermal excitation effects of electric charges out of defects either at interface or inside of the bulk.Reference Vorobiev, Rundqvist and Khamchane48 Following is the explicit formula for SE emission

The I–V measurement of CCTO films under DC bias condition (a) for plots of J versus E (b) for plots of log J versus E 1/2 fitted by Schottky thermionic emission and (c) for plots of log (J/E) versus E 1/2 by Poole–Frenkel conduction mechanism.

where A is a constant, ϕ BE is the barrier height, q is the electric charge, k is the Boltzmann constant, E is the electric field, and T is the temperature. And, ε is the dielectric permittivity at the optical frequency and ε0 are the dielectric permittivity of vacuum. Following is the form for PE conduction

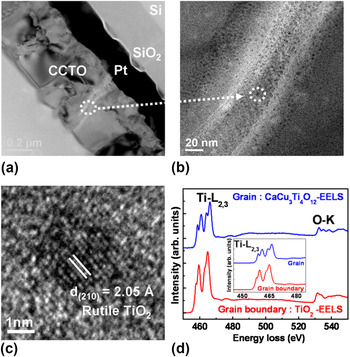
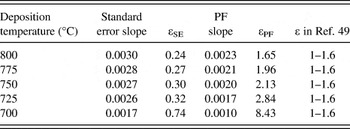
where B is a constant and ϕ PF is the barrier height. It is essential to measure the temperature dependence of the leakage currents, but the fitted value of leakage current could give a guideline for the proper explanation of the conduction models at room temperature. From the fittings of the data, the slopes for the standard erroremission are between 0.0017 and 0.0030, whereas the gradients for the PE conduction are in the range of 0.0010 and 0.0023. It is known that dielectric constant of CCTO films at optical frequency region is 1 to 1.6, which are dependent on porosity or crystallinity of the films.Reference Nigro, Malandrino, Toro, Losurdo, Bruno and Fragala49 Dielectric constants from the standard erroremission are even below 1, whereas the PF conduction provides the dielectric constant from 1.6 to 2.8 except the sample grown at 700 °C. The optical dielectric constant is close to the previously reported values but little higher than the previously reported values of CCTO films due to the difference of deposition temperatures and film crystallinity.Reference Fang, Shen and Li27, Reference Nigro, Malandrino, Toro, Losurdo, Bruno and Fragala49 Origin of the relatively high dielectric constant of the film at 700 °C is unclear so that further investigation using other analysis tools is required. The estimated values of dielectric constant are summarized in Table I. Thus, it is reasonable that PF conduction is dominant in our CCTO films, which indicates that bulk-type trapping of carriers prevail leakage currents of the films. In earlier work by Fang et al.,Reference Fang, Shen and Li27 they also measured the leakage current of CCTO film deposited at 650 °C and insisted that the leakage current mechanism was standard erroremission. However, all of our samples show PF conduction and the discrepancy could be attributed to the difference of deposition temperature. In our samples, it is possible that TiO2-rich dead layer existing at interface between CCTO films and Pt electrode could act as trap sites for blocking charge transport and as a source for varying the dielectric loss and leakage current. Similarly, the trap-related conduction behaviors in CCTO films are frequently observed in the previous studies.Reference Singh, Mohapatra and Agrawal33, Reference Fang, Shen, Yang and Li50, Reference Li, Shen, Hu, Yue and Chu51 In addition, as shown in Figs. 8(a)–8(c), it is confirmed that nanocrystallized impurity phase of rutile TiO2 is embedded in each grain boundary of all CCTO films. EELS analysis on the oxygen stoichiometry of nanocrystallized TiO2 revealed that the peak splitting of the Ti-L2,3 edge at the grain boundary was not as clear as that of the grain inside in the inset of Fig. 8(d), but quite similar to that of previously reported stoichiometric rutile TiO2.Reference Vodungbo, Zheng, Marangolo, Demaille and Varalda52, Reference Mitterbauer, Kothleitner and Hofer53 Therefore, it can be suggested that the insulating TiO2 nanoparticles at the grain boundaries also block the free carriers transport and induce the PF conduction behavior of CCTO films. Consequently, microstructure changes and compositional variations in CCTO films are responsible for the variation in their dielectric and leakage current properties.
(a) Cross-sectional TEM image of CCTO film deposited at 775 °C on platinized Si substrate, (b) enlarged image of grain boundary, (c) high-resolution transmission electron microscopic image of nanocrystallized rutile TiO2 in grain boundary, and (d) EELS spectra of grain and nanocrystallized TiO2 in grain boundary. The inset of (d) shows the enlarged view of EELS spectra for Ti-L2,3 edge.

Calculated values of optical dielectric constant of the CCTO films based on Standard Error and PF models.

IV. CONCLUSION
We carefully investigated the effect of deposition temperature on the dielectric and leakage current properties of polycrystalline CCTO thin films grown on the Pt/TiO2/SiO2/Si substrates by PLD. For this study, the deposition temperature was varied from 700 to 800 °C. While the dielectric constant ε r is greatly increased from ∼300 to ∼2000 at 10 kHz with increasing the deposition temperature from 700 to 750 °C, it is seriously decreased above 750 °C and thus led to ∼900 at 800 °C. The improvement in the ε r value up to 750 °C is most probably due to the CCTO microstructure change from smaller columnar grains to dense larger equiaxed grains. The relatively low dielectric loss of CCTO films deposited at 700 and 725 °C including smooth surface of Pt layer at low-frequency region implies that electrical conductivity under AC field can be strongly affected by the interdiffusion at the interfaces between CCTO films and Pt electrode. Large degradation in the ε r value above 750 °C is attributable to the TiO2-rich dead layer formed at the interface between the CCTO layer and Pt electrode by a severe Cu diffusion from CCTO to Pt electrode. Meanwhile, the Pt hillocks grown at [100]-direction due to the Ti diffusion from the adhesive layer of TiO2 to Pt electrode induce strong (400)-preferred orientation of CCTO films from 750 to 800 °C. The leakage current behaviors of CCTO films are in good agreement with PF conduction mechanism, where both the TiO2-rich dead layer at the interface and rutile TiO2 nanocrystalline particles segregated at CCTO grain boundaries are considered to play a role of charge trapping centers for blocking current flow through CCTO films.
ACKNOWLEDGMENT
This work was supported by the Korea Science and Engineering Foundation grant funded by the Korea government (MEST: Ministry of Education, Science and Technology) (No. 2010-0027688).