I. INTRODUCTION
Improving lubricant properties has been an indispensable area of research for many decades. Several additives were introduced to enhance thermal and lubricating properties of the lubricants nevertheless the efficiency is still compromised. Recently, it was shown that the addition of nanometer sized (1–100 nm) particles to liquids including base oils could significantly enhance various properties of base fluids. Such nanoparticle suspensions are widely known as nanofluids or nanolubricants.Reference Choi, Zhang, Yu, Lockwood and Grulke1 Carbon nanotubes based nanofluids were found superior to most of the metallic and oxide nanofluidsReference Choi, Zhang, Yu, Lockwood and Grulke1,Reference Ding, Alias, Wen and Williams2 in terms of enhanced thermal conductivity. Nonetheless, the discovery of graphene nanoflakesReference Novoselov, Geim, Morozov, Jiang, Zhang, Dubonos, Grigorieva and Firsov3 made it possible to synthesize nanofluids with even better efficiency. Graphene nanoflakes are made of one layer of atomic carbon with theoretical specific surface area up to 2600 m2/g.Reference Chae, Siberio-Perez, Kim, Go, Eddaoudi, Matzger, O'Keeffe and Yaghi4 In addition, it has excellent in-plane thermal conductivity which can be as high as 5200 W/m·K.Reference Balandin, Ghosh, Bao, Calizo, Teweldebrhan, Miao and Lau5 Moreover, 0.2 mg/L graphene (Graphene Laboratories Inc., Calverton, New York) added as an additive to the base oil will only cost approximately US$ 0.0005. This makes graphene one of the cheapest additives available in the market. As the bulk production techniques for graphene are getting efficient, the cost is expected to further decrease drastically. Furthermore, the nano size of graphene makes it possible to enter small contact regions and also pass through oil filter without damaging it. Graphene oxide nanosheets were found to enhance the thermal conductivity of water by up to 47.5% with 0.25 wt%.Reference Hajjar, Rashidi and Ghozatloo6 Similarly, ethylene glycol based graphene nanofluids show an enhancement of 61.0% with 5.0% volume fraction.Reference Yu, Xie and Chen7 The thermal conductivity of functionalized-thermally exfoliated graphene based nanofluids also showed an excellent enhancement up to ∼60% at 50 °C with a low volume fraction of 0.056% in deionized water.Reference Baby and Ramaprabhu8 An enhancement of 401.49% in viscosity of glycerol was achieved by loading of 2% graphene nanosheets at shear rate 6.32 s−1 and 20 °C.Reference Moghaddam, Goharshadi, Entezari and Nancarrow9 Few recent reports also discussed the effects of surfactants on graphene nanofluids stability,Reference Uddin, Kuila, Nayak, Kim, Ku and Lee10 effect of surface modification of graphene,Reference Li, Chen, Mo, Jia and Shao11 anti-wear effects,Reference Taha-Tijerina, Peña-Paras, Narayanan, Garza, Lapray, Gonzalez, Palacios, Molina, García, Maldonado and Ajayan12 functionalization effect of graphene on overall propertiesReference Ma, Yang, Shi, Wang, Zhang and Wang13 and Newtonian and non-Newtonian behaviors of graphene–water based nanofluids.Reference Mehrali, Sadeghinezhad, Latibari, Kazi, Zubir and Metselaar14 Although a few oil based suspensions have been investigated,Reference Ma, Yang, Shi, Wang, Zhang and Wang13,Reference Eswaraiah, Sankaranarayanan and Ramaprabhu15 engine oil formulation with industrial standards have not been thoroughly investigated. One of the main reasons for the failure of engine oils is their thermal degradation due to elevated heat conditions. Increasing heat levels which exceed 250 °C at cylinder liner piston ring interfaces in enginesReference Lloyd, Roy, Walter, Milad, Jin and Li16 lead to various problems such as accelerated decomposition of additives and base oil, increasing volatility, viscosity-index improvers shearing down more rapidly, rupture of oil films, faster abrasion, scuffing conditions, and shortening the life of filters. Furthermore, heat increases both the collision rate of molecules and the activation energy of the reaction. Therefore, it is vital to understand the thermal behavior of the oil in the presence of nanoparticle additives. In this study, we have explored the thermal degradation of graphene based API 20W50 SN/CF and SJ/CF engine oil formulations using thermogravimetric analysis (TGA). The experimental results were used to obtain kinetic parameters to understand thermal degradation of oil samples.
II. MATERIALS AND METHODOLOGY
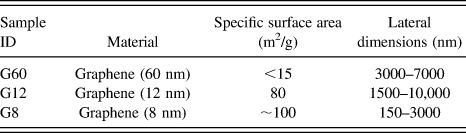
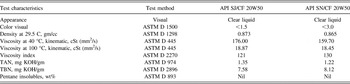
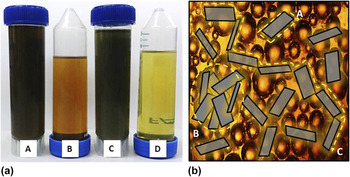
Graphene flakes powder (Table I) was purchased from Graphene Labs Inc. Paraffinic oil with 150, 500, 2100 Saybolt Universal Second (SUS) viscosity, API 20W50 SN/CF and API 20W50 SJ/CF mineral oils (Table II) were obtained from Lube World, Selangor, Malaysia. While API SNCF was introduced in the year 2010 for the vehicles in 2011 and older, the API SJ/CF was introduced in 1997 for 2001 and older vehicle engines. The graphene powder was suspended in mineral oil at 0.01 wt% concentration (Fig. 1). To ensure proper blending of the nanoparticles in oil, stirring and sonication were performed for 4 hours using bath-sonicator (JAC Sonicator 1505, 4 kHz; KODO, Hwaseong, Korea). The samples were physically monitored to examine settling of nanoflakes.
Graphene dimensions as per supplier.

Base oil properties.

a) Engine oil samples (0.01 wt%) representing stability. (A) 20W50 SJ/CF + G60 nm; (B) 1:20 dilution of (A); (C) 20W50 SN/CF + G60 nm; (D) 1:20 dilution of (C); (b) model depicting possible graphene distributions when suspended in oil. (A) Freely suspended individual graphene flake; (B) clustered graphene flakes; (C) percolation network of graphene flakes.Reference Dhar, Sen Gupta, Chakraborty, Pattamatta and Das17

Scanning electron microscopy (SEM) of the graphene nanoflakes was performed by mounting the samples on stubs with conductive carbon tape using JOEL JSM 6400 LV (JEOL USA, Peabody, Massachusetts). All samples were analyzed for their morphology and elemental compositions with energy-dispersive x-ray spectroscopy (EDX). We measured the stability of suspensions by finding the zeta potential using Zetasizer Nano (Malvern Instruments Ltd., Malvern, UK). It is electric potential existing between the particle surface and the dispersing liquid at the slipping plane. The equipment uses combination of electrophoresis and laser Doppler velocimetry, where the velocity of a particle in a liquid is measured when an electrical field is applied. Since the viscosity and the dielectric constant of the oil is known, Henry equation is applied and followed by obtaining the zeta potential by solving Smoluchowski equation. Thermal degradation studies were performed using simultaneous thermal analyzer 6000 (PerkinElmer, Waltham, Massachusetts). Oil samples <15 mg were used in the analysis under both oxygen and nitrogen gas with a purge rate of 20 mL/min. The samples were maintained at 30 °C isothermal state and then gradually raised up to 800 °C with a heating rate of 5, 10, 15, and 20 °C/min according to the desired experiment. Onset temperature or the initial decomposition temperature, which is the measure of thermal stability of that material, was recorded from the TGA graphs obtained. Activation energy (E a) which is the minimum amount of energy needed to initiate the oxidation process was obtained after calculations using TGA decomposition kinetics software. Thermal conductivity measurements of the graphene nanolubricant were performed using a portable thermal conductivity meter KD2 Pro (Decagon Devices, Inc.).
III. RESULTS AND DISCUSSION
A. Characterization
Figure 1(a) shows the oil formulation model in which graphene is suspended in the oil. The model shows how graphene can be found as a freely suspended individual flake, clustered flakes, and in the form of percolation network. The characteristic spectra of graphene nanofluids (8 nm) were observed for various concentrations. The absorbance was increasing with the increase in concentration and the peak was observed approximately at 225 nm wavelength. This measurement is in good agreement with the existing reports.Reference Hajjar, Rashidi and Ghozatloo6
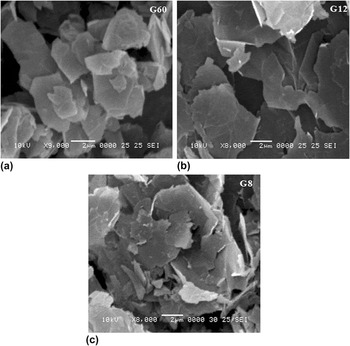
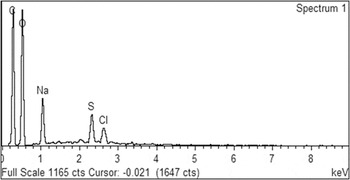
The SEM images show the physical nature of graphene flakes in powder form, Fig. 2. The appearance of graphene shows that the flakes are stable without much agglomeration. After EDX analysis, using quantitative method the graphene flakes were analyzed and normalized results were obtained, Fig. 3. The atomic composition is comprised of C and O—95.67%, and Na—2.85%. The results also showed that in the presence of 0.01 wt% Graphene 60 (G60), the thermal conductivity of API SN/CF 20W50 can be enhanced by 23% at 80 °C.
Scanning electron microscope graphs of graphene: G-graphene; 60 (a), 12 (b), and 8 (c) nm thick.

EDX plot of graphene nanoflakes.

B. Thermogravimetry analysis
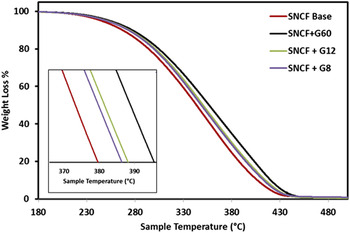
Figure 4 shows the thermogravimetry curves of oil samples (SN/CF). The sample loses its moisture content and is quite stable until approximately 250 °C. Oxidation and the elimination of low molecular weight products occur at 297.79 °C, followed by the degradation of remaining hydrocarbon. The graph shows that after 450 °C decomposition of remaining hydrocarbons of higher molecular weight take place. The maximum weight loss is noticed at 353 °C in case of G60 nm however, the maximum weight loss temperature decreases with the graphene size. Furthermore, the onset temperature at which the oxidation starts for SNCF formulation is delayed in the presence of graphene flakes and depends on the size of the graphene as well (Fig. 5).
Left: Thermogravimetric (TG) curves of SAE 20W50 SN/CF with graphene (60, 12, 8 nm). Right: Derivative weight % of SAE 20W50 SN/CF with graphene (60 nm) at a heating rate of 5 °C/min under a nitrogen purge of 20 mL/min.

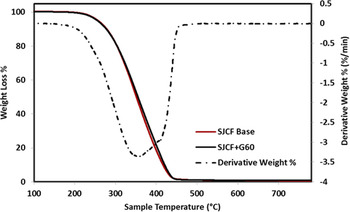
TG and differential thermogravimetric (DTG) curves of API 20W50 SJ/CF with and without G60 nm at a heating rate of 5 °C/min under a nitrogen purge of 20 mL/min.

It is well known that various properties especially thermal conductivity of nanoparticle based suspensions depend on the size (thickness, length, and diameter) of nanoparticles. Many molecular dynamics studies have found that the thermal conductivity of graphene also depends on lateral dimensions and the thickness owing to two-dimensional nature of phonons in graphene.Reference Balandin, Ghosh, Bao, Calizo, Teweldebrhan, Miao and Lau5,Reference Xu, Pereira, Wang, Wu, Zhang and Zhao18 When Xu et al.Reference Xu, Pereira, Wang, Wu, Zhang and Zhao18 measured the thermal conductivity of single-layer graphene at 27 °C with respect to graphene's length and temperature, thermal conductivity was increasing and remained logarithmically divergent with sample length. Nika et al.Reference Nika, Askerov and Balandin19 found that the long mean free path of the long-wavelength acoustic phonons in graphene can lead to an unusual nonmonotonic dependence of the thermal conductivity on the length L of a ribbon. The results also confirmed that the effect is pronounced for the ribbons with the smooth edges (specularity parameter p > 0.5) and scaling of the phonon thermal conductivity with the lateral sizes in graphene. Similarly, thermal conductivity of graphene was found to increase with the number of layers, approaching the in-plane thermal conductivity of bulk graphite for the thickest samples, while showing suppression below 160 W/m K at room temperature for single-layer graphene.Reference Jang, Chen, Bao, Lau and Dames20 The observation in our experiments could also be essentially due to the phonon effect in graphene which depend on the length and thickness of the graphene. MehraliReference Mehrali, Sadeghinezhad, Latibari, Kazi, Zubir and Metselaar14 used three different surface area (300, 500, and 750 m2/g) graphene and found that the graphene with specific surface area 750 m2/g dispersed in water could enhance thermal conductivity up to 27.64% at 0.1 wt%. However, contrarily we observed that the initial oxidation is delayed more in the presence of 60 nm think flake which was low specific surface area (Table I).
Furthermore, it is understood from the broader peak of derivative weight % that the oil sample contains many other compounds (additives) similar to base oil. SN/CF oil in the presence of graphene seems to perform better than SJ/CF as seen in Fig. 4. Both the onset temperature and maximum oxidation temperature are almost same; however, the oxidation speed of graphene based nanolubricant is slightly delayed than the base oil. This observation is similar to Zhang et al.Reference Zhang, Demydov, Jahan, Mistry, Erdemir and Malshe21 who studied the thermal properties of Ag–MoS2 nanoparticle based multi-component lubricating system. Their TGA results showed that the starting temperature of oxidation for both cases, with and without nanoparticle is approximately 360 °C. It is interesting to note that the hydroperoxide concentration level in Cu-kerosene nanofluids was found to be low after a thermal oxidation reaction.Reference Li, Xie and Fang22 Indicating that the Cu nanoparticles reacted with the oxygen before the kerosene was oxidized. This shows that a suitable amount of nanoparticles added into a base oils and fuels can enhance its thermal oxidation stability. Similarly, graphene suspended in the oil could have the potential to get oxidized in an oxygen rich environment. In a thermal treatment, the polyhydrocarbon template has helped to produce high-quality reduced graphene oxide compared to good-quality reduced graphene oxide through a chemical reduction method.Reference Some, Kim, Yoon, Yoo, Lee and Park23
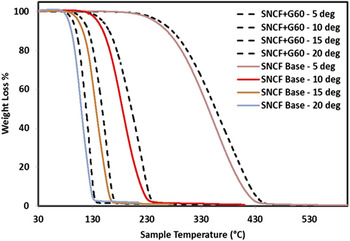
To ensure the repeatability of the TGA curves, the heating rate was varied from 5 to 10, 15 and 20 °C/min, Fig. 6. It was observed that the initial decomposition temperature increase with the heating rate in all the four cases. Moreover, the presence of graphene helps in the oxidation delay of approximately 13–17 °C.
Effect of heating rate on SAE 20W50 SN/CF + graphene. Nitrogen purge rate of 20 mL/min.

C. Kinetic studies
TGA kinetics approach of this study uses the well-known variable heating method developed by Flynn and Wall (1966)Reference Flynn and Wall24. It relates the pre-exponential factor A, the activation energy E, and the reaction model f(α) as seen in the following expression:
 $${{{\rm{d}}a} \over {{\rm{d}}t}} = A\,\exp \left( {{{ - {\rm E}} \over {RT}}} \right){\left( {1 - a} \right)^n}\quad$$
where da/dt is the rate of mass loss, a is the fraction of material reacted, n is the reaction order, E is the Arrhenius activation energy (J/mol), T is the temperature (K), R is a constant (8.314 J/mol K), and A is the pre-exponential factor (s−1). Under the application of a constant heating rate, ϕ, and assuming a first order reaction (n =1), the rate expression becomes:
 $${{{\rm{d}}a} \over {\left( {1 - a} \right)}} = \left\{ {{A \over \phi }} \right\}\exp \left( {{{ - {\rm E}} \over {RT}}} \right){\rm{d}}T\quad .$$
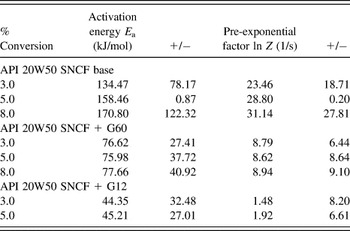
Since a value of n = 1 is used (first order kinetics) this method is essentially the same as that used by ASTM Standard Test Method E 1641. Salehi et al.Reference Salehi, Clemens, Graule and Grobéty25 discussed the suitability of using model free isoconversional methods to analyze thermal decomposition of metal injection molding feedstocks.Reference Salehi, Clemens, Graule and Grobéty25 Since the knowledge of the reaction mechanism is not required, model free methods are regarded as most reliable way to determine kinetic parameters of thermally activated complex reactions. These methods are based on studying the degree of conversion with respect to temperature at different heating rates (Fig. 6). In the model free methods, activation energy is calculated directly from the TGA curves. Activation energy takes into consideration several processes occurring simultaneously. The rate of degradation, da/dt, is assumed to depend on the temperature and weight of the sample. Therefore, the main advantage of eliminating the necessity of a kinetic model is clouded by the influence of the sample mass and size in the apparent kinetics parameters calculated. To reduce possible errors regarding size and mass, samples of similar dimensions and masses were used. It is assumed for the thin disks used that the binder removal rate is predominantly determined by decomposition rates of organics and not by transport processes. Table III contains the kinetic parameters that were obtained by processing the TGA data using PerkinElmer kinetic software. The change in activation energy with the addition of graphene reflects differences in the decomposition kinetics due to several factors including oxidation. It is apparent that the pure oil formulation has higher activation energy, whereas the addition of graphene significantly reduces its activation energy. Furthermore, the reduction in graphene thickness which decreases in the number of layers further decreases the activation energy.
Kinetic parameters obtained from the reactions.

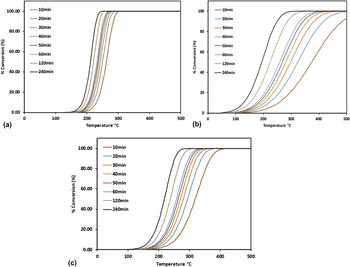
Figure 7 shows the temperature required to achieve a 3% conversion at different holding times. The considerable increase in onset temperature for the oxidation of the oil with the increase in holding time is clearly evident from the results. Furthermore, in the presence of G60 nm the complete conversion happens after 400 °C which is 100 °C more than the oil without graphene. Similarly, with the addition of graphene 12 nm, the complete conversion happens around 600 °C [out of scale in the Fig. 7(b)]. This shift in the required temperature for the complete conversion in the presence of different sized graphene shows that the graphene size plays a crucial role.
Isochronal decomposition predictive curves; (a) SN/CF oil; (b) SN/CF oil + G12; (c) SN/CF oil + G60.

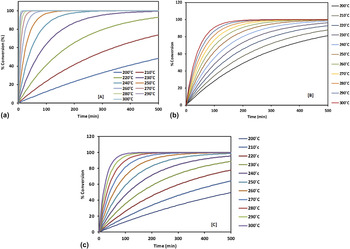
Under isothermal conditions the activation energy remains same as in the isochronal conditions. However, there is significant delay in oil oxidation time in the presence of graphene flakes as shown in Fig. 8. It also further confirms that the oxidation depends strongly on the size of the graphene.
Percentage conversion versus time (min) under isothermal conditions. (a) SN/CF oil; (b) SN/CF oil + G12; (c) SN/CF oil + G60.

It is observed from Fig. 8, that while the base oil formulation at higher temperatures ranging from 300 to 260 °C oxidizes within 50 min of the reaction, the nanolubricant resists oxidation beyond 100 min at the same temperature range. G60 nm helps the base oils remain stable with a conversion value of just 45% for 500 min. However, at higher temperatures the onset temperature for oxidation is slightly higher than that of oil containing graphene 12 nm. This indicates that the heat dissipation in oil varies with the size of the graphene flake. The major reason behind the enhancement of thermal properties of the oil could be attributed to the superior thermal conductivity of graphene flakes.
IV. CONCLUSION
The research findings indicate that graphene could be an excellent additive to improve the thermal properties of base oils used for engine applications. TGA curves show that in the presence of graphene flakes the onset temperature for oxidation could be delayed by 13–17 °C. The thermal effect of graphene depends on the flake size and the length. The TGA results were also verified using four different heating rates which show similar effects of graphene. The activation energies of the oil formulation are strongly affected in the presence of graphene flakes. The onset temperature of oxidation gets significantly higher in the presence of graphene. In the presence of 0.01 wt% G60, the thermal conductivity of API SN/CF 20W50 can be enhanced by 23% at 80 °C. As a result, the improvement of graphene based nanolubricants thermal properties could be attributed to the enhanced thermal conductivity effect of graphene flakes. Further research on graphene based nanolubricants would pave way for its early commercialization.
ACKNOWLEDGMENT
The authors would like to acknowledge PerkinElmer, Malaysia for supporting TGA kinetic studies at its facility. This paper was originally accepted for and presented at MITC2015.