INTRODUCTION
In the 1980s, with the growth in the number of radiocarbon (14C) laboratories, including new accelerator mass spectrometry (AMS) laboratories, a proposal was made for a formal quality assurance program to be introduced (Long and Kalin Reference Long and Kalin1990). This could take the form of a laboratory intercomparison or proficiency trial as set out in Thomson et al. (Reference Thompson, Ellison and Wood2006), where a selection of samples is chosen to be used in the intercomparison and all working laboratories are invited to take part in the intercomparison to check their own individual performance. Following from early work, a community program of intercomparisons began (Scott et al. Reference Scott, Naysmith and Cook2018). The samples selected to be used in these programs were natural and routinely dated materials, many of which had the potential to become internationally recognized reference materials. The main criteria for selecting samples were that they should (1) be of archaeological and/or geological interest, (2) cover the broad spectrum of laboratory experience (age, sample type, etc.), (3) satisfy rigorous homogeneity testing, and (4) be known age if possible. In this short paper we concentrate on the wood samples relevant to criteria 1, 2, and 4, used in the intercomparison studies. We will briefly describe the pretreatment method used to extract holo cellulose, and the connections between the different intercomparisons where the same material has been used on several occasions (as wood or cellulose). Where appropriate, updated consensus values will be provided. Finally, we provide an illustration of the benefits which an individual laboratory can gain from a well characterized intercomparison sample.
SAMPLES AND STUDIES
The Different Wood Samples and their Pretreatment to Holo Cellulose
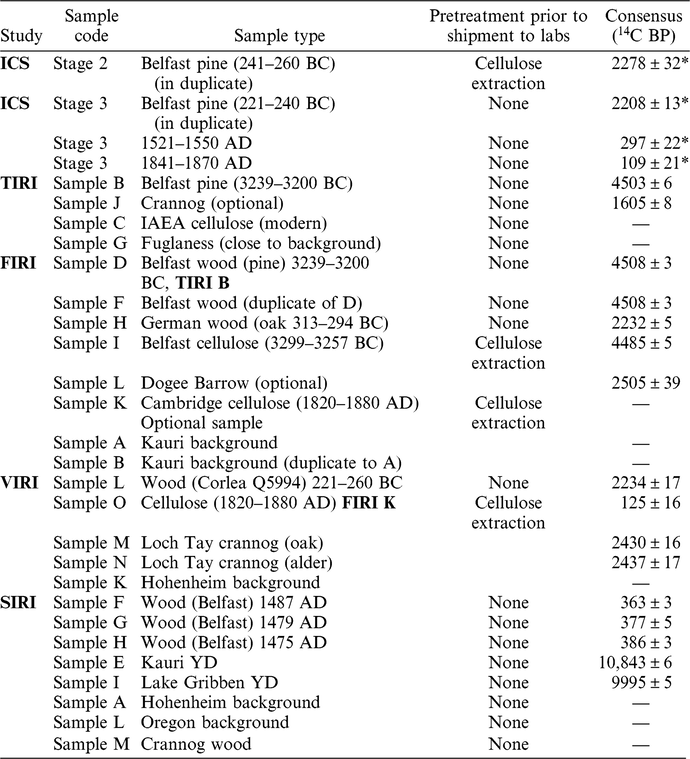
We now reflect on the compendium of wood samples that have been used in the intercomparisons starting from ICS in 1988. Table 1 describes the 29 wood samples including cellulose, that have been used. This paper will not consider any further the near background or background wood samples, namely FIRI A and B (Kauri), VIRI K (Hohenheim), SIRI A and L (Hohenheim and Oregon) or TIRI G (close to background). Similarly there will be no further discussion of modern samples, VIRI O (FIRI K) and IAEA cellulose (TIRI C). SIRI M, although used previously, will not be further considered since in SIRI this was provided only to radiometric labs.
Summary values for all wood and cellulose samples.

* The ICS results are summarized as the overall mean and standard error of the mean.
Fifteen of the wood samples have been dendro-dated. Dendro-dated woods are valuable to include not least since they provide an independent measure of the age of the sample (known calendar age). This provides an opportunity to compare the results with the known age (after calibration) (and so is a more nuanced comparison than simply using the consensus 14C age), and allows laboratories to directly connect to some of the ongoing calibration work. Several of the samples had also been previously dated. Historically, to ensure that we had sufficient materials, the samples have been provided as blocks of rings (either 20 or 40 rings), and we have chosen the blocks to lie on a “plateau” on the calibration curve. As a result, there has been no formal homogeneity testing. In SIRI where the focus was on AMS laboratories, we have provided for the first time single rings.
Wood Descriptions
In ICS, the samples were provided by Professor M Baillie, Queens University, Belfast, comprising two samples of contiguous 20 rings of dendro-dated bog oak. TIRI B was Scots pine (Pinus sylvestris) collected by Professor Ballie in December 1991. It grew on the western side of the Gary Bog, County Antrim and was designated Q7780. Each sample was a block of 40 rings, representing growth rings 74–113 of the 347-year tree. The sample conforms exactly to two of the bidecadal samples of oak used in the original high precision calibration (Pearson and Stuiver Reference Stuiver and Pearson1986). This sample was dendro-dated from 3200 BC to 3239 BC. The TIRI J timber was in the form of a large morticed baulk, lying just behind the outer palisade of Buiston Crannog near Kilmaurs, Ayrshire (NGR 4154 4351). Although no longer in situ, it resembled the mortice planks used to secure the stakes of the outer palisade and is interpreted here as having formed part of the latter. The sample was supplied by Dr B A Crone of AOC Archaeology.
FIRI D and F were identical to TIRI B. FIRI I was a second bulk Scots Pine sample from Garry Bog, supplied by Professor M Ballie. He supplied 16.3 kg of Scots Pine which had a finite 40-yr ring span, and again had the sample identification number Q7780. The dendro-dated age span was 3299–3257 BC. The FIRI H sample was provided by the Dr M Spurk of the University of Hohenheim comprising 9.6 kg of dendro-dated oak. The sample identification number was Pettstadt 262. The sample had 20 annual growth rings dating from 313 BC to 294 BC. FIRI L was a wood sample (part of a log) of approximately 10kg covering annual rings from the burial mound of Dogee Barrow, grave 8, (the Tuva king barrows from Scythia) was provided by Dr G Zaitseva of the Institute of the History of Material Culture. The material was excavated in 1998 and was very degraded. Its approximate age was 2300–2400 BP. FIRI K was oak (Quercus robur), obtained from Dr R Switsur of the Goodwin Institute for Quaternary Research. The tree was planted around AD 1722 and the material corresponding to the period AD 1820–1880 (a relatively flat area on the calibration curve) was removed to provide a sample of 10.4 kg.
VIRI L was again provided by Professor M Ballie. This sample is identified as Corlea Q5994. Samples M and N were provided by Professor G Cook, SUERC. Sample M is an oak sample and sample N is an alder and they come from a crannog site at Loch Tay, Scotland.
The SIRI samples F, G, and H were single ring samples again provided from the Queens University of Belfast. SIRI E is kauri and was provided by Professor A Hogg, Waikato University, New Zealand. It is a decadal sample and its code is Tawa YD Kauri wood rings 1251-60. SIRI I was provided by Professor I Panyushkina of the University of Arizona.
Wood and Cellulose Pretreatment
Whole Wood
Many of the samples came from dendrochronology laboratories and were simply cut into suitable sized fragments for distribution. For others, the samples were digested in 0.5M KOH at 80ºC, soaked in distilled water to remove excess alkali and then digested in hot 2M HCl. Finally, the wood was again soaked in distilled water to remove excess acid and dried to a constant weight in a vacuum oven.
Holo-Cellulose
The wood was either chopped into small pieces, or shavings were produced using a power plane. The material was then subjected to repeated digestion in 2M potassium hydroxide, washing, acidification and bleaching in sodium chlorite/hydrochloric acid solution. The fibrous extract was washed free of chlorite with distilled water, oven dried at 40ºC and thoroughly mixed by tumbling.
The Intercomparison Studies
A brief summary of the studies where wood and cellulose are used is given below (full details can be found in Scott et al. Reference Scott, Naysmith and Cook2018).
ICS (Harkness et al. Reference Harkness, Cook, Miller, Scott and Baxter1989; Scott et al. Reference Scott, Aitchison, Harkness, Baxter and Cook1989, Reference Scott, Aitchison, Harkness, Cook and Baxter1990, Reference Scott, Harkness, Cook, Aitchison and Baxter1991; Cook et al. Reference Cook, Harkness, Miller, Scott, Baxter and Aitchison1990): In this three-stage trial, one of the goals was the quantitative assessment of variability at different stages in the dating process. In Stage 2 we provided a cellulose sample (in duplicate) and in Stage 3, the 3 wood samples were provided (one in duplicate). All three samples had associated dendro-dates, and one was the contiguous 20 rings to the cellulose sample in stage 2. Following the ICS study, TIRI (the Third International Radiocarbon Inter-comparison) (Scott et al. Reference Scott, Harkness, Miller, Cook and Baxter1992; Scott Reference Scott2003) included one dendro-dated sample in addition to the IAEA cellulose (C4) and two other wood samples, one >30K. The next study in the sequence was FIRI (the Fourth International Radiocarbon Inter-comparison) which was completed in 2000. FIRI included an extensive set of wood samples (including background samples), and one sample that had been used in TIRI. The Fifth International Radiocarbon Inter-comparison (VIRI) commenced in 2004 and included cellulose, dendro-dated wood, background wood and several other wood samples. VIRI L spanned the 40 rings comprising ICS2 and ICS3 (Scott et al. Reference Scott, Cook and Naysmith2010) The most recently completed exercise is SIRI (the Sixth International Radiocarbon Inter-comparison), which commenced in 2013 and was completed in 2016, including 8 different wood samples, 3 of which were single dendro-dated rings from a 30-year sequence (Scott et al. Reference Scott, Naysmith and Cook2017).
Statistical Analysis
Our approach has been first to assess the distribution of results, identifying any outliers, before proceeding to evaluate laboratory performance (in terms of bias and error multipliers both internal and external) (Aitchison et al. Reference Aitchison, Scott, Harkness, Baxter and Cook1990) and to quantify the consensus value for each material (including uncertainty) (Scott et al. Reference Scott, Naysmith and Cook2018). In this paper, we also consider the chi-squared statistic to evaluate uncertainty relative to that expected given the quoted errors.
RESULTS AND DISCUSSION
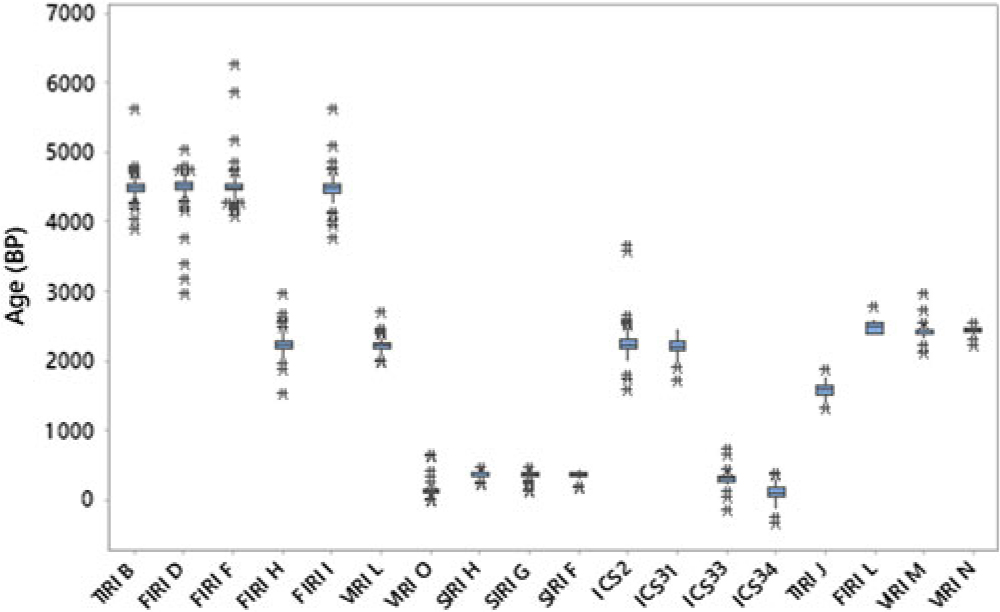
Table 1 presents the combined reference information for all wood samples including their codes and published consensus values. For those samples used in ICS and as optional in TIRI and FIRI, we have simply reported here the mean and standard error since typically there were insufficient numbers of results to confirm a consensus value. Figure 1 shows the boxplot of the distribution of results for all 20 wood and cellulose samples, spanning modern to 5000 BP approximately, excluding SIRI E and SIRI I at 10,000 BP.
Boxplot of the distribution of results for all wood and cellulose samples.

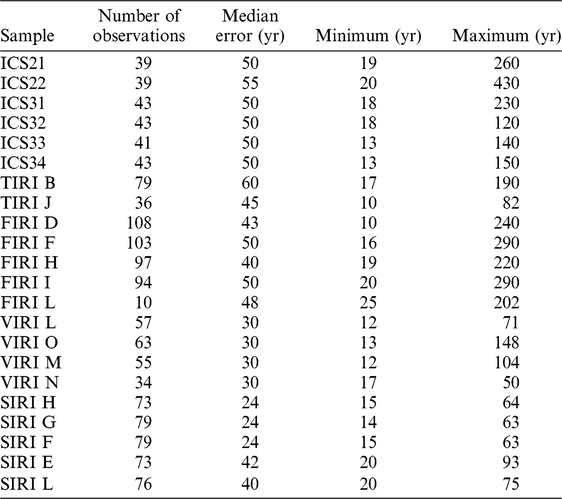
It is natural to consider as well as the reported ages, the uncertainty associated with each result and Table 2 shows basic summaries for the quoted errors. We can see a clear difference in the magnitude of the quoted errors from VIRI onwards, with generally decreasing uncertainties, (moderated of course by the age of the sample), though the minimum uncertainties remain unchanged.
Summary of quoted errors.

Specific Comparisons and Investigations
In this section, we focus on the dendro-dated samples, broken into the distinct time periods, and specifically using the linked samples, including ICS2 and ICS3 which cover the same span of rings as VIRI L, and TIRI B and FIRI D and F which are the same sample, and SIRI F,G and H which are single rings from a span of 32 years. We also consider the results in the context of IntCal13, evidencing the variability that is apparent across laboratories measuring the same material (both decadal blocks as well as single rings). We show three examples.
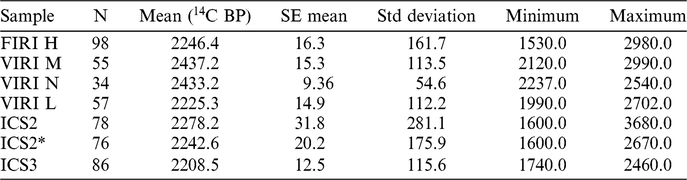
FIRI H, VIRI L, M and N, ICS2, and ICS3 (Period 350–220 BC)
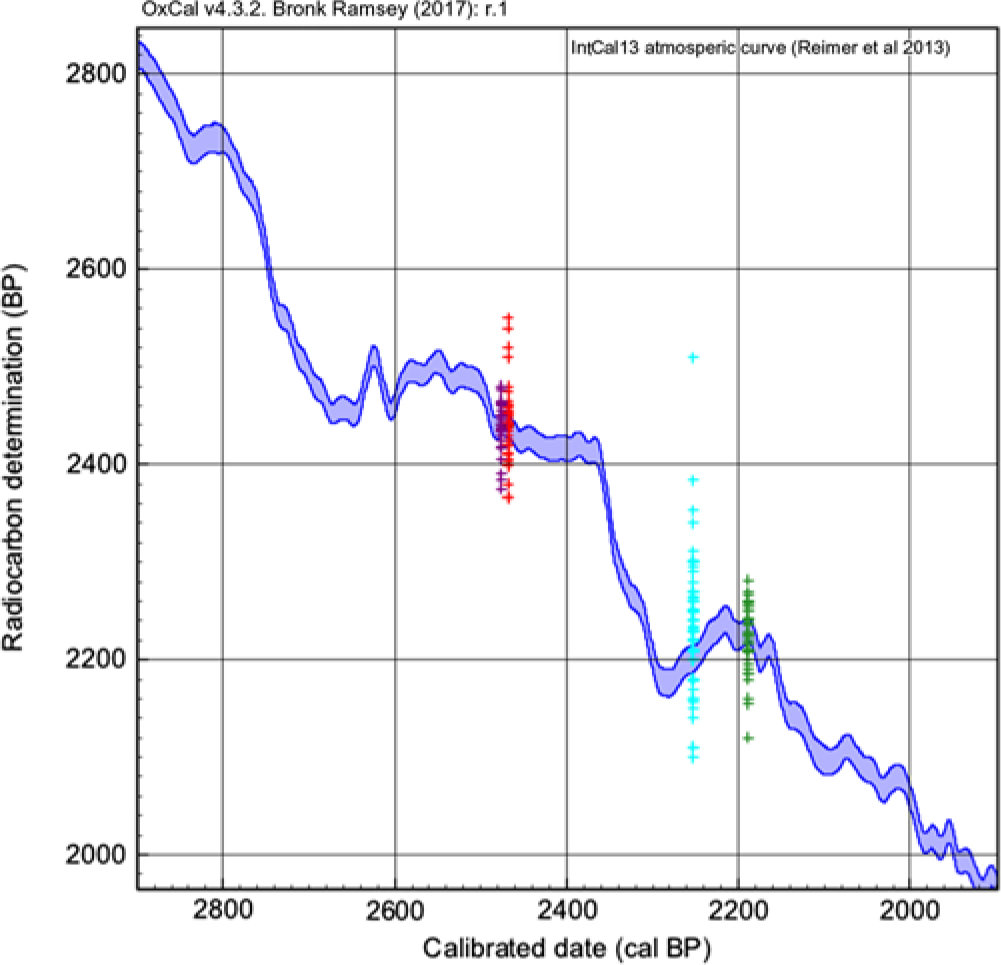
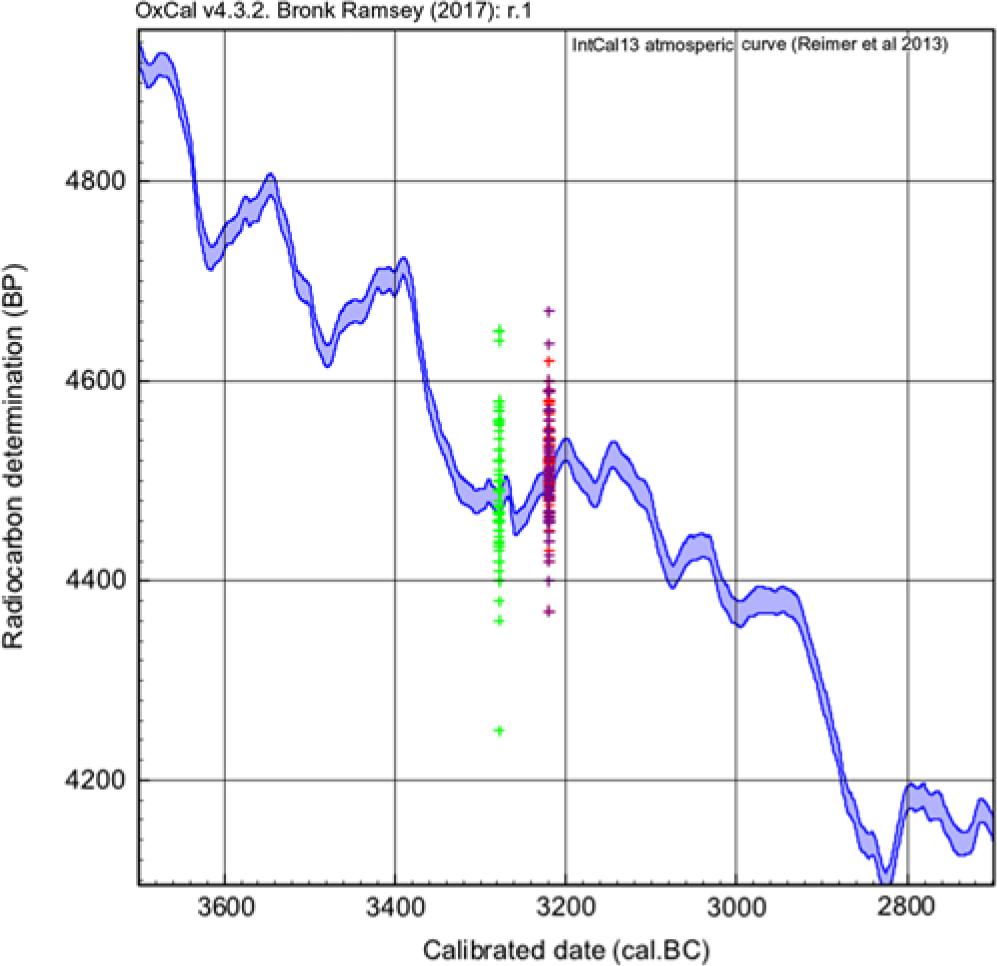
Table 3 shows the basic summaries for the 5 samples in this period, noting that VIRI L is a 40 ring block spanning the contiguous 20 rings blocks for ICS2 and ICS3. As expected, the mean VIRI L age lies within the ICS2 and ICS3 age range, VIRI L results are completely consistent with the ICS3 results in terms of scatter. Figure 2 shows FIRI H, VIRI L, M and N plotted on IntCal13 (Reimer et al. Reference Reimer, Bard, Bayliss, Beck, Blackwell, Bronk Ramsey, Buck, Cheng, Edwards, Friedrich, Grootes, Guilderson, Haflidason, Hajdas, Hatteé, Heaton, Hoffmann, Hogg, Hughen, Kaiser, Kromer, Manning, Niu, Reimer, Richards, Scott, Southon, Staff, Turney and van der Plicht2013).
IntCal13 (1 standard deviation envelope) and intercomparison sample scatter.

Summary for samples in period 350–220 BC.

* Two values removed as outliers, one pair of duplicates.
From Figure 2, the results are distributed well around the calibration curve, but we can see the wide dispersal of dates beyond the curve uncertainty (1 sigma) band but with the bulk of the measurements lying within the band. (Note ICS2 and 3 are not plotted on the curve.)
Period 3239–3200 BC
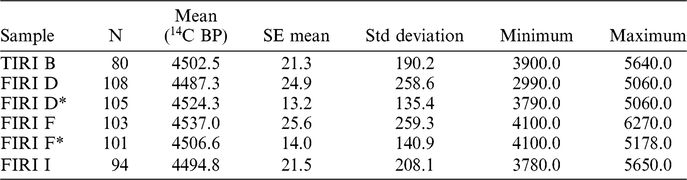
Table 4 shows the basic summaries for the 4 samples in this period, noting that TIRI B and FIRI D and F are identical 40 ring blocks. Figure 3 shows the results plotted on IntCal13 (note TIRI B not shown). There is considerable variability evident in the FIRI results, however with the removal of 2 outliers in each set, the variation (standard deviations) for FIRI D and FIRI F are lower than for TIRI B.
IntCal13 curve and (1 standard deviation envelope) and intercomparison sample scatter.

Summary for samples in period 3239–3200 BC.

* Rows represent results for FIRI D and FIRI F after removal of 2 outliers.
From Figure 3, similar features are observed, with results distributed well around the calibration curve, but we can see the wide dispersal of dates beyond the curve uncertainty (1 sigma) band.
Wood 1475–1180 AD, samples VIRI O, SIRI F, G, and H
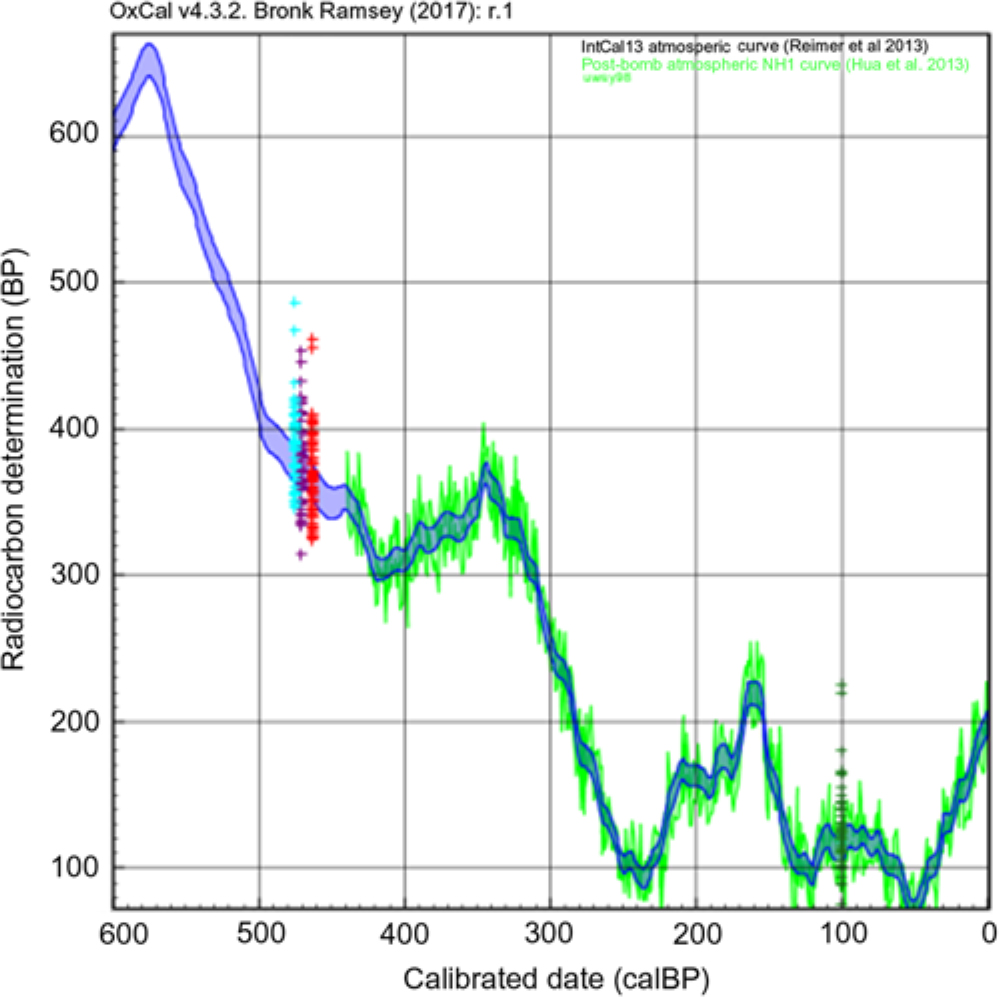
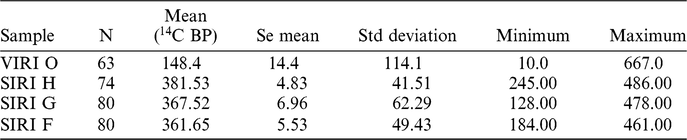
Table 5 shows the basic summaries for the 4 samples in this period, noting that the SIRI samples are single rings while VIRI O spans 60 rings. Figure 4 shows VIRI O, SIRI F, G, and H plotted on IntCal13. From Figure 4, similar features are observed as in Figures 2 and 3, with results distributed well around the calibration curve, but we can see the wide dispersal of dates beyond the curve uncertainty band. While some of this scatter must be due to the spread in age (20- or 40-ring blocks), there is evidence of a reduction in this scatter when we consider the 3 single-ring samples, the standard deviation of results is reduced by approximately 2.
IntCal13 (1 standard deviation envelope), single year 14C data set (Stuiver et al. Reference Stuiver, Reimer and Braziunas1998) and SIRI sample scatter, where the green curve is the University of Washington 1998 single year 14C dataset (Stuiver et al. Reference Stuiver, Reimer and Braziunas1998). Figure from OxCal v4.3.2 (see Bronk Ramsey Reference Bronk2009).

Summary for samples in period 1475–1180 AD.

Excess Variation
Traditionally, evaluation of z-scores, is a standard approach to evaluate the performance relative to the consensus value estimated using the same procedure as described in (Scott et al. Reference Scott, Naysmith and Cook2018), but of particular interest in this context is the variability in the results and checking of the measurement uncertainties, so in this context we use a zeta score and evaluate the reduced chi-squared statistic. The zeta score is defined below and is interpreted similar to the z-score where. xm, the reported result, xA, the assigned or true value for the material, σp, the target value for standard deviation and in addition σa is the uncertainty on the consensus value.
 $${\rm{zeta - score = (}}{{\rm{x}}_{\rm{m}}}{\rm{-}}{{\rm{x}}_{\rm{A}}}{\rm{)/}}\sqrt {{\rm{(}}\sigma _{\rm{p}}^2{\rm{ + }}\sigma _{\rm{a}}^2{\rm{)}}}$$
The target value for the standard deviation is sometimes called the “standard deviation for proficiency testing” is sometimes taken as the standard uncertainty that is regarded as optimal for the application purpose (Analytical Methods Committee, AMCTB No. 74 2016).
Interpretation of the zeta-scores is similar to z-scores as
|zeta-score|≤ 2 result is considered satisfactory
2< |zeta-score|<3 warning, evaluate the result
|zeta-score|≥ 3 action, this result is anomalous
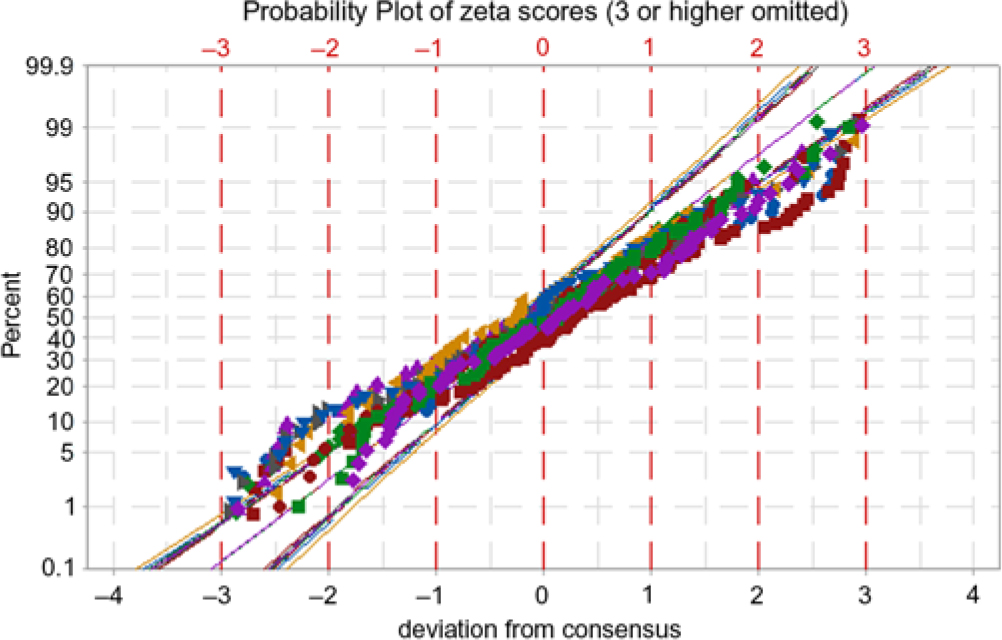
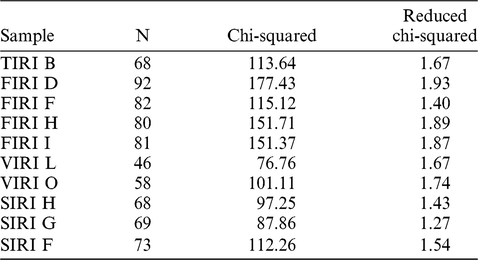
It is also common to evaluate a reduced χ2 (sometimes also called the MWSD). The reduced χ2 is the χ2 divided by n–1 (where n is the number of observations used in the calculation of the consensus value). We compare the reduced χ2 value to 1, values greater than 1 would indicate over dispersion in the results around the consensus value. Figure 5 shows the zeta-scores (which include the uncertainty on the consensus value) in a probability plot (to check linearity) which shows some evidence of measurement uncertainty being under-estimated (given the deviations from linearity in the tails).
Probability plot of deviations from consensus (each color represents a different sample).

This is further quantified in the reduced chi-squared values in Table 6 which are all larger than 1 (but less than 2) only after we remove those results which have zeta scores greater than 3. The numbers of observations that are removed are generally quite small (around 10–12 or approx. 10% of the data sets), this is entirely consistent with the small number of outliers that are apparent when the individual sample results are assessed. Nonetheless, this does provide direct evidence that there remains some excess scatter in the results above what would be expected given the laboratory quoted errors. Our results suggest that the variability in the tree-ring results is a function of number of rings, with evidence from the reduced chi-squared statistics, that single tree ring results show reduced variability compared to the tree ring blocks (a reduction of the order of 20%). With regard to the IntCal program of work, our results include many more laboratories than would necessarily contribute to the master calibration data sets. They do however suggest that the 1 standard deviation envelopes for the curves are too narrow, in each of the time periods we have studied.
Reduced chi-squared values.

Laboratory Benefits of a Well-Characterized Reference Value
While intercomparisons are only snap shots in time, one significant benefit from a well designed study using appropriate materials (available in sufficient quantities) is to allow individual laboratories in the future to use well characterized materials as routine reference materials or secondary standards. The FIRI I pine sample is one such reference material which was used in the SUERC laboratory from 2003 until 2009. This was a large wood sample that was power planned to produce wood shavings, and cellulose produced. The cellulose samples were combusted using quartz tubes and two graphite targets were produced from each gas (single combustions). The two targets were then run on random graphite units. In SUERC, the batches of samples are notionally divided into 13 groups of 10 samples, with each group having 3 standards (one Oxalic Acid II primary standard, one Belfast cellulose secondary standard and either a barley mash or a background standard) and 7 Unknowns. Once the data has been reduced, the average and standard deviation are calculated for the Belfast cellulose, the standard deviation on these values are used to determine the minimum error reported for each batch (Dunbar et al. Reference Dunbar, Cook, Naysmith, Tripney and Xu2016). Table 7 shows the summary of results for 7 years this system was operated as well as the FIRI I intercomparison result. The table shows the within laboratory variability in the sample (where more than 1000 measurements of the sample were made).
SUERC summary results for FIRI I.

CONCLUSIONS
The series of wood samples used in the intercomparisons span a broad range of ages and include some samples that have been pretreated before distribution. We have designed the intercomparisons to include linked samples over time, as well as duplicates both of wood and holo-cellulose. The results provide evidence of the total variability from the potential sources—variation in the samples themselves and differences between laboratories. Such investigations inform on the robustness and repeatability of complex measurements. Importantly, with dendro-dated samples, it is also possible to inform the variability needed when statistically modeling the global calibration curves.
ACKNOWLEDGMENTS
The series of wood intercomparisons would not have been possible without the gracious provision of the samples by many colleagues nor the funding provided by a number of sources including UK research councils (EPSRC and NERC), EU (FP4), NATO, Historic England and Historic Environment Scotland. Finally, a huge thanks to the participating laboratories that have contributed several thousand 14C age measurements over the years.