Introduction
Mild cognitive impairment (MCI), a high risk condition for dementia, is regarded as a transitional state between cognitively normal (CN) and dementia (Petersen, Reference Petersen2011). However, some MCI patients do not experience worsening, and they fairly commonly revert back to CN (Larrieu et al., Reference Larrieu2002; Fisk et al., Reference Fisk, Merry and Rockwood2003; Ganguli et al., Reference Ganguli, Dodge, Shen and DeKosky2004; Reference Ganguli2011; de Jager and Budge, Reference de Jager and Budge2005; Busse et al., Reference Busse, Hensel, Guhne, Angermeyer and Riedel-Heller2006; Tyas et al., Reference Tyas2007; Mitchell and Shiri-Feshki, Reference Mitchell and Shiri-Feshki2009; Gallassi et al., Reference Gallassi2010; Nordlund et al., Reference Nordlund, Rolstad, Klang, Edman, Hansen and Wallin2010; Olazaran et al., Reference Olazaran2011; Han et al., Reference Han2012; Koepsell and Monsell, Reference Koepsell and Monsell2012; Roberts et al., Reference Roberts2014). Prevalence of MCI reversion to CN has varied widely, ranging from 4 to 55% (Larrieu et al., Reference Larrieu2002; Fisk et al., Reference Fisk, Merry and Rockwood2003; Ganguli et al., Reference Ganguli, Dodge, Shen and DeKosky2004; Reference Gallassi2010; de Jager and Budge, Reference de Jager and Budge2005; Busse et al., Reference Busse, Hensel, Guhne, Angermeyer and Riedel-Heller2006; Tyas et al., Reference Tyas2007; Mitchell and Shiri-Feshki, Reference Mitchell and Shiri-Feshki2009; Gallassi et al., Reference Gallassi2010; Nordlund et al., Reference Nordlund, Rolstad, Klang, Edman, Hansen and Wallin2010; Olazaran et al., Reference Olazaran2011; Koepsell and Monsell, Reference Koepsell and Monsell2012; Roberts et al., Reference Roberts2014). These diverse results might depend on the heterogeneity of MCI itself, study setting, study duration, or diagnostic aspects (Ganguli et al., Reference Ganguli, Dodge, Shen and DeKosky2004; Edmonds et al., Reference Edmonds2014; Roberts et al., Reference Roberts2014). In spite of these findings, their importance and the details of their reversion to CN were highly controversial.
There have been several hypothesis of the MCI reversion to CN. It was reported that the patients who do revert from MCI to CN may experience only a temporal remission of cognitive impairment. This was referred to as “yo-yoing” between normal cognitive performance and MCI (Zonderman and Dore, Reference Zonderman and Dore2014). Another study reported that progression from CN to MCI or from CN to MCI to dementia was not always linear; these progressions came to be known as “unstable” courses (Lopez et al., Reference Lopez2012). It was reported that 20% of incident MCI cases appeared to follow an unstable course. It has also suggested that the diagnosis of MCI is unreliable (Lezak et al., Reference Lezak, Howieson, Bigler and Tranel2012) and the conventional diagnosis of MCI may be highly susceptible to false-positive diagnostic errors (Edmonds et al., Reference Edmonds2014), which is consistent with previous reports of high reversion rates or lack of progression in those having MCI.
Alzheimer's disease (AD) biomarkers have been employed to provide evidence of ongoing pathophysiological processes of AD, and these techniques have also made it possible to make a pre-dementia diagnosis of AD (Rosen et al., Reference Rosen, Hansson, Blennow and Zetterberg2013). The temporal dynamics of biomarker levels in relation to changes in cognition have been described in a hypothetical model using a biomarker-based continuum of AD (Jack et al., Reference Jack2010). There have been few studies on MCI reversion with AD biomarkers, including genetic, cerebrospinal fluid (CSF), imaging, and neuropsychological biomarkers. We assessed whether the patients who revert from MCI to CN or have the yo-yoing phenomenon of cognition have different profiles of clinical characteristics or AD biomarkers in the Alzheimer's Disease Neuroimaging Initiative (ADNI) cohort.
Methods
Participants
Data used in the preparation of this paper were obtained from the ADNI database (adni.loni.usc.edu). The ADNI was launched in 2003 by the National Institute on Aging (NIA), the National Institute of Biomedical Imaging and Bioengineering (NIBIB), the Food and Drug Administration (FDA), private pharmaceutical companies, and non-profit organizations as a $60 million, five-year public–private partnership. The primary goal of ADNI has been to test whether serial magnetic resonance imaging (MRI), positron emission tomography (PET), other biological markers, and clinical and neuropsychological assessment can be combined to measure the progression of MCI and early AD. Determination of sensitive and specific markers of very early AD progression is intended to aid researchers and clinicians to develop new treatments and monitor their effectiveness as well as lessen the time and cost of clinical trials.
The principal investigator of this initiative is Michael W. Weiner, MD, VA Medical Center and University of California – San Francisco, California. ADNI is the result of efforts of many co-investigators from a broad range of academic institutions and private corporations, and participants have been recruited from over 50 sites across the United States and Canada. The initial goal of ADNI was to recruit 800 participants but ADNI has been followed by ADNI-GO and ADNI-2. To date these three protocols have recruited over 1,500 adults, aged 55 to 90 years, to participate in the research and comprises cognitively normal older individuals, people with early or late MCI, and people with early AD. The follow-up duration of each group is specified in the protocols for ADNI-1, ADNI-2, and ADNI-GO. Participants originally recruited for ADNI-1 and ADNI-GO had the option to be followed in ADNI-2. For up-to-date information, see www.adni-info.org.
Classification of subgroups
We selected the study participants from the ADNI participants: 820 diagnosed as MCI at their initial evaluation based on ADNI diagnostic criteria (Petersen et al., Reference Petersen2010) and 413 classified as CN. Detailed diagnostic, inclusion, and exclusion criteria are described on the ADNI website (ADNI, 2013a). Criteria for MCI were (1) subjective memory complaint reported by participant or study partner; (2) Mini-Mental State Examination (MMSE) scores between 24 and 30 (inclusive); (3) global Clinical Dementia Rating (CDR) score of 0.5; (4) abnormal memory function documented by scoring below education-adjusted cutoffs for delayed free recall on story A of the Wechsler Memory Scale-Revised (WMS-R) Logical Memory II subtest; and (5) general cognition and functional performance sufficiently preserved to an extent that one could not qualify for a diagnosis of AD. Criteria for CN were (1) MMSE scores between 24 and 30 (inclusive); (2) global CDR of 0; (3) non-depressed; (4) non-MCI; and (5) without dementia. The age range of CN was roughly matched with that of MCI and AD patients.
Among the participants with MCI, 779 MCI patients were classified as “amnestic MCI” and 38 were classified as “non-amnestic MCI” by ADNI. We in addition classified as “MCI reverters (MCIr)” if they reverted back to CN based on ADNI diagnostic criteria at any point during the follow-up period. Thus, the final categories of participants included 413 CN, 42 MCIr, and 778 MCI without reversion (MCI).
Demographic data and AD biomarkers
Baseline data of demographics and AD biomarkers were downloaded from the ADNI clinical data repository (ADNI, 2013b). We assessed the following demographic data: age, gender, level of education, marital status, length of evaluation period, diagnosis throughout the evaluation period, MCI type, and medication use. We evaluated the following AD biomarkers to adapt the hypothetical model of AD continuum (Jack et al., Reference Jack2010): CSF amyloid-β 1 to 42 peptide (Aβ42), CSF total tau (t-tau), CSF tau phosphorylated at the threonine 181 position (p-tau181p), fluorodeoxyglucose 18F uptake on brain PET (FDG-PET), [11C] Pittsburgh Compound-B PET (11C-PiB PET), brain structural MRI, and neuropsychological data. We used the average FDG-PET data on angular, temporal, and posterior cingulate, of which glucose metabolism normalized to pons and the average 11C-PiB standard uptake volume ratio of the frontal cortex, anterior cingulate, precuneus cortex, and parietal cortex. The volume of the hippocampus on MRI was used to evaluate the brain structure, which was correlated with AD histopathology and structural atrophy of AD-related neurodegeneration. For the neuropsychological assessments, we evaluated participants’ performance on MMSE, CDR-Sum of Boxes (CDR-SB), cognitive subscale of the Alzheimer's Disease Assessment Scale (ADAS-Cog; the standard ADAS-Cog scale includes 11 items: ADAS 11; the modified version of ADAS-Cog scale includes delayed word recall and number cancellation: ADAS 13), Rey Auditory Verbal Learning Test (RAVLT; Immediate, Learning, Forgetting, Percentage Forgetting), and Functional Activities Questionnaire (FAQ). In addition, APOE ε4 carrier status (ε4+ vs. ε4−) was evaluated as a genetic biomarker, white matter hyperintensities were evaluated as burden of small-vessel cerebrovascular changes and medication use of the cholinesterase inhibitors (ChEIs) included donepezil, rivastigmine, and galantamine, and the N-methyl-D-aspartate partial receptor agonist memantine was evaluated.
Since MCIr and CN had no 11C-PiB PET scan at the time of their ADNI baseline assessments, the 11C-PiB PET data analyzed here were acquired at the twelve-month follow-up assessments. There were various missing data for each of the AD biomarkers (Table 1).
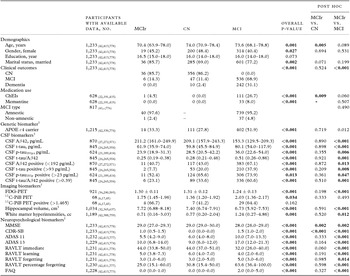
Baseline demographics and AD biomarkers

Notes: Data are expressed as median (interquartile range), mean ± SD, or frequency (percentage) except the number of participants is expressed as total (MCIr, CN, and MCI, in subscript).
Demographics, clinical outcomes, medication use, and MCI type were assessed by χ 2 test for categorical variables and the Kruskal–Wallis test for continuous variables. In post hoc analysis, Bonferroni-corrected p-values are shown after controlling for multiple comparisons.
†Genetic, CSF, imaging, and neuropsychological biomarkers were assessed by the analysis-of-covariance (ANCOVA) model or binary logistic regression after adjustment for age, gender, and marital status. (p < 0.05, in bold).
Abbreviations. MCIr: mild cognitive impairment reverter; CN: cognitively normal; MCI: mild cognitive impairment; APOE: apolipoprotein E; CSF: cerebrospinal fluid; Aβ42: amyloid-beta 1 to 42 peptide; t-tau: total tau; p-tau181p: tau phosphorylated at the threonine 181 position; FDG-PET: fluorodeoxyglucose 18F uptake on brain positron emission tomography; 11C-PiB PET: [11C] Pittsburgh Compound-B PET; ADAS 11: the standard Alzheimer's Disease Assessment Scale – cognitive subscale includes 11 items; ADAS 13: the modified version of Alzheimer's Disease Assessment Scale – cognitive subscale includes delayed word recall and number cancellation; FAQ: Functional Activities Questionnaire.
Statistical analyses
Categorical variables were represented as frequency (percentage). Continuous variables were represented as mean values ± SD for normally distributed data and as medians (interquartile ranges) for non-normally distributed data. Dichotomous measures were defined as positive with commonly used cut-offs obtained from samples other than these ADNI participants (<192 pg/mL for Aβ42, >93 pg/mL for t-tau, >23 pg/mL for p-tau181p, >0.39 for t-tau/Aβ42, and >1.465 for 11C-PiB PET) (Mormino et al., Reference Mormino2009; Shaw et al., Reference Shaw2009). In demographics, categorical variables were conducted with statistical difference using χ 2 tests and continuous variables were conducted with statistical difference using non-parametric analysis of variance (Kruskal–Wallis) after checking normal distribution (Kolmogorov–Smirnov test) and/or equality of variances (Levene's test). Post hoc pairwise comparisons were conducted after Bonferroni correction. CSF, imaging, and neuropsychological biomarkers were assessed by the analysis-of-covariance (ANCOVA) model for continuous variables or the binary logistic regression for dichotomous variables after adjusting for covariates those variables that had statistically different distributions in demographics. All reported p-values are based on two-sided tests. Statistical significance was set at p < 0.05 unless otherwise noted. All statistical analyses were performed using SPSS for Windows, version 20.0 (IBM Corp., Armonk, NY, USA).
Results
The study consisted of 1,233 participants (median age, 73.6 years; 43.2% females; median level of educational, 16.0 years; 74.8% married; median follow-up, 23.93 months). The demographic characteristics in each category were slightly different in age, gender, and marital status (Table 1). Since this study focused on MCIr, post hoc test was shown between MCIr and the other groups in Table 1. Only age (z = −3.132, p = 0.005) of MCIr was different from those of CN in demographics. Between MCIr and MCI, there was no statistical difference in use of medication (ChEIs and memantine), and in MCI type (amnestic or non-amnestic; Table 1).
The last follow-up periods were 24.59 (16.79–45.71) months for MCIr, 24.26 (12.13–71.70) months for CN, and 23.87 (12.03–36.26) months for MCI. Post hoc analysis for the last follow-up periods showed no statistical difference among three groups (all p-values > 0.05).
For clinical outcomes, diagnosis on last evaluation was assessed. Of the 42 MCIr, 36 (85.7%) were continuously diagnosed as CN (MCIrCN) and 6 (14.3%) had regressed back to MCI (MCIrMCI). Of the 352 CN, 10 (2.4%) had progressed to dementia and 47 (11.4%) had progressed to MCI. Of the 778 MCI, 242 (31.1%) had progressed to dementia.
Genetic, CSF, imaging, and neuropsychological biomarkers were also assessed (Table 1). Overall distribution of these biomarkers was statistically different except 11C-PiB PET positive. Post hoc analysis showed that these biomarkers in MCIr were statistically different from those in MCI, and those in MCIr were not statistically different from the ones in MCI except MMSE and CDR-SB.
Between MCIrCN and MCIrMCI, there was no difference in age (68.15 (63.73–78.88) for MCIrCN vs. 71.35 (68.93–76.90) for MCIrMCI), female gender (16 (44.4%) vs. 3 (50.0%)), education (16.5 (15.0–18.0) vs. 17.0 (14.8–18.5)), MCI amnestic type (34 (97.1%) vs. 6 (100.0%)), APOE ε4 carrier (13 (36.1%) vs. 1 (16.7%)), FDG-PET (1.31 ± 0.10 vs. 1.23 ± 0.11), hippocampal volume (7.60 ± 0.72 vs. 7.41 ± 1.17), white matter hyperintensities (0.71 (0.18–2.18) vs. 0.66 (0.35–2.16)), MMSE (29.0 (27.0–29.0) vs. 29.0 (26.8–30.0)), CDR-SB (0.75 (0.50–1.50) vs. 1.25 (0.88–1.75)), ADAS 11 (6.62 ± 3.12 vs. 5.56 ± 2.39), ADAS 13 (10.51 ± 4.55 vs. 8.89 ± 4.49), RAVLT immediate (41.50 ± 9.71 vs. 49.33 ± 18.45), RAVLT learning (5.28 ± 2.73 vs. 6.00 ± 2.90), RAVLT forgetting (4.00 ± 2.96 vs. 1.83 ± 2.32), RAVLT percentage forgetting (25.83 (17.05–60.00) vs. 7.14 (0.00–43.93)) and FAQ (0.00 (0.00–1.00) vs. 0.00 (0.00–1.25)) (all, p-values > 0.05). Since there were too small numbers of MCIrMCI with CSF biomarkers (n = 3), medication use (n = 2), and 11C-PiB PET (n = 0), these biomarkers were not compared statistically between MCIrCN and MCIrMCI.
Discussion
This study provided a comprehensive evaluation of the MCIr with ADNI data, including genetic, CSF, imaging, and neuropsychological biomarkers. This study showed that the differences between MCIr and CN were only age, MMSE, and CDR-SB, but the differences between MCIr and MCI were not only clinical outcomes but also genetic, CSF, imaging, and neuropsychological biomarkers. Overall, MCIr may be similar to CN and not MCI in clinical characteristics.
For MCI reversion, several possible factors could be considered. A previous study has reported a patient who was unmarried, had an APOE ε4 allele, worse functional measures, poor cognitive function and amnestic MCI, and multiple-domain MCI was less likely to revert to CN (Roberts et al., Reference Roberts2014). Another study reported the number of impaired cognitive domains but not the presence of memory impairment associated with MCI reversion (Han et al., Reference Han2012). Still another study reported that patient who was younger, had more recent symptom onset, did not have clinician-reported declines in memory, judgment, or problem-solving, did not self-report memory decline, and did not have an APOE ε4 allele was more likely to revert to CN (Koepsell and Monsell, Reference Koepsell and Monsell2012). This study showed that MCIr has clinical similarity to CN. All of these have commonly suggested that better clinical condition or better performance was associated with MCI reversion.
For the diagnosis of MCI, recent criteria, as continuum of AD, had proposed core clinical criteria with clinical and cognitive evaluation, and research criteria incorporating biomarkers (Albert et al., Reference Albert2011). It was suggested that biomarkers reflecting Aβ and neuronal injury may be used to provide increasing levels of certainty for the diagnosis of MCI as prodromal AD. It is already known that the patients with MCI who have biomarker evidence of AD are more likely to decline than those who lack abnormal biomarkers, and the patients with MCI who have no abnormal biomarkers had a favorable prognosis (Albert et al., Reference Albert2011). It was also suggested that patient with preclinical AD, who was cognitively normal with biomarker evidence of brain amyloid deposition, was at high risk of AD (Sperling et al., Reference Sperling2011). This research recommendation, using biomarkers, has been widely accepted (Albert et al., Reference Albert2011). However, most previous studies on MCI reversion had evaluated clinical criteria with neuropsychological data only (Larrieu et al., Reference Larrieu2002; Fisk et al., Reference Fisk, Merry and Rockwood2003; de Jager and Budge, Reference de Jager and Budge2005; Busse et al., Reference Busse, Hensel, Guhne, Angermeyer and Riedel-Heller2006; Gallassi et al., Reference Gallassi2010; Ganguli et al., Reference Ganguli2011; Olazaran et al., Reference Olazaran2011) or with the frequency of APOE ε4 allele and neuropsychological data only (Ganguli et al., Reference Ganguli, Dodge, Shen and DeKosky2004; Tyas et al., Reference Tyas2007; Han et al., Reference Han2012; Koepsell and Monsell, Reference Koepsell and Monsell2012; Roberts et al., Reference Roberts2014). This study compared AD biomarkers, including genetic, CSF, imaging, and neuropsychological data, between MCIr and others. Especially CSF Aβ42, CSF t-tau, FDG-PET, and 11C-PiB PET in MCIr, which became abnormal earlier in an hypothetical model of dynamic AD biomarkers (Sperling et al., Reference Sperling2011) were similar to those of CN in this study. The results in this study suggested that the clinical properties of MCIr were similar to those of CN.
Similar patterns were also observed in clinical outcomes of MCIr. Previous studies had suggested that diagnosis of MCI at any time is eventually associated with dementia (Zonderman and Dore, Reference Zonderman and Dore2014) because MCIr had a high risk of progression to dementia at the end (Koepsell and Monsell, Reference Koepsell and Monsell2012; Roberts et al., Reference Roberts2014). However, these previous studies evaluated only patients with MCI and MCIr (Koepsell and Monsell, Reference Koepsell and Monsell2012), or MCIr had a relatively higher risk of progression to dementia than CN although MCIr had a relatively lower risk of progression to dementia than MCI (Roberts et al., Reference Roberts2014). If the participants of these previous studies could be further classified according to biomarkers of Aβ deposition and neuronal injury, then comparison between patients having a favorable prognosis and those having a worse prognosis would be more helpful to understand MCI reversion. In this study, MCIr had similar clinical outcomes of CN and a favorable prognosis compared with MCI.
For neuropsychological measures, this study showed no statistical difference in most of the neuropsychological data between MCIr and CN. The MMSE and CDR-SB scores were different between MCIr and CN. However, it was well known that MMSE had ceiling effects and lacked sensitivity to detect subclinical conditions (Klekociuk et al., Reference Klekociuk, Summers, Vickers and Summers2014). This study showed that the differences in the MMSE score were less than 1.0 between MCIr and the other two groups. Although there was a statistical difference in MMSE between MCIr and CN, we thought these differences were difficult to apply in clinical practice. The distribution of CDR-SB score had the differences like MMSE in this study. However, these differences could be due to different inclusion criteria of CDR among three groups in ADNI. The other comprehensive neuropsychological measures showed no statistical difference between MCIr and CN.
Together with the results of biomarker profiles and clinical outcomes, there was no difference between MCIr and CN. In other words, the possibility of false-positive error in MCIr cannot be excluded. If MCI is degenerative in prognosis, then recovery of function in individuals identified with MCI is diagnostically erroneous (Klekociuk et al., Reference Klekociuk, Summers, Vickers and Summers2014). Thus, these results suggested that MCIr has similarity of CN in clinical and biomarker profiles, or MCIr, at least in our study, may have come from false-positive error. Especially, it was suggested that the conventional diagnosis of MCI may be highly susceptible to false-positive diagnostic errors (Edmonds et al., Reference Edmonds2014; Klekociuk et al., Reference Klekociuk, Summers, Vickers and Summers2014). It was suggested that comprehensive neuropsychological measures could improve the specificity of diagnosis of MCI (Klekociuk et al., Reference Klekociuk, Summers, Vickers and Summers2014) and a significant proportion of MCI ADNI participants can be classified into normal group by cluster analysis with neuropsychological data (Edmonds et al., Reference Edmonds2014). It was reported that the original ADNI diagnosis of MCI was considered accurate, but the conventional criteria are susceptible to false-positive errors (Edmonds et al., Reference Edmonds2014).
This study has several limitations. First, as suggested in a previous study (Edmonds et al., Reference Edmonds2014) with ADNI data, conventional criteria in ADNI relies on a single cognitive measure and some crude rating scale may be susceptible to false-positive errors. It was known that misdiagnosis can occur as a consequence of interpreting one or few neuropsychological scores below expectations as pathological when within-person variability is common and does not necessarily signify the presence of MCI (Lezak et al., Reference Lezak, Howieson, Bigler and Tranel2012). Second, the follow-up duration was relatively short (median < 2 years) and the sample size of MCIr patients was small (n = 42), which may limit the generalizability of our observations. However, most similar, previous studies also included relatively small numbers of MCIr patients. A more broadly representative sample of MCIr patients might be helpful to better determine whether these findings are generalizable. Third, the large amount of missing data for various AD biomarkers precluded more detailed analysis of the role of AD biomarkers in MCIr. If there are additional neuropathological data, it could allow a clinician's judgment on the suspected underlying cause of MCI. More information on comorbidities, such as cerebrovascular disease, hypertension, diabetes, obesity, dyslipidemia, or metabolic syndrome, which are linked to the development of AD (Reitz et al., Reference Reitz, Brayne and Mayeux2011), would help assess the properties of MCI.
In conclusion, this study showed that the AD biomarker profiles and clinical outcomes of MCIr were more similar to those of CN than of MCI. With assessment of MCI reversion to CN, the possibilities of false-positive errors or non-AD pathology should be considered. With the assistance of AD biomarkers, MCI can be evaluated more accurately than the conventional criteria.
Conflict of interest
None.
Description of authors’ roles
All authors made substantial contributions to the conception and design of the study and analysis and interpretation of data. Dr. Park contributed to drafting the paper. All authors contributed to revising it critically for intellectual content. All authors approved the final version of the manuscript.
Acknowledgments
Data collection and sharing for this project was funded by the Alzheimer's Disease Neuroimaging Initiative (ADNI; adni.loni.usc.edu) (National Institutes of Health Grant U01 AG024904). As such, the investigators within the ADNI contributed to the design and implementation of ADNI and/or provided data but did not participate in analysis or writing of this paper. A complete listing of ADNI investigators can be found at: http://adni.loni.usc.edu/wp-content/uploads/how_to_apply/ADNI_Acknowledgement_List.pdf. ADNI is funded by the National Institute on Aging, the National Institute of Biomedical Imaging and Bioengineering, and through generous contributions from the following: Alzheimer's Association; Alzheimer's Drug Discovery Foundation; BioClinica, Inc.; Biogen Idec Inc.; Bristol-Myers Squibb Company; Eisai Inc.; Elan Pharmaceuticals, Inc.; Eli Lilly and Company; F. Hoffmann-La Roche Ltd and its affiliated company Genentech, Inc.; GE Healthcare; Innogenetics, N.V.; IXICO Ltd.; Janssen Alzheimer Immunotherapy Research & Development, LLC.; Johnson & Johnson Pharmaceutical Research & Development LLC.; Medpace, Inc.; Merck & Co., Inc.; Meso Scale Diagnostics, LLC.; NeuroRx Research; Novartis Pharmaceuticals Corporation; Pfizer Inc.; Piramal Imaging; Servier; Synarc Inc.; and Takeda Pharmaceutical Company. The Canadian Institutes of Health Research is providing funds to support ADNI clinical sites in Canada. Private sector contributions are facilitated by the Foundation for the National Institutes of Health (www.fnih.org). The grantee organization is the Northern California Institute for Research and Education, and the study is coordinated by the Alzheimer's Disease Cooperative Study at the University of California, San Diego. ADNI data are disseminated by the Laboratory for Neuro Imaging at the University of California, Los Angeles. This research was also supported by NIH grants P30 AG010129 and K01 AG030514. This study was supported by the grant of Korea University (K1325571).