Introduction
In Ireland, suckler male beef production systems were dominated by steers, which were usually slaughtered at 24 months of age or greater (Bord Bia, 2011). Recently, however, the proportion of bulls in suckler male beef production has increased because, when compared with steers reared similarly, bulls have better feed conversion efficiency and may be slaughtered at a younger age.
Although it is economically attractive to include a period of grazed grass in the diet of suckler bulls, suckler bulls may also need to be reared intensively on a high-energy diet to meet some market requirements in terms of age at slaughter, carcass weight (CW) and fat cover (Dransfield et al., Reference Dransfield, Martin, Bauchart, Abouelkaram, Lepetit, Culioli, Jurie and Picard2003; Bord Bia, 2011). For instance, in the United Kingdom, which is a major market for Irish beef, beef from younger bulls (<16 months of age) is preferred by customers, based on a perception of superior meat quality of younger compared with older bulls, whereas in continental markets beef from bulls aged up to 20 months is accepted (Bord Bia, 2011).
As the age at which bulls are slaughtered is of interest specifically with regard to beef tenderness (Bord Bia, 2011) and as there is insufficient information available on the effects of age and its associated CW on the eating quality of beef from younger bulls (<18 months of age), this study was aimed at determining the effect of age/CW on carcass traits and compositional and sensory characteristics of beef from suckler bulls finished on a high-energy concentrate diet.
Material and methods
Animals and management
In total, 42 spring-born (mean birth date 8 March) late-maturing breed (Charolais and Limousin-sired) weaned suckler bulls were purchased at livestock markets in Ireland at approximately 8 months of age, accommodated indoors in slatted floor pens and offered grass silage ad libitum plus 2 kg/head per day of a barley-based concentrate. Bulls were randomly assigned for slaughter at target CW of 340, 380 or 420 kg. The bulls were provided with a finishing diet of ad libitum concentrates (870 g/kg rolled barley, 60 g/kg soya bean meal, 50 g/kg molasses and 20 g/kg minerals/vitamins) and grass silage (dry matter digestibility: 700 g/kg) until slaughter. The duration of the concentrate finishing period was 166, 201 and 251 days for 340, 380 and 420 kg CW, respectively. The bulls were slaughtered at a commercial facility (Kepak Group, Clonee, Co. Meath, Ireland). All procedures used complied with national regulations concerning experimentation on farm animals.
Carcass grading, muscle pH and temperature measurement
Post-slaughter, the non-electrically stimulated carcasses were weighed and graded according to the EU Beef Carcass Classification Scheme as described in Mezgebo et al. (Reference Mezgebo, Moloney, O’Riordan, McGee, Richardson and Monahan2017). Muscle pH was measured at 2, 3.5, 5 and 48 h postmortem by making a scalpel incision in the longissimus thoracis (LT) muscle at the 10th rib and inserting a glass electrode (Model EC-2010-06; Amagruss Electrodes Ltd, Westport, Co. Mayo, Ireland) attached to a portable pH meter (Model no. 250A; Orion Research Inc., Boston, MA, USA) ~4.0 cm into the muscle. The temperature was recorded simultaneously and used to make a temperature-compensated pH measurement.
Muscle colour measurement
At 48 h postmortem, carcasses were cut at the 5/6 rib interface. The cut surface of the muscle was first allowed to bloom for 1 h before muscle colour (i.e. L, a, b colour coordinates) measurement. Chroma/saturation (C) and hue angle (h°) values were calculated form the ‘a’ and ‘b’ values. On the same day, LT muscle was excised (from the 10th rib region) from each carcass, vacuum packed, aged for 14 days at 2ºC and then stored at −18ºC before compositional and sensory analyses.
Proximate composition and sensory analyses
Moisture, intramuscular fat (IMF) and protein contents of the LT muscle were determined using the SMART System 5 microwave moisture drying oven, NMR SMART Trac rapid fat analyser (CEM Corporation, Matthews, NC, USA) and LECO FP328 (LECO Corp., St. Joseph, MI, USA) protein analyser, respectively (Association of Official Analytical Chemists, 1990). Sensory analysis was carried out using a 10-person trained taste panel who had been selected for their sensory acuity, a detailed procedure is given in Mezgebo et al. (Reference Mezgebo, Moloney, O’Riordan, McGee, Richardson and Monahan2017).
Statistical analysis
Data were analysed using the GLM procedure of SPSS (IBM SPSS Statistics Version 20) with CW as a fixed factor. For data relating to sensory analysis, ‘assessor’ and ‘session’ were included as fixed factors.
Results
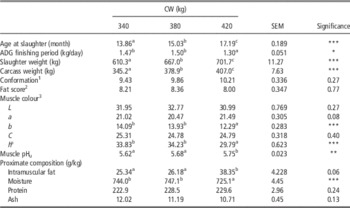
Production and carcass data are presented in Table 1. By design, age at slaughter, slaughter weight and CW were lower (P<0.001) for the 340 kg CW than for the 380 kg CW, which in turn were lower than for the 420 kg CW. Average daily liveweight gain during the finishing period was higher (P<0.05) for the 340 and 380 kg CW (which did not differ) than for the 420 kg CW. The bulls in each group had similar carcass conformation and fat scores. Of the muscle colour coordinates, ‘b’ and ‘hº’ values were higher (P<0.001) for 340 and 380 kg CW (which did not differ) than for the 420 kg CW (Table 1). Intramuscular fat content was lower (P<0.06) and moisture content was higher (P<0.001) for the 340 and 380 kg CW (which did not differ) than for the 420 kg CW (Table 1).
Production and carcass traits, muscle colour, pH and proximate composition of bulls raised on a high concentrate-based production system and slaughtered at different carcass weights (CW)

ADG=average daily liveweight gain; pHu=ultimate pH.
a,b,cMeans within rows, assigned different superscripts differ significantly (P<0.05).
1 Conformation score: scale 1 to 15: E + (15 – highest) to P − (1 – lowest).
2 Fat score: scale 1 to 15: (15 – highest) to 1− (1 – lowest).
3 Muscle colour: L=lightness, 0 (black) to 100 (white); a=redness, +a (red) to −a (green); b=yellowness, +b (yellow) to −b (blue); C=chroma, higher C values higher colour saturation; hº=hue, 0/360º is red, 90º is yellow, 180º is green and 270º is blue colour.
*P<0.05, **P<0.01, ***P<0.001.
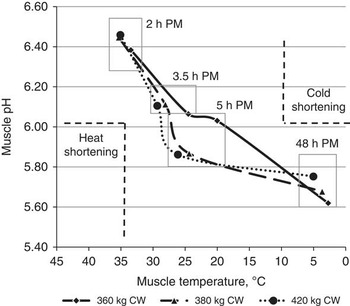
Postmortem muscle pH and temperature profiles are presented in Figure 1. Muscle pH was similar (P>0.05) between CW at 2, 3.5 and 5 h postmortem. At 48-h postmortem, ultimate muscle pH (pHu) was lower (P<0.001) for the 360 and 380 kg CW (which did not differ) than for the 420 kg CW. Muscle temperature was similar (P>0.05) between CW at 2-h postmortem. At 3.5-h postmortem, muscle temperature was lower (P<0.001) for the 360 kg CW than for the 380 and 420 kg CW, which did not differ. At 5- and 48-h postmortem, muscle temperature was lower (P<0.001) for the 360 kg CW than for the 380 kg CW, which in turn was lower than for the 420 kg CW.
Postmortem (PM) muscle pH decline relative to temperature of muscle from bulls raised on a high concentrate-based production system and slaughtered at different carcass weights (CW). Measurements were made at 2, 3.5, 5 and 48 h PM.

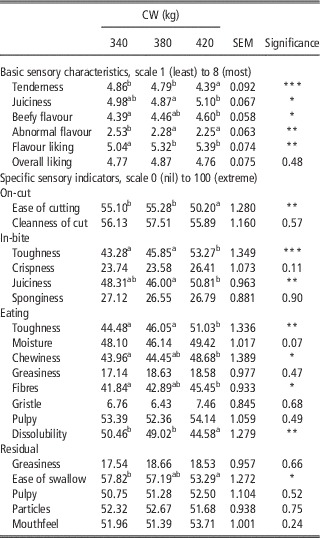
Tenderness was higher (P<0.001) for the 340 and 380 kg CW (which did not differ) than for the 420 kg CW (Table 2). Juiciness was higher (P<0.05) for the 420 kg CW than for the 380 kg CW but similar to the 340 kg CW, which in turn was similar to the 380 kg CW. Beefy flavour was higher (P<0.05) for the 420 kg CW than for the 340 kg CW but similar to the 380 kg CW, which in turn was similar to the 340 kg CW. Abnormal flavour was higher (P<0.01) and flavour liking was lower (P<0.01) for the 340 kg CW than for the 380 and 420 kg CW, which did not differ. There was no difference among CW in overall liking.
Sensory characteristics of longissimus thoracis muscle from bulls raised on a high concentrate-based production system and slaughtered at different carcass weights (CW)
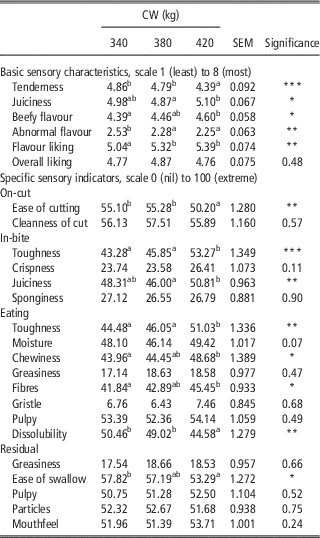
a,b,cMeans within rows, assigned different superscripts differ significantly (P<0.05).
*P<0.05, **P<0.01, ***P<0.001.
Ease of cutting was higher (P<0.01) for the 360 and 380 kg CW (which did not differ) than for the 420 kg CW (Table 2). Toughness (both during in-bite and eating) was lower (P<0.01) for the 360 and 380 kg CW (which did not differ) than for the 420 kg CW. Juiciness (during in-bite) was higher (P<0.01) for the 420 kg CW than for the 380 kg CW but similar to the 360 kg CW, which in turn was similar to the 380 kg CW. Chewiness and fibrousness were higher (P<0.05) for the 420 kg CW than for the 360 kg CW but similar to the 380 kg CW, which in turn was similar to the 360 kg CW. Dissolubility was higher (P<0.01) for the 360 and 380 kg CW (which did not differ) than for the 420 kg CW. Ease of swallow was higher (P<0.05) for the 360 kg CW than for the 420 kg CW but similar to the 380 kg CW, which in turn was similar to the 420 kg CW.
Discussion
The higher pre-slaughter growth rates for the 340 and 380 kg CW compared with the 420 kg CW can be explained by the shorter duration of the concentrate feeding period for the 340 and 380 kg CW as an increase in the length of the feeding period results in a progressive decrease in average daily gain (Caplis et al., Reference Caplis, Keane, Moloney and O’Mara2005). Carcass conformation and fat scores are often reported to increase with an increase in slaughter weight and age at slaughter (O’Riordan et al., Reference Oddy, Harper, Greenwood and McDonagh2011) but this was not observed in the present study. This may indicate that the animals were at a similar level of maturity, that is, not at a stage where excess energy is deposited as subcutaneous fat.
The postmortem muscle pH profile relative to temperature (Figure 1) indicates that the muscles were unlikely to be affected by ‘cold shortening’ or ‘heat shortening’ as no individual carcasses had a muscle pH value of greater than 6 at a muscle temperature of less than 10°C (Pearson and Young, Reference Pearson and Young1989) and the muscle pH did not drop below 6 while the temperature was above 35°C (Dransfield, Reference Dransfield1993), respectively. Despite similar fatness scores, postmortem muscle temperature decline was different between the CW, in that, a decrease in temperature fall with an increase in CW was observed. The higher pHu in muscle from the 420 kg CW relative to the 380 and 340 kg CW may indicate that the muscle glycogen reserve at the time of slaughter was lower for the 420 kg CW despite similar indoor finishing diets and careful management of the bulls during transport and lairage, which would make them less likely to experience stress-related loss of glycogen (Pethick et al., Reference Pethick, Rowe and McIntyre1994). However, the difference in mean pH between groups was small (<0.13 pH units) and mean values were within the ‘normal’ pH range (i.e. 5.4 to 5.8) (Viljoen et al., Reference Viljoen, De Kock and Webb2002); muscle from each group would therefore not be expected to be dark in colour. The similar muscle lightness values between the different CW supports this observation.
The higher IMF content for the 420 kg CW compared with the 340 and 380 kg CW could be related to their older age at slaughter and heavier slaughter weight as deposition of IMF increases with increasing age and slaughter weight (Oddy et al., Reference O’Riordan, Crosson and McGee2001). The higher IMF in the 420 kg CW, despite there being no difference in fat score between the different CW, may reflect the conversion of excess energy to IMF as opposed to subcutaneous fat with an increase in animal age (Warriss, Reference Warriss2010).
The higher tenderness scores for the beef from the 340 and 380 kg CW compared with the beef from the 420 kg CW could mainly be attributed to their younger age at slaughter (Mezgebo et al., Reference Mezgebo, Moloney, O’Riordan, McGee, Richardson and Monahan2017). A similar explanation could be offered for the higher scores for ease of cutting and dissolubility and lower scores for toughness (both during in-bite and eating) for the beef from the 340 and 380 kg CW relative to the beef from the 420 kg CW. The sensory panel evaluation also indicated that the sensory tenderness ratings were internally consistent, that is higher tenderness score (i.e. the basic taste) was consistent with the lower toughness scores (both during in-bite and eating). Similarly, the panellists were consistent when evaluating the juiciness of the beef (i.e. agreement between juiciness scores during the basic and in-bite assessments). The favourable juiciness scores for the beef from the 420 kg CW compared with the beef from the 340 and 380 kg CW can be explained by their higher IMF content as juiciness of beef often increases with an increase in marbling fat (Baublits et al., Reference Baublits, Pohlman, Brown, Johnson, Rule, Onks, Murrieta, Richards, Sandelin, Loveday and Pugh2006; Mezgebo et al., Reference Mezgebo, Moloney, O’Riordan, McGee, Richardson and Monahan2017). Similarly, the higher beefy flavour and flavour liking scores of the beef from the 420 kg CW compared with the beef from the 340 kg CW could mainly be attributed to their higher IMF content (Thompson, Reference Thompson2004), which in turn could be related to their heavier weight at slaughter.
Conclusion
In a high concentrate suckler bull production system, slaughtering bulls at 420 kg CW rather than at lighter CW increased the IMF content of the muscle with an associated increase in juiciness, beefy flavour and flavour liking of the beef. These favourable sensory ratings came at the expense of tenderness but not to an extent that the overall liking of the beef was affected.
Acknowledgments
The senior author acknowledges receipt of a Teagasc Walsh Fellowship. The assistance of Ms. Karen Hussey at Teagasc Food Research Centre, Ashtown, Dublin and staff at Teagasc, Grange, is also acknowledged. The assistance of staff and management at Kepak Group, Clonee, Co. Meath with sample collection and carcass measurement is greatly appreciated.