

1. Introduction
The most common form of preferential arrangement in international trade is a free trade agreement (FTA), which eliminates tariffs, import quotas, and preferences on most, if not all, goods and services trade between member countries. Unlike a customs union, an FTA does not impose a common external tariff and therefore FTA member countries use the system of rules of origin (ROOs) in order to avoid tariff evasion through re-exportation. Within the ROOs system, there is a requirement for a minimum extent of local material inputs and local transformation adding value to the goods. In order to comply with the ROOs, users may need to change their original pattern of procurement. Since the original pattern of procurement is likely to be optimal, given the market conditions, the procurement costs may rise. Also, the administrative costs involved in investigating the possible use of FTAs and applying for preferential rates can be substantial.Footnote 1
On the other hand, the use of an FTA will generate benefits for firms in terms of saving on tariff payments as the preferential rates are lower than most favoured nation (MFN) tariff rates. The larger the tariff margin – the gap between MFN rates and FTA rates – the greater will be the benefits for firms that have successfully applied for FTA rates. Therefore, when considering the possibility of trading under an FTA, firms will weigh the gains (i.e., tariff margin) from the use of the FTA against the costs (i.e., ROO-related adjustment and administration costs). It is to be expected that the greater the tariff margin and the less restrictive the ROOs, the greater will be the likelihood that firms will use the FTA preference. Also, the size of an export transaction per se is very important because a larger export volume leads to a larger saving on tariff payments, even if the tariff margin is small. In sum, there are three key elements determining the utilization rate of an FTA: tariff margin, rules of origin restrictiveness, and average volume of trade. In this paper, the effects of these three elements are called ‘margin effect’, ‘ROO effect’, and ‘scale effect’, respectively.
In the academic field, there have been only a limited number of studies analyzing the determinants on the utilization of preferential regimes. Two similarities are noticeable among these studies. First, most studies have examined unilateral preferential schemes, rather than bilateral FTAs. Bureau et al. (Reference Bureau, Chakir and Gallezot2007) examine utilization of the Generalized System of Preferences (GSP) granted by the European Union (EU) and the United States (US) to developing countries in the agri-goods sector, while Cadot et al. (Reference Cadot, Carrere, De Melo and Tumurchudur2006) focus on the trade of the EU and US with their preferential trading partners. Francois et al. (Reference Francois, Hoekman and Manchin2006) and Manchin (Reference Manchin2006) examine the preferential trade relations between the EU and non-least-developed African, Caribbean, and Pacific (ACP) countries under the Cotonou Agreement, while Hakobyan (Reference Hakobyan2010) examines US GSP utilization by 143 GSP-eligible countries. Exceptionally, Keck and Lendle (Reference Keck and Lendle2012) analyze utilization of both unilateral and bilateral preferences not only by EU and US but also by Australia and Canada.
Second, the elements examined to find the determinants on the utilization of preferential regimes are almost identical and yield similar results. That is, preference utilization rates are higher for trade in products with a larger tariff margin and a larger volume of trade but smaller for trade in products in which ROOs are more restrictive.
Two dissimilarities are also noteworthy among the earlier papers. First, the definition of the FTA utilization rate with a specifically associated preferential rate differs across various studies. Some studies define this concept as the share of trade value under FTA preferential schemes in the total trade value or in the trade value of products with a positive tariff margin. The share of the number of preferential rate users in the total number of firms is also used. Second, the estimation technique is also different across various papers, based on their respective motivation. For example, Francois et al. (Reference Francois, Hoekman and Manchin2006) and Manchin (Reference Manchin2006) employ the threshold regression technique to estimate the tariff equivalents of the above-mentioned costs for the use of preferential regimes. In order to examine the differences across the various tariff schemes, including not only MFN rates and FTA rates but also GSP rates, Bureau et al. (Reference Bureau, Chakir and Gallezot2007) employ the multinomial probit model rather than binomial models. Also, Manchin (Reference Manchin2006) includes observations with zero-valued FTA utilization rates by employing the Heckman sample selection model. Hakobyan (Reference Hakobyan2010) and Keck and Lendle (Reference Keck and Lendle2012) use a fractional logit because the utilization rate ranges from zero to one.
In this paper, we examine the utilization of bilateral FTAs by South Korea. As of February 2013, Korea has eight FTAs that have become effective (Korea–Chile FTA, Korea–Singapore FTA, Korea–EFTA FTA, KAFTA, Korea–India CEPA, Korea–EU FTA, Korea–Peru FTA, and Korea–US FTA).Footnote 2 Among these FTAs, we focus on the utilization of the Korea–ASEAN FTA (KAFTA) in goods trade; this entered into force on 1 June 2007 between Korea and the ASEAN signatories that had completed the domestic procedure for implementation.
Specifically, using the data on Korea's imports from ASEAN during the period from June 2007 to December 2011, this paper explores the role of the above-mentioned three effects in determining the level of FTA utilization. As in previous studies, it is to be expected that the margin effect and scale effect will be positively associated with FTA utilization, while the ROO effect will be negatively associated with FTA utilization.
Our measure of FTA utilization is calculated as the share of trade values under FTA schemes in total trade values at the HS 10-digit level. The variables necessary to calculate utilization rates (i.e., the total value of imports from ASEAN countries and the types of imposed tariff) are taken from the database provided by the Korea Customs and Trade Development Institute (KCTDI) and the utilization rate is calculated at the HS 10-digit level. The tariff margin is also constructed at the 10-digit level by using MFN and preferential tariff rates from KAFTA's phase-out program for the corresponding year. The trade value per application is measured as total dutiable imports at the HS 10-digit level divided by the number of claims reported to Korean Customs in the corresponding year. The ROO restrictiveness index, however, is constructed at the 6-digit level, since ROOs in KAFTA were negotiated at the 6-digit level.
Our analysis exhibits three novel features, as compared with the literature. First, while almost all existing studies focus on the unilateral preferences of either the US or the EU, this study is concerned with bilateral FTA utilization by Korea. The study closest to ours is Kim and Cho (Reference Kim and Cho2010), which tests the impact of tariff margin and ROOs on utilization of KAFTA. This paper improves on Kim and Cho (Reference Kim and Cho2010) by extending the period of study, quantitatively comparing the scale effect in addition to margin effect and ROO effect, and employing various estimation techniques, including a fractional logit.Footnote 3
Second, we explore the transaction-level trade values in order to examine the scale effect. Most of the previous studies (e.g., Hakobyan, Reference Hakobyan2010) examine the product-country-level trade values. Keck and Lendle (Reference Keck and Lendle2012) mimic the transaction-level trade values by employing trade data by month at the customs district/member level for the US and European Union, and they call these data ‘pseudo-transaction-level’ trade values. On the other hand, we have access to transaction-level data and thus can examine trade values per application, which can be taken as a proxy for per-firm trade values. Since the decision on FTA use is made at firm level, not country level, our use of per-firm trade values is more appropriate for examining the scale effect. Third, this is the first paper that evaluates the relative contribution of all of the three effects to FTA utilization simultaneously. So far, two of the effects have been investigated simultaneously in the literature, but, with the exception of Hakobyan (Reference Hakobyan2010), all of the three effects have not been explored together.Footnote 4 By accomplishing the relative evaluation of the three effects, we can propose significantly more effective policies for enhancing FTA utilization.
The remainder of this paper is organized as follows. Section 2 provides our empirical framework on firms’ choices regarding FTA use and then specifies our empirical equations to be estimated. After giving an overview of the utilization of KAFTA in Section 3, we conduct an econometric analysis, the results of which are reported in Section 4. Finally, we provide concluding remarks in Section 5.
2. Empirical framework
This section specifies our empirical framework for examining firms’ choices on FTA use. As mentioned in the introductory section, three elements are crucial in firms’ FTA use: margin effect, ROO effect, and scale effect. It is to be expected that, while the ROO effect will be negatively associated with FTA utilization, both margin effect and scale effect will be positive. In addition to these three elements, administrative costs to obtain certificates of origin may also play a significant role. The significance of all of these elements is theoretically demonstrated in Demidova and Krishna (Reference Demidova and Krishna2008). In the present paper, however, we quantify the relative contributions of these elements to product-level FTA utilization rates.
In our empirical analysis, we focus on one country's imports from several FTA partner countries. Our estimation equation is simply formalized as follows:
 $$\eqalign{{\rm Utilization}_{ipt} =\ & \beta _1 \;{\rm Tariff\; Margin}_{ipt} + \beta _2 \ln \;{\rm Average}\;{\rm Trade}_{ipt} \cr &\!\!\! + \beta _3 \;{\rm Restrictiveness}\;{\rm Index}_{ip} + {\rm u}_i + {\rm u}_t + {\rm u}_s + \varepsilon _{ipt}} $$
Utilization ipt is the FTA utilization rate in imports from country i for product p in year t. As mentioned in the previous section, a product is defined at the 10-digit level of the Harmonized System (HS). ‘Average Trade ipt ’ is the per-application average trade value of country i for product p in year t, and ‘Tariff Margin ipt ’ is the absolute difference between FTA rate and MFN rate on product p from country i in year t. ‘Restrictiveness Index ip ’ indicates the restrictiveness of ROOs in the FTA with country i for product p. Since a higher index indicates more restrictive ROOs, we expect its coefficient to be negative. We also introduce dummies for some fixed effects: exporting country dummy (u i ), industry dummy (u s ), and year dummy (u t ). The industry dummy is defined at the 2-digit section-level of the HS. The role of (physical) administrative costs is expected to be controlled by the exporting country dummy because such costs depend on the effectiveness of customs in exporting countries and thus differ mainly by exporting country. We control differences in the difficulty in complying with ROOs among industries by the industry dummy variable.
As explained in the previous section, the utilization rate is defined as the share of imports that actually receive preferential treatment in the total imports that are eligible to receive such preferential treatment. The term ‘eligible’ means ‘applicable’ for preferential tariff rates under a certain preferential agreement. By definition, this rate lies in the unit interval, i.e., [0, 1]. This characteristic in the dependent variable might be one noteworthy issue. The traditionally popular method to estimate this kind of model is the Tobit estimation technique, particularly the two-limit Tobit model in our case. The pseudo-Poisson maximum likelihood (PPML) estimation technique has recently become a popular method in gravity studies, because this method can naturally include zero-valued dependent variables.Footnote 5
Hakobyan (Reference Hakobyan2010) and Keck and Lendle (Reference Keck and Lendle2012) employ the fractional logit model, which was proposed by Papke and Wooldridge (Reference Papke and Wooldridge1996). The fractional logit model ensures that, unlike ordinary least squares (OLS) and PPML, the predicted values of the dependent variable are in the unit interval. It also imposes less restrictive assumptions than the Tobit model (requiring the normality and homoskedasticity of the dependent variables). In sum, the fractional logit model is more natural and appropriate for estimating our model.Footnote 6 Thus, our most preferred method uses the fractional model but, for the sake of comparison, we also present the results obtained by the simple ordinary least squares (OLS) method, the PPML method, and the 2-limit Tobit model.Footnote 7
3. Data issues
In our analysis, we focus on the FTA between Korea and ASEAN, or KAFTA. KAFTA on trade in goods entered into force on 1 June 2007 between Korea and the ASEAN member countries that had completed the domestic procedure for implementation. Indonesia, Malaysia, Myanmar, Singapore, and Vietnam were the first group of signatories to give effect to KAFTA on 1 June 2007. Then followed the Philippines (1 January 2008), Brunei (1 July 2008), Lao PDR (1 October 2008), Cambodia (1 November 2008), and Thailand (1 January 2010). The agreement stipulates detailed temporal tariff reduction commitments for each member country. It is noted here that, on considering the two FTAs with Singapore (Korea–Singapore FTA and Korea–ASEAN FTA in which Singapore participates as a member of ASEAN), we exclude Singapore from calculating the utilization rate to avoid any possible bias.Footnote 8
The tariff reduction schedule distinguishes two tracks, namely normal track and sensitive track, and the sensitive track is further divided into sensitive product and highly sensitive product. Products under normal track accounted for 90% of total tariff lines and 90% of total import value in 2005, while products classified as sensitive track accounted for the remaining 10%. Special and differential treatment were applied in the tariff elimination and reduction process, depending on the levels of development among the participating countries; tariffs on products under normal track were/are scheduled to be eliminated by January 2008 for Korea, January 2010 for ASEAN 6 (Brunei, Indonesia, Malaysia, Philippines, Singapore, and Thailand), January 2013 for Vietnam, and January 2015 for Cambodia, Laos, and Myanmar.Footnote 9 On the other hand, tariff reduction for products classified under sensitive track was not to start in our sample period; the first obligation for sensitive track products was to reduce tariffs by 20% in 2012, and this was to be followed by additional tariff reductions later on. Therefore, our data regarding FTA utilization for Korea's imports from ASEAN cover only products under normal track.
Our data on FTA utilization for Korea's imports from ASEAN cover the period from June 2007 to December 2011, and we specify five sequential periods: June 2007–December 2007, 2008, 2009, 2010, and 2011. The cross-sectional components of the data are organized at the 10-digit level of the HS. Our measure of FTA utilization is calculated at the HS 10-digit level as the share of trade values under FTA schemes in total trade values with positive tariff margin.Footnote 10
Table 1 shows the utilization rates in 2011 by exporting country and industry, i.e. Section-level product groups of the HS.Footnote 11 In total, Malaysia and Thailand have the lowest utilization rates (35%), while Myanmar has the highest rate of 96%. Taking a look across industries, there are many country-industry pairs with very high rates of utilization. Some pairs even have 100% utilization rates (wood products from Brunei, animal/vegetable fats and oils from Indonesia, and food products from Myanmar). There are a large number of pairs with rates higher than 90%. Also, there are several pairs with rates lower than 50%, and some show zero utilization rates. In sum, the utilization rates vary widely across exporting countries and industries.
FTA utilization rates in 2011 by exporting country and industry

Source: Authors' calculations based on data from the Korea Customs and Trade Data Institute (KCTDI).
The tariff margin is also constructed at the 10-digit level by using MFN and preferential tariff rates from KAFTA's phase-out program for the corresponding year. In order to precisely calculate the tariff margin, we do not include products that are subject to a tariff rate quota, since it would then be difficult to calculate the tariff margin.Footnote 12 Also, products whose MFN tariff rates are zero or whose MFN rates are equal to KAFTA preferential ratesFootnote 13 are dropped from our data.Footnote 14 The scale effect, trade volume per application, is measured at the HS 10-digit level by country and defined as the value of dutiable imports at the HS 10-digit level divided by the number of claims reported to Korean Customs in the corresponding year. It is to be expected that if the trade volume per application is large, the importer (or exporter) will be able to save large sums in tariff payments. That is, the importer's (or exporter's) incentive to use KAFTA preferential tariff treatment should become stronger as the total trade volume per application increases, and hence we expect a positive relation between the two.
The ROO restrictiveness index, however, is constructed at the 6-digit level, since ROOs in the FTAs were negotiated at the 6-digit level. For a quantitative measure of restrictiveness in ROOs, we adopt the method proposed by Estevadeordal (Reference Estevadeordal2000). His restrictiveness index was designed to perform quantitative analysis on ROOs for NAFTA, ranging from 1 to 7 by category. Estevadeordal and Suominen (Reference Estevadeordal and Suominen2004) developed this further. Their restrictiveness index is based on changes in tariff classification rules. The basic idea of a restrictiveness index is that the higher the index, the more restrictive are the ROOs. They give a higher restrictiveness score for a change in tariff chapter (CTC, HS 2-digit) and wholly obtained criteria (WO), whereas a lower restrictiveness score is given for a lower level change in tariff classification and regional value content criteria.
However, the ROOs in the case of KAFTA are more complicated. Given that many modified types of ROOs are adopted, we need a certain degree of adjustment, for example on how to deal with combination and/or selective ROOs or how to index rules that are based on a change in chapter but with some exceptions. Where ROOs are selective, we use the average of the ROOs. If the ROOs for a certain product are changed in chapter sub-heading (CTSH, restrictiveness index of 3) or show a regional value content of 40% (restrictiveness index of 4), we use 3.5 as the restrictiveness index for that product, this being the average of the two relevant selective ROOs. Also, if a certain ROO has an additional restriction (such as a change in tariff heading, excluding some products, CTH+ECTC (Exception)), we add 0.5 to reflect the additional restrictiveness of the ROO. We also differentiate regional value content (RVC) by its required regional content percentage; we give a restrictiveness index score of 4 for RVC 40%, and for RVC 60% we impose a restrictiveness index score of 5, whereas for a ROO with RVC 25% we give a restrictiveness score of 3.Footnote 15
As a result, in KAFTA there are 16 types of ROOs used for 3,509 products in HS 6-digit and these types are reported in Table 2.Footnote 16 The selective rule of change in heading (CTH) or RVC 40% is the most frequently used decision rule, which is applied for 1,728 product groups. This is followed by RVC 50% (1,337 product groups). The distribution of restrictiveness indices by Section-level product groups of the HS is summarized in Table 3. As is evident from Table 3, most of the product groups in each section have a score of 4.0. However, as compared with others, it is clearly seen that mineral products, chemical products, and machinery industries (including machinery, transport equipment, and precision machinery) have a relatively large number of products with a score higher than 4.0, particularly the score of 4.5, which is assigned to RVC 50%. Also, it is noteworthy that there are relatively many products with the score of 5.5 in textiles, in which the ROO requires meeting an RVC of 50% and a specific procedure in the production process.
ROO types in the Korea–ASEAN FTA

Notes: Abbreviations are as follows: CTC (Change in Chapter), CTH (Change in Heading), CTSH (Change in Sub-heading), RVC (Regional Value Content), WO (Wholly Obtained), and SP (Technical Specification).
Source: Authors' calculations based on data from the Korea Customs and Trade Data Institute (KCTDI)
Distribution of ROO Restrictiveness Index in the Korea–ASEAN FTA (number of products)

Note: This table reports the number of products (HS 6-digit level) by restrictiveness scores of ROOs. Source: Authors' calculations based on data from the Korea Customs and Trade Data Institute (KCTDI).
4. Empirical results
The results obtained by several estimation techniques are reported in Table 4.Footnote 17 In the case of OLS, we also tried the inclusion of industry dummy variables at the HS 6-digit level and the HS 10-digit level instead of those at the HS 2-digit level because the difficulty in complying with ROOs might be different across the more detailed industries. However, the restrictiveness index had to be dropped because ROOs are defined at HS 6-digit level in KAFTA and are common across products within the same HS 6-digit code (i.e. perfect multicollinearity).Footnote 18 Thus, we focus mainly on the results for equations with an HS 2-digit code dummy.
Estimation results: marginal effects

Notes: The dependent variable is FTA utilization. The parentheses are standard errors. ***, **, and * show 1%, 5%, and 10% significance, respectively.
All of the coefficients (marginal effects) are estimated to be significant with the expected signs, except for the restrictiveness index in Tobit (V). Larger tariff margins and larger average trade values contribute significantly to raising FTA utilization rates. The coefficient for the restrictiveness index is estimated to be significantly negative, indicating that more restrictive ROOs lead to lower rates of FTA utilization. Another noteworthy point is that the estimated coefficients differ greatly by estimation method in terms of magnitude.
Next, we evaluate the relative contribution of three effects to FTA utilization.Footnote 19 Specifically, we multiply the respective regression coefficient by the average value of the corresponding variable. For example, the contribution of the tariff margin effect is computed by the regression coefficient of Tariff Margin (reported by the fractional logit model under VI in Table 4) multiplied by the sample means of Tariff Margin. The contribution of each effect is calculated by exporting country. The results are reported in Table 5.
Contribution to the average rates of FTA utilization by exporters

Notes: The upper figures in this table report the marginal effects multiplied by the mean values of ‘Average Trade’, ‘Tariff Margin’, and ‘Restrictiveness Index’. The marginal effects are based on the results provided under (VI) in Table 4. Both the marginal effects and the mean values are calculated by exporting countries. The lower figures show the respective contribution when the contribution of Average Trade is normalized to the value one.
There are two noteworthy points. One is that the scale effect is the most important in FTA utilization. In all countries, the scale effect provides a more than ten times larger contribution than the margin and ROO effects (in absolute terms). Also, the tariff margin and ROO effects have almost the same magnitude of contribution to FTA utilization. Second, Cambodia has a relatively large margin effect. This is somewhat surprising because the scale effect is expected to be more important for low-income countries, where exporters are small firms for which sunk costs of using preferences are larger in relative terms. We suspect that this result might be due to the fact that exporters from Cambodia to Korea are mostly Korean firms’ affiliates and thus relatively large-sized. In other words, since most of the exporters in Cambodia are large enough, firm size may not be a major factor, and the other elements, particularly tariff margin, may play a more important role, as compared with other countries. However, this point deserves further investigation in a new study.
5. Concluding remarks
Utilization rate is a key indicator of how effectively an FTA is implemented. A low utilization rate means that tariff elimination or reduction under the FTA fails to bring out an expected economic benefit. Often referred to as a hidden non-tariff barrier, rules of origin are regarded as a factor that can act counter to the efficient practice of an FTA. In this paper, we have empirically assessed the effect of ROO restrictiveness, along with the relative magnitude of the effects of tariff margin and average size of each transaction, on FTA utilization for Korean imports under KAFTA. We have found that all three effects are statistically significant in affecting FTA utilization; however, we have also shown that the scale effect is much more important than the margin effect or the ROO effect.
First of all, the results confirm the negative correlation between restrictiveness of ROOs and FTA utilization. This implies that complex and strict requirements under ROOs increase the compliance cost for exporters and importers, thus offsetting the gains from preferential treatment, and this results in reduced use of the FTA. On the other hand, our results show a positive impact of tariff margin and average size of each transaction on FTA utilization.
Given that ROOs are in practice a necessity in connection with preferential trade agreements in order to prevent abuse due to free-riding, our results imply that even though complying with a ROO is costly, this cost can be effectively compensated if the tariff margin is large. This suggests that the use of an FTA will increase as the FTA tariff elimination/reduction process goes ahead. In addition, we can infer that complete elimination of a tariff would be more effective than partial tariff reduction in terms of FTA utilization, thereby providing policymakers with a stimulus to negotiate more extensive tariff elimination.Footnote 20 Also, the fact that the compliance cost of a ROO can be offset if the volume of exports is large means that substantial support should be provided for small and medium-size enterprises (SMEs). SMEs are likely to export relatively small volumes per transaction; therefore, it may be onerous for SMEs to make full use of the scale effect. Accordingly, policy assistance for reducing administrative costs should be geared toward SMEs. For example, holding seminars and/or providing on-line and/or on-site consulting services on how to make best use of preferences will help SMEs to gain optimal benefit from an FTA.
Finally, we can infer from our results that the use of an FTA can increase as the tariff elimination/reduction process goes ahead. Also, there can be a learning-by-doing effect regarding ROOs. That is, the compliance cost of a ROO decreases as exporters build relevant experience and know-how, so that the impact of the restrictiveness of a ROO on FTA utilization declines, possibly even to the point of becoming insignificant in the long run. It would be an interesting issue to determine whether any structural break-even point or threshold level can be identified. Having only six years of experience of implementation, however, we need a longer period for empirical testing, and this would constitute an interesting future research topic.
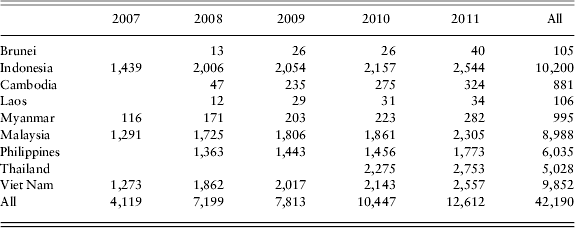
Appendix: Sample statistics
Basic statistics

Number of observations by exporters and years