

At the heart of concerns over whether religious belief is compatible with democracy is the question of authority. Democracy arguably requires granting a level of assent to the results of a process that does not guarantee the return of a right answer. Moreover, democracy cannot stand without granting equal rights to those with whom you may fundamentally disagree. These prerequisites have proved difficult for those with the utmost commitment to their religious faith, both as political theorists have argued it (e.g., Carter Reference Carter1991; Rorty Reference Rorty1994; Wolterstorff Reference Wolterstorff2003) and how empirical social scientists have measured it (e.g., Gibson Reference Gibson, Wolfe and Katznelson2010; Djupe Reference Djupe2015). But the measures used to engage in this essential debate have been fraught. Some make the reasonable assumption that religious entities, such as God (e.g., Cassese and Holman Reference Cassese and Holman2017), or religious organizations, such as denominations (Shelton and Cobb Reference Shelton and Cobb2018), are authorities. Others conflate religious conservatism or religiosity with what is truly at issue—religious authority, which we define as legitimacy granted to religious leaders and principles to guide behavior.
Given this belief that religious authority exists independently from religiosity (e.g., Compton Reference Compton2020), there is a growing need for an explicit measure in this concept. To this end, we create and test a battery of five questions that tap into religious authority values (RAV), which are correlated with religiosity and religious conservatism, but also have independent effects on measures of interest including views of democratic norms and the importance of deliberative values. To test these relationships, we draw on survey data from clergy and citizens in three samples to show that it is often religious authority that drives relationships between religion and these core democratic requisites. Religiosity and religious conservatism are related to these items, but their effects often shrink or disappear once we incorporate our measure of religious authority. We believe that this work should serve as a launching pad for new arenas of research into the composition of and consequences of religion in American life.
We will review problems in the literature where generic measures of religiosity or religious conservatism have been used as proxies for religious authority, which serve as a call for independent measurement of this critical component of a religious worldview. Then we rebuild theory to make clear how religious authority should be linked to democratic process, highlighting the metaphorical qualities that religious thinking and congregational life have for democracy. Finally, we present results from three datasets with appropriate measures for clergy and citizens that confirm religious authority's link to democratic thinking.
RELIGIOUS AUTHORITY BY PROXY
The behavioral revolution in the social sciences was fueled by the rise of Nazism in Germany and the experiences of established democracies whose democratic commitments wavered in the face of grave threats like the spread of communism (e.g., Stouffer Reference Stouffer1955). Religion played a role in this burgeoning research agenda that was deeply concerned with the problems of authority, though religion was initially measured quite crudely. Whether Herberg's (Reference Herberg1960) tripartite classification or Stouffer's (Reference Stouffer1955) reliance on church attendance, no contemporary student of American religion would be satisfied with singular measures of religious experience and identity.
Stark and Glock (Reference Stark and Glock.1965) filled that gap with their canonical discussion of religiosity which provided the intellectual basis of the modern variants called religious commitment, religiosity, and the “3 B” approach. In each scheme, individuals belong to religious organizations, they display various forms and amounts of behaviors, and they adopt various beliefs (e.g., Leege and Kellstedt Reference Leege and Kellstedt1993; Kellstedt et al. Reference Kellstedt, Green, Guth, Smidt, Green, Guth, Smidt and Kellstedt1996; Layman Reference Layman2001; Smidt, Kellstedt, and Guth Reference Smidt, Kellstedt, Guth, Guth, Kellstedt and Smidt2009). Access to better or at least more measures of religiosity improved over time, but early studies of democratic orientations often relied on a single measure—biblical literalism (e.g., Jelen and Wilcox Reference Jelen and Wilcox1991).
The variety of ways in which biblical literalism has been used highlights the need for independent measures of religious authority. Oftentimes this single measure was used as a proxy for religious conservatism when surveys had no others (e.g., Wald, Owen, and Hill Reference Wald, Owen, Hill and Jelen1989; Layman Reference Layman1997; Layman Reference Layman2001; Burge Reference Burge2013). Other scholars used literalism as a measure of religious fundamentalism (Wald, Owen, and Hill Reference Wald, Owen, Hill and Jelen1989; Jelen and Wilcox Reference Jelen and Wilcox1991) in line with the development of the more general (and secular) concept of dogmatism (Rokeach Reference Rokeach1961). Literalism has also been used as a proxy for a particular environmental worldview (“dominion”) that values human consumption over conservation (Eckberg and Blocker Reference Eckberg and Jean Blocker1989; Guth et al. Reference Guth, Kellstedt, Smidt and Green1993; Woodrum and Hoban Reference Woodrum and Hoban1994; Sherkat and Ellison Reference Sherkat and Ellison2007). Of course, the measure is both—it is a measure of religious belief as well as a statement about religious authority. But it is important to note that it is limited to a particular religious text and there are more elements of religion than that. Moreover, others have suggested that religiosity itself is suggestive of religious authority. In this view, greater religious commitment indicates a motivation to adopt religious and political information and arguments from the clergy (e.g., Leege and Kellstedt Reference Leege and Kellstedt1993). If religiosity serves as motivation to adopt information (see Gaskins Reference Gaskins2019), then religiosity indices are likely to be correlated with authority measures.
It goes without saying that the most widely used question that assesses biblical literalism originally introduced in the General Social Survey is imperfect in its assessment of religious belief and authority. The most salient criticism, arguably, is that it defines conservative theology in largely evangelical terms (see Leege Reference Leege1996). A belief in a literal bible is a touchstone of the evangelical religious tradition, which places a great deal of emphasis on sola scriptura—a belief that the bible is the ultimate authority on all matters (Mathison Reference Mathison2001). However, the Roman Catholic tradition has an entirely different view of the scriptures, oftentimes taking an inerrantist approach, but deferring to the Pope for a proper reading of the bible (Atkinson Reference Atkinson2007). The result is that an evangelical would look more authoritarian through the lens of biblical literalism, even though many Catholics place a great deal of emphasis on the authority of the church hierarchy but do not often hold to a literalist view. More generally, there are multiple dimensions to religious authority for which a measure should account.
THE NATURE OF RELIGIOUS AUTHORITY
The earliest social science regarding the role of the religion in society carefully considered the nature of religious authority. When constructing his definition of a religious organization, Max Weber argued that the way the church understood authority made it unique. Weber believed that religious institutions stand as an example of a “hierocratic organization” in that it enforces order by relying on “psychic coercion,” usually by cutting members off from religious benefits. Thus, Weber defines a church as possessing an authority structure that has a monopoly on “the legitimate use of hierocratic coercion” (Weber Reference Weber1978, 54). Weber's understanding of religious authority is closely linked to political authority insofar as both have the ability to withhold benefits or resources that individuals want.
The primary difference between religious and political authority, however, lies in the fact that religious authority is “legitimated by calling on some supernatural referent” (Chaves Reference Chaves1994, 756; Smith Reference Smith2017). The proper interpretation of these supernatural edicts is mediated through the recognized leader of the religious organization, who often engages in the use of specific religious terminology and text to justify their decision making (Fenn Reference Fenn1982; Djupe and Calfano Reference Djupe and Calfano2012). This specific use of coercion is necessary for religious authority because they do not have the ability to force compliance like teachers have in the classroom or managers possess in the workplace. Instead, religious leaders can use the threat of excommunication (Sosis Reference Sosis2005).
The literature has continued to debate whether religious authority is voluntary or dispositional. The rise of the “strong man” dictators of the early 20th century forced social scientists to seek explanations for their rise to power. Adorno's seminal work, The Authoritarian Personality, posited that certain individuals were predisposed to seek out ways to exert power over others and were prone to favor the strong over the weak (Adorno Reference Adorno1950). These suppositions were quickly linked to the fundamentalist religious tradition in the United States (Rhodes Reference Rhodes1960; Brown Reference Brown1962). In sum, this early work noted that there was a deep psychological link between those who preferred authority and those who were drawn to conservative religious traditions.
More recent work has grappled with whether fundamentalist Christians are true authoritarians or if they are more accurately described as “authority-minded,” which is an “ideological commitment” rather than a “defective psychological trait” (Owen, Wald, and Hill Reference Owen, Wald and Hill1991, 75). Authority-mindedness is rooted in adherents' commitment to the proposition that there is such a thing as ultimate authority and that true fulfillment in life can be found only by living under it. This approach to understanding authority is closely related to religious certainty (or religious dogmatism). Instead of being focused on the church's organizational structure, authority-mindedness helps adherents “avoid drowning in a sea of relativism, unpredictability, and change” (Owen, Wald, and Hill Reference Owen, Wald and Hill1991, 88).
In testing their authority-minded hypothesis, Owen, Wald, and Hill find a great deal of slippage with a traditional measure of authoritarianism, which was centered on individual authority, rather than a more appropriate conception that would focus on conformity and order. For instance, when asked “Would you like to end up as Top Dog?” fundamentalists were less likely to say yes, reflecting a discomfort with individuals standing apart from the group. However, their own measure was still rooted in the measurement of individual certainty (Reference Owen, Wald and Hill1991, 87) rather than whether religion demands conformity, rigidity, and order. The importance of understanding and measuring religious authority would come to fore in the next two decades as two important religious movements shaped the landscape of American Christianity.
Without question, the greatest tectonic shift in the recent American religious landscape has been the rise of the Christian Right (Balmer Reference Balmer2007; Armstrong Reference Armstrong2010). One of the most prominent understandings of the rise of the Religious Right is that it was the result of a coordinated mobilization effort by several charismatic televangelists who preached a conservative theology that made religious authority a central feature (Hadden and Shupe Reference Hadden and Shupe1988; Sherkat and Ellison Reference Sherkat and Ellison1997; Diamond Reference Diamond1999; Hoffmann and Bartkowski Reference Hoffmann and Bartkowski2008). However, while the movement attracted millions of followers, it also alienated a number of moderate Christians (Hout and Fischer Reference Hout and Fischer2002; Patrikios Reference Patrikios2008; Djupe, Neiheisel, and Sokhey Reference Djupe, Neiheisel and Sokhey2018). Some of these disaffected Christians become a part of the growing number of “nones” (Djupe, Neiheisel, and Conger Reference Djupe, Neiheisel and Conger2018; Burge Reference Burge2020), while others joined together to create the emergent church movement (ECM), which offered a number of criticisms of conservative Christianity (Marti and Ganiel Reference Marti and Ganiel2014). The emergent critique centered around the concept of objective truth and the interpretation of the Bible, both of which are deeply intertwined with religious authority. Instead of clearly defined leaders, the ECM advocated for a flat organizational structure (Jones Reference Jones2011). In fact, Worthen writes, “Many emergent pastors seem to find the very notion of clergy slightly embarrassing” (Reference Worthen2013, 256). Instead, the ECM places a great deal of emphasis on deliberation and discussion among all members of the religious community (Tickle Reference Tickle2012; Burge and Djupe Reference Burge and Djupe2014). Clearly, the nature of religious authority is a central concern of American religion and Christianity in particular (see Compton Reference Compton2020).
While religious authority may have a tremendous effect on the way congregants view the concepts of conformity and truth, it is also of consequence to the functioning and legitimization of the democratic process. A growing body of research has assessed the role that religious institutions play in encouraging or suppressing dialogue across lines of difference inside the local congregation (Djupe and Neiheisel Reference Djupe and Neiheisel2007; Neiheisel, Djupe, and Sokhey Reference Neiheisel, Djupe and Sokhey2009; Djupe and Olson Reference Djupe and Olson2013; Smith Reference Smith2016). Some scholars have worried that the presence of religious leaders can lead to a reduction in true debate over public policy and an acceptance of the views held by elites (Button and Mattson Reference Button and Mattson1999). If this is the case then religious communities are not helping congregants nurture the cognitive skills necessary to engage in debate around contentious topics in more diverse environments that exist outside the church walls (Putnam and Campbell Reference Putnam and Campbell2012; Bloom and Arikan Reference Bloom and Arikan2012).
Moreover, Owen, Wald, and Hill describe this well when they write, “The passion for order… seems to have led conservative Evangelical leaders to a radical distrust of the very democratic processes they have become adept at using” (Reference Owen, Wald and Hill1991, 81). Scholars have noted that religion may serve as an impediment to the cultivation of democratic values, as it has frequently been related to political intolerance and prejudice toward outside groups (Lipset Reference Lipset1981; Gibson Reference Gibson1992; Hunsberger Reference Hunsberger1996). This has been portrayed as a value conflict as religiously devout members of democratic societies must choose to live under the authority of the church or the state, with democratic authority often taking a subordinate position (Alvarez and Brehm Reference Alvarez and Brehm1995).
Can a member of a religious community be taught to not question their divinely appointed clergy, but be able and willing to respect government officials selected through very deliberative and often contentious democratic processes? From another perspective, the answer is yes. Religious authority may reinforce secular authority through system justification (Jost et al. Reference Jost, Hawkins, Nosek, Hennes, Stern and Gosling2014). In this view, religion is evolutionarily adaptive because it promotes the stability of the social order by inducing complacency or even happiness with the status quo. If God is in control (e.g., Glazier Reference Glazier2015), events are ordained, and leaders are anointed (Djupe and Burge Reference Djupe and Burge2020), then those who rebel against the social order are rebelling against what God has instituted.
Despite the obvious importance of religious authority on the generation or continuation of democratic values, only a handful of studies have been undertaken that endeavor to measure religious authority in a systematic way. This paper proceeds by describing survey data collected from a sample of Christian clergy in 2014, the general population of religious affiliates in 2016, as well as of Protestants in 2019 that contain questions to delineate RAV. We will then compare how RAV relates to other measures of authority (e.g., child-rearing authority), as well as key democratic orientations—deliberative values and democratic norms. Deliberative values consist of the imperative of engaging across lines of difference with mutual respect and full participation. Democratic norms, on the other hand, affirm the importance and rights of the opposition. We expect that RAV will be linked to less support for both deliberative values and democratic norms.
DATA
Our data come from three separate surveys, all conducted online through the Qualtrics interface. The clergy data result from a 2014 survey of clergy invited by email to participate.Footnote 1 We obtained responses from United Methodist Church, Southern Baptist Convention, Reformed Church in America, Presbyterian Church (United States), and Greek Orthodox clergy, religious groups chosen in part by convenience and primarily because they covered a wide range of the Christian religious spectrum. This is clearly not a random sample of clergy, nor are the denominations/traditions present necessarily representative of the American religious population. What is useful about the sample, despite its limitations, is that appropriate questions were asked to gauge religious authority, authoritarianism, religious conservatism, and democratic norm commitment. Moreover, the sample includes considerable diversity of religious and political conservatism.Footnote 2 With appropriate controls, we can test with some confidence our hypotheses about the correlates of religious authority. On the other hand, we have little confidence that the descriptive statistics regarding the levels of religious authority can be generalized directly to a relevant population.Footnote 3 We will still display them, but they should not be taken as necessarily representative of the larger population of clergy.
In March 2016, we surveyed 1,000 citizens from Survey Sampling International's (SSI) online panel. The sample used quotas for Census region and gender distributions. Though technically a convenience sample, the descriptive statistics of the participants (see Table A1 in the Appendix) are largely representative of the national population. We also asked these items in a 2019 sample of 1,010 Protestants collected through Qualtrics Panels. Given that it was limited to Protestants, it is not representative of the nation, but has the useful quality of being drawn from the same side of American religion as the clergy sample.
RELIGIOUS AUTHORITY VALUES MEASUREMENT
The clergy survey contained a battery of questions that reflected an attempt to operationalize religious authority including the various authority zones typical in American religion: religious leaders, congregations, and texts.Footnote 4 We used five statements regarding their orientation toward preserving the authority of the organization, leader, and core beliefs compared to the needs and desires of the congregation and to future members. Response options ranged from “strongly agree” to “strongly disagree,” and included a “neither agree nor disagree” option. These statements can be most accurately described as “values” because each was phrased in terms of how people and institutions should act. We used the following statements: (Organization:) The more clergy can step out of the way of the congregation the better; It is important for the congregation to construct their own salvation; (Belief:) The Gospel is what the congregation makes of it; I believe there are many valid interpretations of the Bible; and (Outreach:) The church must adapt to a postmodern culture in order to spread the Gospel. In total, there were 387 clergy respondents who completed this RAV battery, and the five items hang together reasonably well as an index (α = 0.66). The scale ranges from 1 to 5 (higher values indicating a higher opinion of authority, collapsed to 0–1 for analysis) with values spanning nearly the entire range.
In part due to space considerations as well as the need to translate questions to a general population, we condensed the question set included in the 2016 citizen survey to three statements focused on religious messages: Religious truth is what the congregation makes of it; Religion needs to adapt to the modern culture in order to gain and keep members; and Religion needs to adapt to the modern culture in order to be relevant. Coded so that commitment to authority (disagreement with these statements) is high, the items scaled well (α = 0.83 in 2016) and covered the entire range of the scale from 1 to 5 (collapsed to 0–1 for analysis).
In the Protestant sample, we returned to the same five items as used in the clergy sample. These scaled well (α = 0.80) in contrast to the clergy data, which suggest that clergy have more nuanced views about authority that are tempered by the context in which they are applied. For instance, when he was building Willow Creek megachurch, founding pastor Bill Hybels indicated that he let go a number of traditional Christian symbols and practices in order to make the unchurched comfortable in his auditorium (e.g., Chandler Reference Chandler1989).
DESCRIPTIVE RESULTS
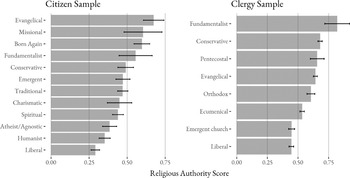
In order to properly situate this measure of RAV, it is helpful to understand how the measurement exists in relation to well understood religious identifiers. The clergy and citizen surveys afforded respondents the opportunity to indicate how they identified themselves religiously. The question was posed, “Admittedly, few people like labels, but would you use any of the following to describe your religious faith?” Respondents were given a number of labeling options, indicated in Figure 1, which displays how religious label identifiers scored on RAV.
Religious authority scores by religious groups identities, clergy and citizen samples
Sources: 2014 Clergy Sample and 2016 Citizen Sample.
Note: Comparison of any two confidence intervals is the equivalent of a 90% test (p = 0.10) at the point of overlap.

In the 2016 citizen sample (left panel), religious authority is most common among self-described evangelical and born-again respondents. Their levels are twice as high (above 0.6) as those who identify as liberal (0.3). Also on the low end of the scale are those who identify as humanist and agnostic. The number of cases is very small for some categories, which helps explain the moderate level of authority expressed by fundamentalist identifiers. In the clergy sample (right panel), those who chose the label “emerging church” scored lower on the scale along with liberal identifiers, while self-identified fundamentalists anchor the high end. It makes sense that evangelicals score no differently than Pentecostals and conservatives. It is interesting to note as well that those who see themselves as “orthodox” indicated a level of religious authority (3.42) that is not statistically different than the overall median for RAV (3.36), a finding that supports the notion that orthodoxy is neither biased toward or against religious authority.Footnote 5
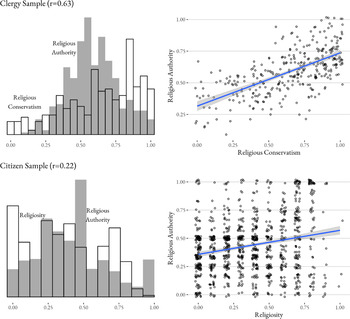
Next, we compare RAV scores among clergy to an index of religious conservatism, constructed along the lines of a vast amount of previous research (e.g., Leege and Kellstedt Reference Leege and Kellstedt1993; Kellstedt et al. Reference Kellstedt, Green, Guth and Smidt1994; Guth et al. Reference Guth, Green, Smidt and Kellstedt1997). These items included biblical literalism, the virgin birth, a belief that Satan exists, and a complementary view of gender roles (for full question wording see the Appendix), which were summed to generate a scale of conservative religious belief (α = 0.92). To begin to understand how these two scales are related, we show both a histogram as well as a scatterplot, which are presented in Figure 2. While there are some similarities between the two measures, there is a significant difference between the distributions of the two scales. The largest concentration of the clergy sample falls between 0.4 and 0.6 on religious authority, but clergy in this sample show considerable religious conservatism (>0.8). While just 15% scored a 0.8 or higher on RAV, over 44% of clergy scored above 0.8 on religious conservatism. There is clearly some independence between the two scales. There is little doubt that there is a positive relationship between religious authority and conservative theology, which the scatterplot shows. However, there is a great deal of heterogeneity in the sample on these measures—there is a near-constant amount of variation around the slope that occupies about 40% of the scale throughout the range of religious conservatism.
Distribution of religious authority by religious conservatism and religiosity

The bottom row of Figure 2 shows the same information for Protestant citizens (2019), though using a religiosity scale instead of religious conservatism. This is a high-religiosity sample, but there is considerable variation in the religious authority that comes with it. And as we would expect, the relationship between the two measures is less clean among citizens, even devout ones. It is positive so that those who display more religiosity also report more religious authority, but we can find every possible combination of the two in the sample, from those with low religiosity and high authority to those with high religiosity and little religious authority.
This quick analysis indicates that those who are theologically conservative and observant also value religious authority at higher rates, which flows logically from the understood positions of evangelical Protestants, who largely agree on questions such as biblical inerrancy. However, there is a significant degree of pluralism in religious authority models across the range of religiosity and religious conservatism.
Since biblical literalism has been used as a measure of authority, it is worth assessing specifically how those views are linked to the components of our religious authority measure. Available in Figure A1 in the Appendix, we find in the Protestant sample that literalism is only closely connected to the textual authority item in RAV (“I believe there are many valid interpretations of the Bible”). Most of the rest are related to literalism, but only weakly and in one case not at all. This is reasonable evidence that RAV is capturing a wider range of authority than does literalism.
RELIGIOUS AUTHORITY AND SECULAR AUTHORITARIANISM
Now we can turn to a direct test of the association between religious authority and authority-mindedness. Authoritarianism is a concept that has long been explored in the field of psychology with research going back to the 1930s identifying an authoritarian disposition and its link to political orientations (Lasswell Reference Lasswell1930; Smith Reference Smith1958). Perhaps the most succinct definition of this concept is “the balance between group authority and uniformity and individual autonomy and diversity” (Stenner Reference Stenner2005, 14). The role that authoritarianism plays is one of the crucial tensions that society wrestles with, “(a) basic human dilemma…common to all mankind” (Duckitt Reference Duckitt1989, 72).
The measurement of this concept has a long and varied history in the psychology literature, with a number of different operational strategies being employed. The earliest appearance of authoritarian measurement was included as part of the F-Scale, which attempted to assess the building blocks of an individual's personality (Adorno Reference Adorno1950). One of the questions touched on parental values for children reading, “Obedience and respect for authority are the most important virtues children should learn.” Subsequent research built upon the theme of child-rearing values (Kohn Reference Kohn1977), believing that, “How to ‘bring up’ children…is a matter of profound consequences” (Martin Reference Martin1964, 86). Subsequently, the use of child-rearing measures to operationalize the concept of authoritarianism has been widely employed (e.g., Feldman and Stenner Reference Feldman and Stenner1997; Stenner Reference Stenner2005; Hetherington and Weiler Reference Hetherington and Weiler2009). Previous work has indicated that while conservatism is typically strongly correlated with increased levels of authoritarian child-rearing, the relationship is complex (Stenner Reference Stenner2005). For example, some work has concluded that conservative Protestants are more willing to use corporal punishment as a way to discipline their children (Ellison and Sherkat Reference Ellison and Sherkat1993; Ellison, Bartkowski, and Segal Reference Ellison, Bartkowski and Segal1996), while other research has indicated that evangelical fathers spend more quality time with their children and express more physical affection (Wilcox Reference Wilcox1998, Reference Wilcox2002). One expectation is that emphasizing religious authority in a religious context may lead religious individuals to desire their children to respect their elders and seek to conform to the larger culture. But if religious authority is to be useful for social science, then it needs to be independent of secular authority-mindedness.
Following in the footsteps of previous scholarship (e.g., Feldman and Stenner Reference Feldman and Stenner1997; Stenner Reference Stenner2005), the survey asked subjects three questions in relation to what values they desired for their own children. Respondents were read the following statement, “Although there are a number of qualities that people feel children should have, every person thinks that some are more important than others. Below are pairs of desirable qualities. Please tell me which one you think is more important for children to have.” The three response pairs were: independence or respect for elders, curiosity or good manners, being considerate or well-behaved. The three response items were combined to create a scale that ranged from 0 to 1 (α = 0.61 for clergy, α = 0.61 for citizens, and α = 0.65 for Protestants), with higher values indicating a more authoritarian approach to child-rearing (clergy mean = 0.37, S.D. = 0.33; citizen mean = 0.55, S.D. = 0.33; Protestant mean = 0.65, S.D. = 0.31).
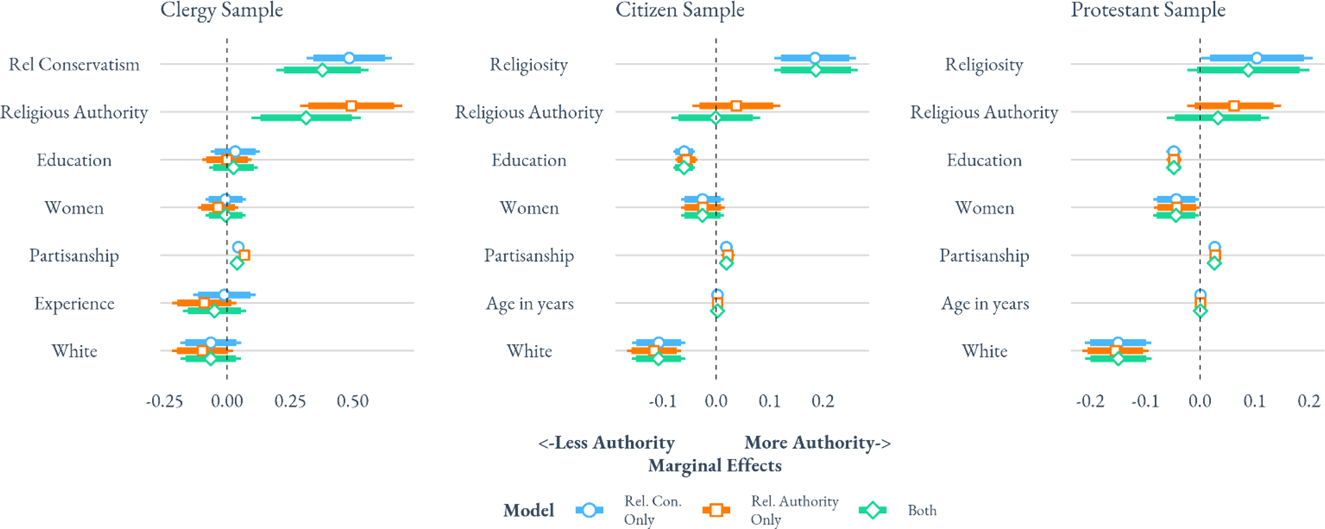
In order to understand how a traditional measure of religious conservatism is related to religious authority, a linear regression was estimated using child-rearing values as the dependent variable. A number of control variables were included that assessed a respondent's years of ministry experience (age for citizens), education level, gender, as well as their partisanship (full question wording is available in the Appendix).Footnote 6 Estimates from three models are displayed graphically in Figure 3—the first includes just conservative theology, the second has the RAV measure, and the final model includes both of these independent variables as a way to see how the two measurements interact (see Appendix Table A3 for the coefficients). If they are highly correlated, then the estimates will shift with the specification. Confidence intervals (90% thick line, and 95% thin line) that do not overlap with the vertical line at zero value indicate which variables have a statistically significant effect.
OLS estimates of authoritarian child-rearing values—clergy and citizen samples
Sources: 2014 Clergy Sample; 2016 Citizen Sample; 2019 Protestant Sample.
Note: Confidence intervals are 95% (thin line) and 90% (thicker line). The circle markers are for a model only including religious conservatism (for clergy) or religiosity (for citizens) and controls. The square markers are for a model with only religious authority and controls. The diamond marker shows results with both religious authority and religious conservatism/religiosity and controls.

In their individual models using the clergy sample, both religious authority and religious conservatism reach statistical significance and are signed positively, indicating a desire to raise children in a more authoritarian manner. The third model, which included both variables, RAV and religious conservatism maintain statistical significance and are positively signed in the direction of seeking to raise children to be more obedient.
This is manifestly not the pattern we see in either citizen sample, where religiosity is positively and significantly linked to child-rearing authority, while RAV is not, regardless of the presence of religiosity in the model. Religiosity also slips to insignificance in the full model using the Protestant sample. These are important results because they suggest the independence of the particular religious form of authority from other dimensions of society where authority may be prized. If they were highly linked, that would indicate that one, comprehensive measure of authoritarianism would suffice.
However, further investigation suggests that the religious authority and religiosity are only delinked from child-rearing authoritarianism among Christians—the religious majority in the United States. Among others, they are both positively related to authoritarian child-rearing values. To us, this suggests that when under pressure from society, those with a distinctive religious tradition depend on a congregation that refuses to bend to the larger culture and generates obedient offspring to continue their cultural heritage. The larger the group, the weaker the linkage, so the conflation of secular and religious authoritarianism is likely to grow with the inverse of group size.
That relationship may also help us understand the religious authority-authoritarianism link among clergy. Clergy appear to see the structure of the church as inherently linked with parenting styles, suggesting that maintenance of their social order hinges on sustaining rightful authority across social institutions. Perhaps it is no surprise that clergy see the social order and the organization of the church as linked, while religious authority is not as central in the lives of the citizen majority. This helps us see that authority considerations are differentiable depending on the salience of institutions and group social status.
RELIGIOUS AUTHORITY AND DELIBERATIVE VALUES
A fruitful place to begin a look at how religious authority structures social life is inside the congregation. A growing amount of social science literature has indicated that religious environments provide opportunities for individuals to engage in dialogue about important theological and political issues on the national stage (Shields Reference Shields2007), at the denominational level (Wood and Bloch Reference Wood and Bloch1995), as well as in the local congregation (Djupe and Neiheisel Reference Djupe and Neiheisel2007; Djupe and Olson Reference Djupe and Olson2013). In addition, clergy have the variable ability to help frame the types of discussions that occur in the church context, by highlighting arguments for and against a position (Djupe and Calfano Reference Djupe and Calfano2012). At least at the congregational level, previous work has found weaker commitment to deliberative values and practices in conservative churches (e.g., Djupe and Neiheisel Reference Djupe and Neiheisel2007), though none of it has explicitly considered the role of religious authority. If a pastor is seen as the “expert” on religious matters, as mentioned above, then deliberation would be fruitless or even counterproductive as the goal would not be about sharing differing viewpoints to inform opinions, but rather the presentation of the right view to set opinions and beliefs. We suspect that religious authority is the crucial consideration structuring support for deliberation in the congregation.
In order to assess this relationship, clergy were asked a series of five statements (wording can be found in the Appendix) that were prefaced with the following question: Do you agree or disagree with the following statements about any adult forums that would be held in your church to address social or political issues? One example was, “It would be essential for participants to learn how to talk through their differences.” These five response items, based on general principles of deliberation used in previous research (Barabas Reference Barabas2004), were summed into a deliberative practices variable (Neiheisel, Djupe, and Sokhey Reference Neiheisel, Djupe and Sokhey2009) that creates a statistically valid scale (for the clergy α = 0.73; for the Protestant sample α = 0.76). This scale then became the dependent variable in a regression analysis using the same modeling strategy from the previous analysis.
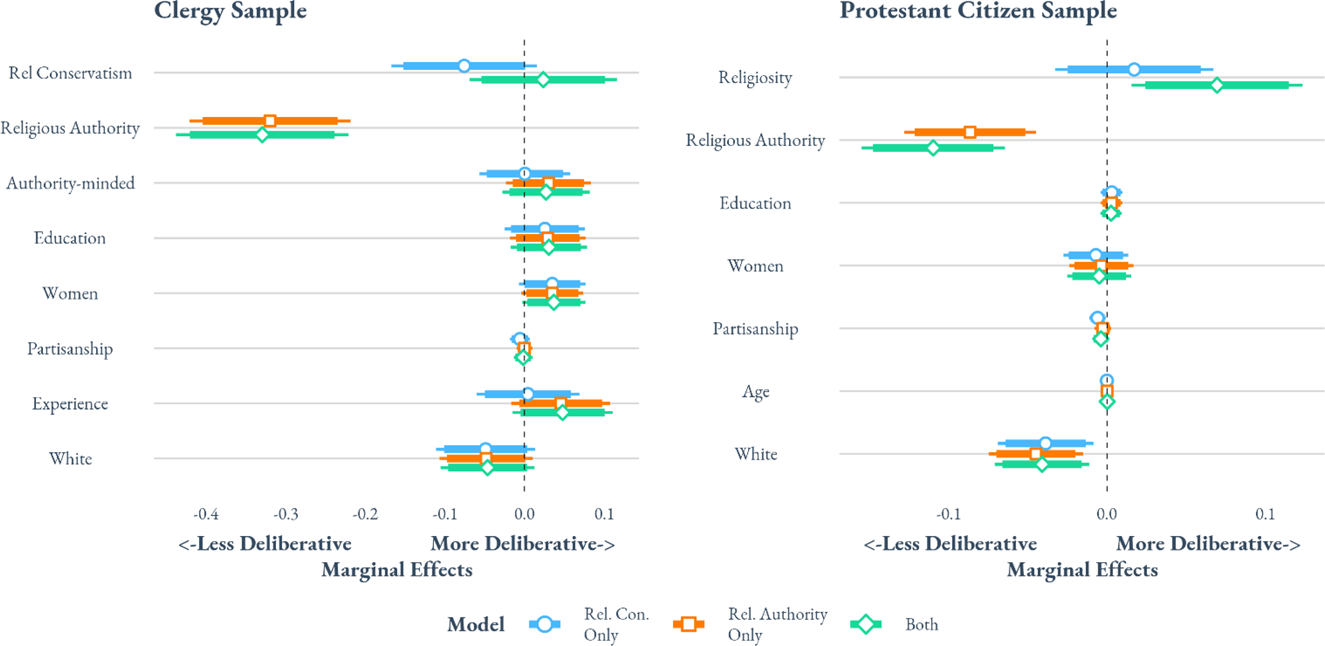
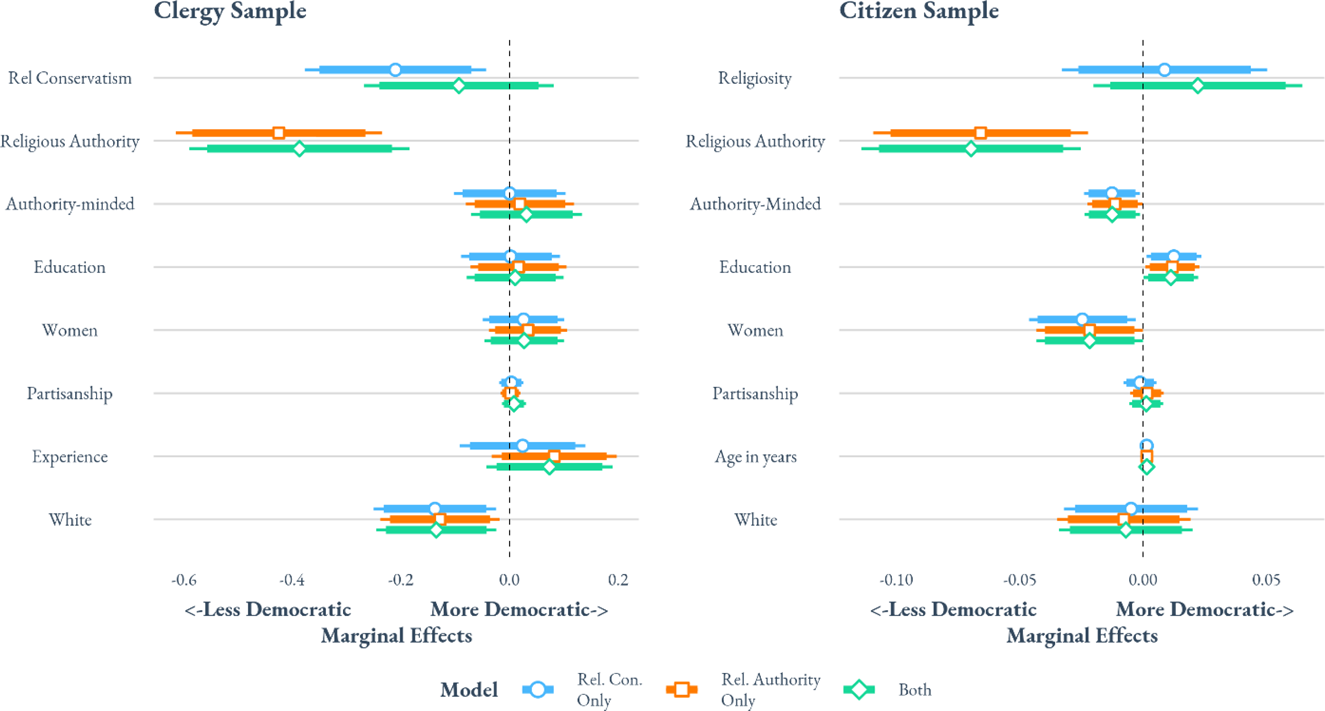
The regression model estimates from three models for clergy and citizens are displayed graphically in Figure 4—in addition to a standard set of control variables, the first includes just conservative theology (religiosity for citizens), the second has the RAV measure, and the final model includes both independent variables as a way to see how the two measurements relate to each other in a single model (see Appendix Table A4 for the coefficients).
Association of religious authority with deliberative values in congregational affairs (OLS)
Sources: 2014 Clergy Sample; 2019 Protestant Sample.
Note: Confidence intervals are 95% (thin line) and 90% (thicker line). The circle markers are for a model only including religious conservatism (for clergy) or religiosity (for citizens) and controls. The square markers are for a model with only religious authority and controls. The diamond marker shows results with both religious authority and religious conservatism/religiosity and controls.

In both the first and second model for clergy, conservative theology and RAV have statistically significant (only at the 90% level for conservative theology) relationships linked to lower deliberative values, although the magnitude is much larger for RAV. For instance, an individual clergyperson who went from the lowest value on the RAV scale to the highest would be nearly 50% less supportive of deliberative values. Under the same conditions, an individual moving from the most religiously liberal to the most religiously conservative would only become 15% less supportive of deliberative values. In the final model with both variables included, conservative theology fails to reach statistical significance, while RAV is clearly significant and gains strength.
The citizen sample reinforces the power of religious authority—higher RAV scores entail less support for deliberation in the congregation. The effect is not as dramatic as it is for clergy, but those with the highest religious authority report about 11% less deliberative intent in their congregations. On the other hand, religiosity has no effect by itself, and once we control for religious authority, the effect of religiosity is positive and significant, predicting a greater degree of deliberation. It is no surprise that those engaged would think that congregational life was more inclusive (see also Neiheisel, Djupe, and Sokhey Reference Neiheisel, Djupe and Sokhey2009; Ben-Nun Bloom and Arikan Reference Ben-Nun Bloom and Arikan2013), but the relationship would not otherwise be discoverable given the association of religiosity with religious authority.
RELIGIOUS AUTHORITY AND DEMOCRATIC NORMS
We turn now to the concept of democratic norms—shared understandings that enable democratic governance to work, including openness to opposition and free speech (Prothro and Grigg Reference Prothro and Grigg1960; McCloskey Reference McClosky1964). Previous literature has indicated that churches are especially capable of helping congregants construct a worldview, not just in a religious context but in all aspects of society (Wald, Owen, and Hill Reference Wald, Owen and Hill1988), through a combination of intentional messaging as well as formative experiences through small group activities (Wuthnow Reference Wuthnow1996) and informal interactions that take place among church members (Djupe and Gilbert Reference Djupe and Gilbert2009). These exposures subtly push church-goers to consider their role, as well as the place of the church, in a democratic society. If “churches can be considered microcultures that showcase the promise and perils of democracy” (Djupe and Calfano Reference Djupe and Calfano2012, 95), then the way that authority is structured there may be tremendously important to how individuals perceive the requisites of democracy in the larger environment.
We constructed a scale using four questions that have been used in previous research (Arceneaux Reference Arceneaux2008) that assessed how supportive clergy and citizens were of democratic norms (Djupe and Calfano Reference Djupe and Calfano2012). Each subject was given four response options ranging from strongly disagree to strongly agree for the following statements:
• It's very important that politicians air their differences of opinion publicly.
• You can't have democracy without political opposition.
• You can't be sure an opinion is correct unless people are free to argue against it.
• Unless many views are presented, there is little chance that the truth can ever be known.
These four items were combined into a scale that hangs together well (α = 0.79 for clergy; α = 0.73 for citizens) and finds modest support (mean = 0.62, S.D. = 0.25 for clergy; mean = 0.69, S.D. = 0.17 for citizens). As with the previous analyses, this scale of democratic norms then became the dependent variable in a set of models, the results of which are graphically displayed in Figure 5 (see Table A5 for the coefficients).
Association of religious authority with democratic norms (OLS)
Sources: 2014 Clergy Sample; 2016 Citizen Sample.
Note: Confidence intervals are 95% (thin line) and 90% (thicker line). The circle markers are for a model only including religious conservatism (for clergy) or religiosity (for citizens) and controls. The square markers are for a model with only religious authority and controls. The diamond marker shows results with both religious authority and religious conservatism/religiosity and controls.

In both the first and second models among clergy, religious conservatism and RAV predict lower levels of democratic norms. However, the magnitude of the effect for RAV is twice that of religious conservatism. The finding that religious conservatism drives down democratic norms supports previous descriptions of theological conservatives and their overall reluctance to listen to alternative points of view (e.g., Sherkat and Ellison Reference Sherkat and Ellison1997), but this finding shifts in the full model. When both religious conservatism and religious authority are included in a single model, religious conservatism does not achieve statistical significance, while RAV both maintains significance at the p < 0.05 level and the previous effect size. The overall magnitude of RAV's effect is substantial with an individual clergyperson moving from the lowest level of RAV to the highest becoming 25% less supportive of democratic norms. Taken together with the previous discussion of deliberative values, this finding provides strong evidence that there is an additional component provided by religious authority that is essential to consider separately from general religious conservatism.
The citizen sample models tell a similar story about religious authority. In both models, with and without religiosity, greater RAV is linked to less support for democratic norms. In contrast, religiosity has no effect on democratic norms support in either model. Notably, the magnitude of the RAV effect is much reduced from the clergy model—it's about a quarter of the size. There are two likely reasons why. First, clergy are often quite educated and sophisticated in their thinking about politics—several sources consider them elites (e.g., Guth et al. Reference Guth, Green, Smidt and Kellstedt1997; Djupe, Burge, and Calfano Reference Djupe, Burge and Calfano2016)—and the consistency of their worldviews bears this out. Second, religious authority, specifically, should have a stronger effect on clergy since the congregation is the center of their world. The weaker effect among citizens suggests that religion is just one institution among many in their lives, such as the family and work. This interpretation involving institutional salience might also help explain why child-rearing authority is linked to less democratic norm support among citizens but not among clergy.
A CONNECTION TO CLERGY AS REPRESENTATIVES
RAV has been linked to less democratic and deliberative orientations, both of which are individual norms. We can pursue one more test to assess whether those with high religious authority elevate religious leadership as a substitute for secular political leadership. That is, we suspect they would be more likely to see their religious leaders as their political representatives. Seeing clergy as their representatives is not undemocratic in itself—there is a long, democratic tradition of religious interests active in American politics. But combined with democratic norms, this may help separate support for Father Caughlin from Father Drinan.
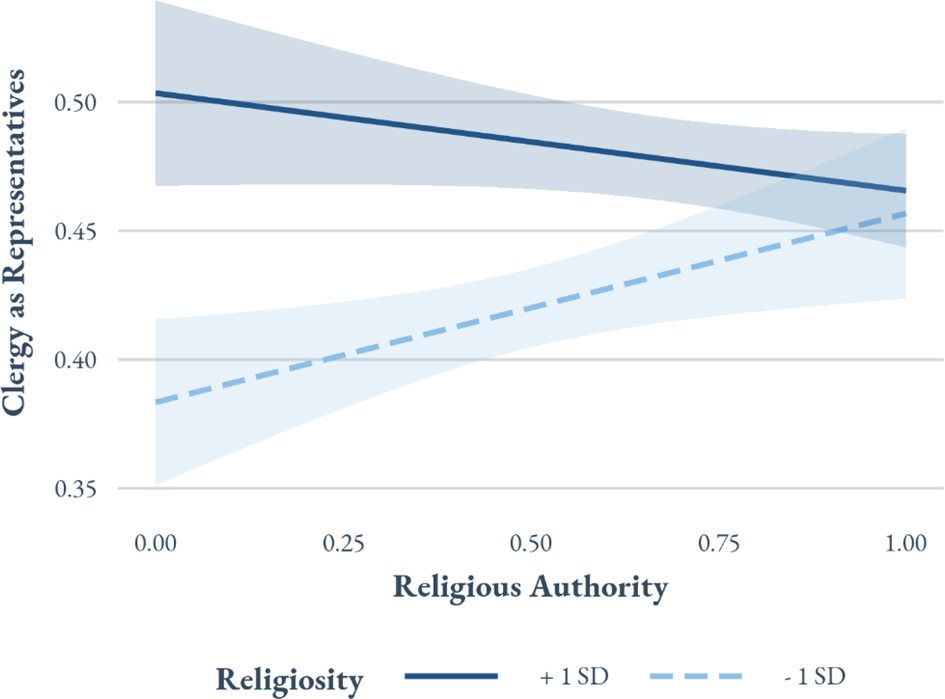
Adopting three measures used in prior research (Djupe, Burge, and Calfano Reference Djupe, Burge and Calfano2016), we assessed with the Protestant sample whether RAV is linked to an index of seeing clergy as public representativesFootnote 7 using the same basic model used in earlier analyses (see Table A6 for the results). The results in Figure 6 show a significant interaction between religiosity and RAV, suggesting there are multiple routes to relying on clergy as representatives. In one route (solid line), involvement in the congregation is high and religious authority levels are immaterial. In the other path, higher religious authority scores absent high involvement drive up reliance on clergy (dashed line). They do not amplify each other. Instead, religiosity and religious authority can substitute for each other, with both experience and ideation promoting clergy as political representatives.
The substitutive roles of religious authority and religiosity on views of clergy as political representatives
Source: 2019 Protestant Sample.
Note: Comparison of any two confidence intervals displayed are the equivalent of a 90% (p = 0.10) test at the point of overlap.

CONCLUSION
In this paper, we introduced a new measure of religious authority meant to disentangle what has long been presumed to be a part of conservative religious worldviews. Research over the decades has used any number of proxies for religious authority, including secular as well as religious measures, providing error-prone estimates and surely weaker-than-true effects of the phenomenon. Reinforcing that view, our results suggest that religious conservatism and high religiosity are only modestly correlated with our measure of religious authority and have generally independent effects on variables of interest.
We focused on democratic concepts in part because the tension between religious and secular authority is a key concern about the place of religion in modern democracies (e.g., Stepan Reference Stepan2000). It is the question asked of every single candidate with a religious minority affiliation—can they set aside the dictates of their faith and loyally serve secular authority, such as the US Constitution and democratic government? Supporting democratic institutions and processes may be particularly hard for those high in religious authority since the outcomes are not pre-ordained nor guaranteed to reach the “right” conclusion. The results suggest that this classic tension is founded—those with higher religious authority scores are less likely to inhabit deliberative environments, are less supportive of democratic norms, and are more supportive of religious leaders for political information and leadership.
There are a number of lines open for investigation regarding the prediction of religious authority and its effects on social and political phenomena. It is important to understand the degree to which RAV is dispositional and can be transported from place to place and whether RAV is shaped by contextual forces. For instance, do individuals augment religious authority when other sources of authority are disappointing or unrepresentative? To what degree does the quality of clergy leadership and congregational polity affect religious authority? We also recommend further work building from Cassese and Holman's (Reference Cassese and Holman2017) work on gendered religious authority toward other groups and with the new measurement of the concept developed in this paper.
Religious authority measures could be transported into other subfields in religion and politics. For example, the work in the field of religion and political tolerance has largely focused on biblical literalism as the primary measure of religious closed-mindedness (Wilcox and Jelen Reference Wilcox and Jelen1990; Eisenstein Reference Eisenstein2006; Burge Reference Burge2013). Religious authority is a more direct measure of that concept and may illuminate a more nuanced understanding of the linkage between religious belief and political tolerance.
Moreover, religious authority may act as a key intervening variable that shapes the uptake of communication from religious sources. Are those who score high on religious authority more susceptible to persuasive communication? This is a particularly important question to ask since it may help disambiguate religious effects—religiosity helps expose people to communication, while religious authority may motivate adoption of that communication. Along these lines, in experimental studies of religious communication where exposure is controlled, we would expect effects to be conditioned by religious authority.
Supplementary material
To view supplementary material for this article, please visit https://doi.org/10.1017/S1755048321000031