

Introduction
During the SARS-CoV-2 pandemic, multiple healthcare systems reported the need for surge planning or exceeded their capacity to care for critically ill patients. As observed in other severe disease outbreaks like SARS, Reference Murthy, Gomersall and Fowler1–Reference Booth and Stewart4 this is driven by shortages in physical space, equipment, and trained personnel. As a result, multiple strategies have been employed to help decompress these overburdened healthcare facilities. Many of the early solutions in the U.S. involved recruitment and redeployment of personnel to overburdened facilities due to concerns about safe transport of COVID-19 patients. However, while mitigating personnel shortages, it did not address shortages of physical space, supplies, and equipment.
A potential solution is the creation of additional temporary field hospitals, ideally supervised by a central control center, in a hub-and-spoke model to spread expert knowledge across a larger area. This model, which has previously been studied in telemedicine with signs of successful implementation, is now being studied in the setting of COVID-19. Reference Dave, Cagniart and Holtkamp5,Reference Sossai, Uguccioni and Casagrande6 However, with the ongoing pandemic, it is difficult to conduct high quality iterative testing of this model, but simulation affords a powerful tool to allow for expedited testing of such a solution.
Our group has previously demonstrated how high-fidelity simulation can be used to evaluate safety and effectiveness in EHR use. Reference Stephenson, Gorsuch, Hersh, Mohan and Gold7–Reference Bordley, Sakata and Bierman9 Using simulation allows for, not only vetting of connectivity issues, but also testing the effectiveness of asynchronous training, and usability of the system in context of the workflow for which the system will be used. We have previously described the ability to integrate EHRs into high fidelity simulation to understand its usability, also to understand the workflows of multiple professional groups, as well as test the effectiveness of education and onboarding. Reference Bordley, Sakata and Bierman9–Reference Miller, Scholl, Corby, Mohan and Gold11
Therefore, the purpose of this study was to assess the clinical usability of a comprehensive, rapidly deployable electronic health record in a field intensive care unit, and provide capacity for remote export consultation through the use of simulation.
Methods
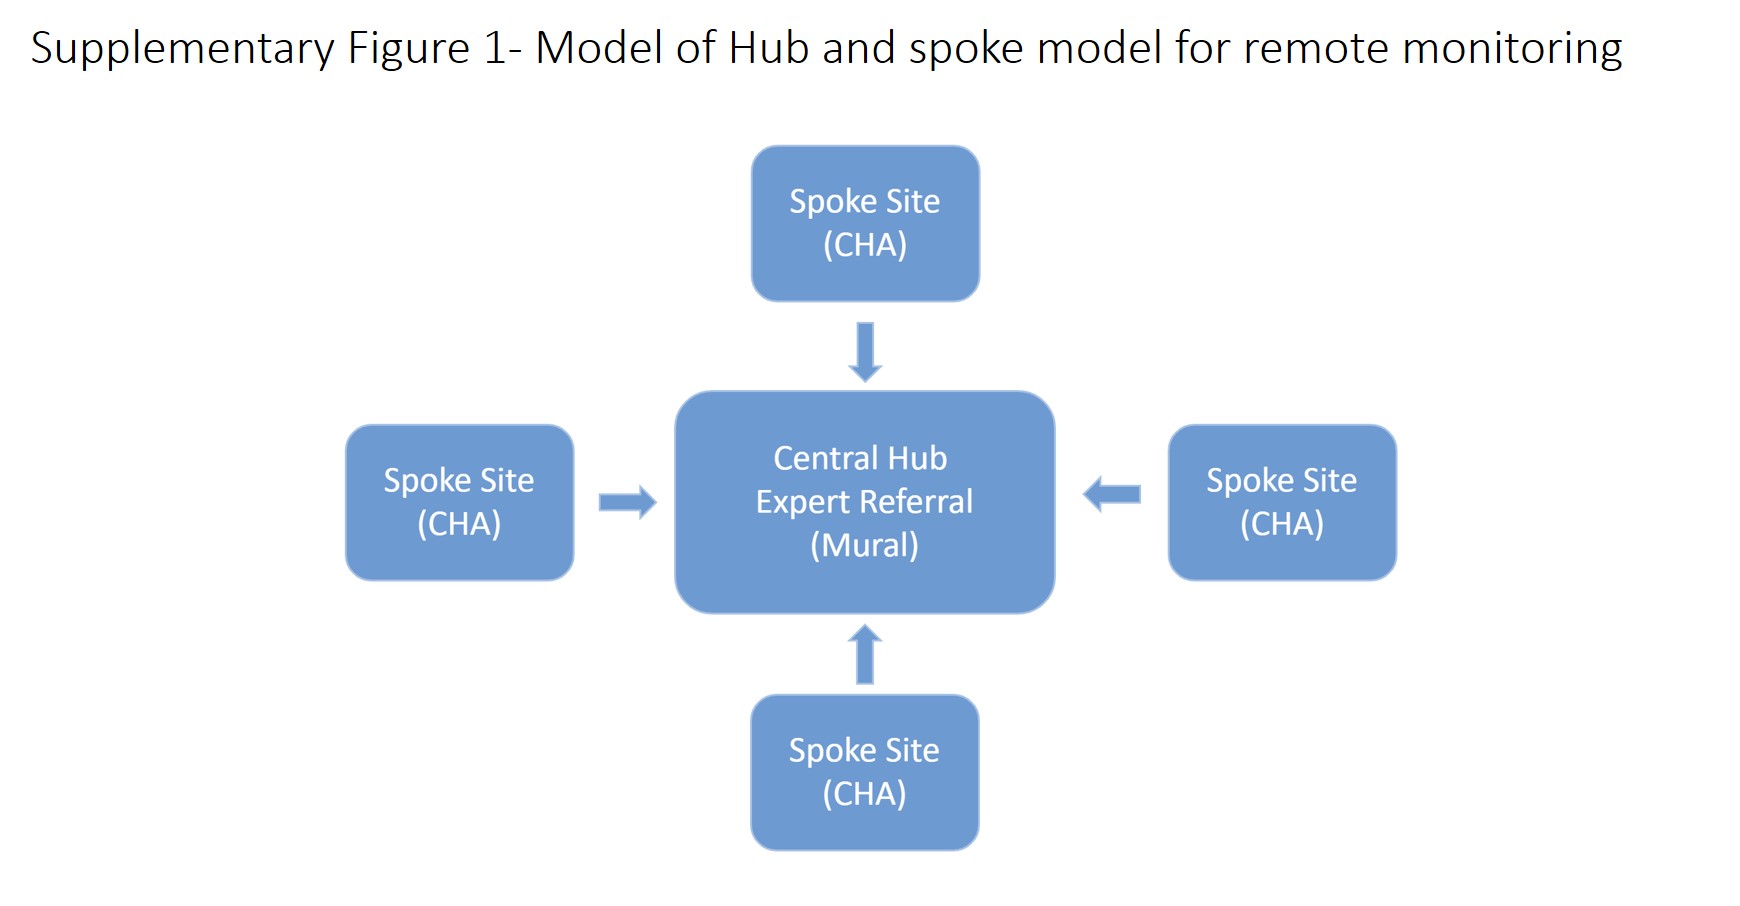
The creation of this model system was completed in collaboration with General Electric Healthcare (GEHC), and Oregon Health and Sciences University (OHSU). All studies were approved by the OHSU Institutional Review Board. The system was based on a hub-and-spoke model of remote monitoring (Supplementary Figure 1). For the ‘hub site’ software, we employed Mural, a virtual ICU platform developed by GEHC. It originated as an idea of a surveillance monitoring software that could be utilized in a virtual ICU setting. It evolved from a proof of concept in late 2019 to real-world testing at OHSU immediately prior to COVID-19. It is an integrated system that displays vital signs, ventilator data, laboratory values, and continuous waveform data. Usability of Mural was assessed during initial proof of concept deployment in which OHSU Medical Intensive Care Unit (MICU) beds were connected and remotely monitored during daytime shifts for 6 weeks by both a physician and nurse. All subjects were emailed a survey at the end of their shift including a System Usability Scale.
For the ‘spoke site’ software, we employed Centricity High Acuity health system (CHA). Deployed in over 200 hospitals outside the United States, this EHR allows for primary documentation and capture of physiologic, medication, and laboratory data mimicking a low level of integration similar to a pop-up field hospital. Due to the current use in live patient care environments, we considered functionality testing complete. To accommodate an American care delivery system, we utilized OHSU subject matter experts (SMEs), from physician and nursing backgrounds, to make appropriate customizations with significant attention to terminology and workflows as these differed greatly from a European product. The majority of changes were surrounding laboratory and value units, disease terminology, and creation of a more U.S. centric formulary.
Mural CHA-Integration was performed in the testing environment to validate the application programming interface (API) for a seamless data transfer between CHA and Mural. This consisted of a member of the study team manually creating and admitting a patient in CHA and documenting a series of laboratory, ventilator, and hemodynamic data and validating their presence in Mural.
With this CHA-Mural environment now established, the study team created a series of patient charts containing numerous days of physiologic, laboratory, and ventilator data, designed to test safe and effective her. Reference Stephenson, Gorsuch, Hersh, Mohan and Gold7–Reference Bordley, Sakata and Bierman9
Using mock patients, a series of educational videos were designed to cover the critical skills clinicians will require in order to use the system for basic documentation and data extraction. Once created, each video was checked by at least 3 members of the study team for accuracy, audio clarity, and visual clarity (desktop, tablet, and phone interface). These were located on an internal server that could be accessed by the participants prior to their simulation.
With the environment setup and training videos completed, the study team created a set of Key Performance Indicators (KPIs) as a means of defining minimal requirements for proficiency. These were established based on expert opinion of the documentation and ordering requirements for an intubated patient with ARDS to follow standard of care practices in the treatment of severe COVID patients. Once the KPIs were identified, a robust case-based scenario was created. Participants (N = 5) were recruited from the OHSU ICU nursing and physician pool. After obtaining informed consent, each subject was provided a dedicated computer terminal to view the CHA instructional videos (totaling 51 minutes) (Supplementary Table 1). No direct instruction on the use of CHA was provided by any member of the study team. After asynchronous training, each practitioner underwent the simulation in a generic patient room with a low fidelity mannequin, a patient monitor (Laerdal Patient monitor), and Avea 840 ventilator attached to test lung in the OHSU simulation center. Contacting a remote provider was completed through the use of Microsoft (MS) Teams to simulate video call technology.
The subjects were provided a brief orientation to the simulation theater and an overview of the tasks (KPIs) to be completed. These included: entering vital signs (simulation monitor), ventilator parameters (simulation ventilator), laboratory results (paper), intake and output values, a Richmond Agitation-Sedation Scale (RASS) score, and a Confusion Assessment Method-ICU (CAM-ICU) score (paper). Additionally, physicians were asked to enter 2 orders, while nurses were asked to document an hourly physical exam and adjust the rate of a sedative infusion. All participants were provided with access to MS Teams and instructed to contact a member of the study team (serving as the remote provider) if they had any questions. If, by the end of data entry, they did not initiate a conversation with MS Teams, then the remote provider initiated a conversation to establish their ability to use both chat and video functions. At the conclusion of testing, each subject completed a System Usability Scale (SUS), National Aeronautics and Space Administration-Task Load Index (NASA-TLX), and a general satisfaction survey. For these studies we used unweighted NASA-TLX and reported only raw data, given its ease of use and strong correlation to the more traditional weighted version. Reference Moroney, Biers, Eggemeier and Mitchell12
During the duration of the simulation, participants’ actions were recorded with screen capture software and/or Tobii Pro Glasses 2 to capture the point of view of the participant. Post-simulation analysis was completed by a team member. Reviews composed of watching the recorded simulations and documenting a timestamp for each screen change. We defined a screen as a user interface setup in which the contents were displayed until the user takes a new action, like clicking a button, and the content displayed changed. After compiling the full lists of screens visited, we identified the number of unique screens or locations within the EHR which were utilized by our participants, and counted the total number of visits to each unique screen to get total number of screens. Each video was reviewed a second time for confirmation of time stamps for data accuracy and compiled for further analysis. All data was analyzed with GraphPad Prism and presented as Mean + SEM. Correlations were analyzed by Pearson’s correlation.
Results
The System Usability Scales (SUS) of the Mural central monitoring system had a mean of 64.38 + 7.4 for physicians (MD) and 57.3 ± 6.5 for nurses (RN) (Figure 1) (Total N = 21). More than 50% of all users had a SUS > 70, thus considered the threshold for user acceptance.
Usability analysis for hub system.
Physicians (N = 8) and Nurses (N = 12) completed System Usability Scale at end of shift working with the Mural Remote monitoring platform. Results presented as Mean + SEM.

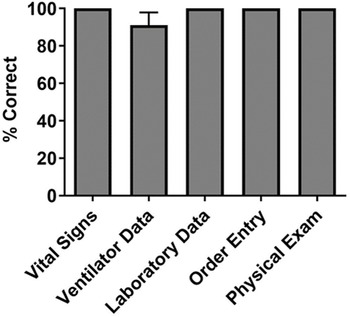
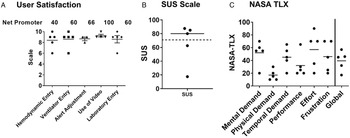
While measuring spoke site software (CHA), we found that subjects had achieved 100% task completion on all domains except ventilator data at 91% (Figure 2) during their simulation. This was associated with a mean of 20.8 ± 1.2 min in time to completion. Navigation patterns of CHA captured through screen recording software showed a mean of 17.8 unique screens and 43.8 total screens visited during the simulation (Figure 3), with the average user visiting each screen 2.4 times. Usability of the spoke site software (CHA) as determined by the SUS was 66.5 ± 13 (Figure 4A). This was associated with a high degree of user satisfaction with a mean score of 8.7 ± 0.2 correlating to a mean Net Promoter score of 65.2 (Figure 4B). The use of EHR was associated with a low degree of cognitive load as determined by an unweighted NASA-TLX, with domain score ranging from 17 - 57 and an unweighted global score of 41.5 ± 6.8 (Figure 4C). The number of unique screens required, correlated significantly with the Frustration component of the NASA-TLX (P = 0.04). Finally, the ratio of total number of screens to unique screens correlated with the Global NASA-TLX score (P = 0.008, R = 0.96), and the total number of screens approaches statistical significance to Global NASA-TLX scores but fails to reach significance (P = 0.08 for total screens, R = 0.82) (Figure 5).
Completion of key performance indicators during simulation.
A total of 5 subjects, 3 physicians, and 2 nurses reviewed instructional videos for CHA and then completed high fidelity simulation to complete a series of professional specific data entry elements into CHA. Completion of tasks assessed via review of the chart after the simulation. Results presented as Mean + SEM.

Screen utilization during simulation.
A total of 5 subjects, 3 physicians, and 2 nurses reviewed instructional videos for CHA and then completed high fidelity simulation to complete a series of professional specific data entry elements into CHA. Screen navigation captured through video screen capture. Unique and total screens were recorded via manual review.

Perception of EHR utilization during simulation.
A total of 5 subjects, 3 physicians, and 2 nurses reviewed instructional videos for CHA and then completed high fidelity simulation to complete a series of professional specific data entry elements into CHA: Panel A- User Satisfaction for each major activity for system use was assessed by Net Promoter Score. Net Promoter found at the top of the column; Panel B- System Usability Scale (SUS) for each subject; Panel C- Unweighted NASA-TLX with data representing each component and total composite score. Data was presented as individual data point and mean.

Correlation between screen navigation and cognitive load.
Panel A- Correlation between Frustration component of NASA-TLX and unique screens; Panel B- Correlation between Global NASA-TLX and total screens; Panel C- Correlation between Global NASA-TLX and ratio of total/unique screens. Data analyzed by Pearson correlation.

Discussion
The most important finding was our ability to rapidly create and deploy asynchronous learning modules as a model of deployment of an EHR for simulated field hospitals and remote locations, while maintaining end user proficiency and satisfaction. Among several others, 1 of the key aspects of our study is a successful proof of concept of a video-based curriculum replacing the traditional classroom model while maintaining end user competency as documented by task completion. We feel that this model may be ideal in situations like disasters or pandemics where there may be logistical or medical reasons preventing large groups of people from aggregating. Over the last few decades, we have seen a variety of natural disasters and international medical crises where an agile healthcare delivery mechanism seems necessary and optimal. This proposed model of distribution, and its adaptive nature, is able to overcome traditional hurdles in rapid deployment. More importantly, early aggressive interventions seem to help limit expansion of disease, thus postulating the ability to improve outcomes if EHR build and training is a rate limiting step.
We were able to demonstrate efficacy of the training videos through the use of high-fidelity simulation focused on task completion of specific key performance indicators (KPIs). These KPIs, and the simulations, were designed specifically to recapitulate the workflow for both physicians and nurses during the routine care of a critically ill patient. The overall 100% completion rate of all tasks (excluding ventilator documentation) with only asynchronous training from the videos, demonstrates the feasibility of rapidly deploying this technology in case of further emergencies. The incomplete ventilator documentation seen in our simulation was likely related to a change in practice for our staff as OHSU nursing does not currently chart ventilator data and plateau pressure, leaving both uncharted and thus considered a null value. This highlights the importance of integrating the training of new technology with any purported changes in workflow to ensure effective adoption of the technology. This also highlights the known differences between professional groups in use and adoption of EHRs in general, emphasizing the importance of initial testing to include representation from all relevant groups who will be utilizing the technology. Reference Sakata, Stephenson and Mulanax8,Reference Collins, Bakken, Vawdrey, Coiera and Currie13,Reference Collins, Stein, Vawdrey, Stetson and Bakken14
Overall, completion of the tasks required approximately 17 unique and 44 total screens. We have previously demonstrated that the number of screens employed correlated strongly with the ability to effectively gather information, Reference Gold, Stephenson, Gorsuch, Parthasarathy and Mohan15 however, this exercise focused predominantly on data entry limiting the ability to infer any clear conclusions from our current data set. The simulation also involved intentional repetition of certain data entry elements which confounds an interpretation from the number of times a user visited each screen (average 2.4).
EHR proficiency is 1 very important metric. Our data also shows a high degree of overall satisfaction with usability exhibited by a mean SUS for both CHA and Mural of 66.5 and 64.5 respectively. These findings exceed the 46 that is reported literature for typical EHRs and nears the ideal threshold of 75 for usability of electronic devices. Reference Melnick, Harry and Sinsky16–Reference Brooke, Jordan, Thomas, Weerdmeester and McClelland18 Despite an exclusively non-traditional teaching model, the overall cognitive load remained acceptable with an unweighted NASA-TLX within goal ranges and in line with other studies. Reference Hart19–Reference Hudson, Kushniruk and Borycki21 However, correlation between the ratio of total unique screens and NASA-TLX score suggests further opportunity to reduce cognitive load. Similarly, the statistically significant increase in frustration with an increasing number of unique screens may act as a marker suggesting further improvement in curriculum design and education, in order to improve navigation patterns and reduce overall cognitive burden. However, the small numbers of participants and varied professional groups make it difficult to determine whether this association was driven by unfamiliarity with the workflow (e.g. nurses not being comfortable documenting ventilator data), and/or issues with the design of spoke site software (CHA) which was used as the software for data entry in a field hospital setting. The design of the study, which requires returning to certain screens in order to re-enter data, also acts as a confounder to interpretation of the screen data. This will be the subject of future studies, as our data provides a baseline for testing future iterative design. Nevertheless, we feel that asynchronous training can be completed while maintaining appropriate proficiency and satisfaction.
As the U.S. healthcare system has evolved, large healthcare systems have demonstrated increasing success using a hub-and-spoke model to provide high quality care over a large geographical region. This model has provided care to under-served regions that would otherwise not be able to receive specialist care. There is evidence that tele-critical care may reduce morbidity and mortality through improved adherence of best practices. Reference Lilly, Cody and Zhao22 Pre-COVID studies focused primarily on installation of remote monitoring systems in existing brick and mortar facilities, and integration with an existing electronic health record (EHR). However, in the setting of a disaster such as COVID-19, field hospitals will not have this infrastructure, especially as it relates to the EHR. This is a critical component of any hub-and-spoke model. With limited or absent device integration such as manual entry vitals, labs, and medications; it is the only way of transmitting such information. Many systems have poor usability and require significant time for staff to be comfortable with use. In 1 study, surgical residents were found to have spent over 2500 hours during their surgical training equating to almost 32 weeks of working 80 hours prior to achieving self-perceived competence with the EHR. Reference Watson, Elhage, Green and Sachdev23 Consequently, any rapidly deployable solution should contain a simple, easy to learn EHR at the spoke sites to allow for essential data gathering at point of care, and an EHR agnostic hub site allowing for inputs from many systems, so as to allow remote monitoring of both field hospitals and rural/remote brick and mortar facilities.
Ideally, we feel this solution should be able to fully and rapidly deploy virtual training and instruction asynchronously. However, with the current experiences of the COVID-19 pandemic and the resultant strict social distancing guidelines which are being used to limit spread of the virus, the entire economy has needed to innovate. This has forced us to reevaluate the traditional training paradigm of group-based classroom teaching and establish safe, effective education, using modern technologic advancements. New teaching models using an entirely video-based EHR curriculum have not been well studied, yet have a distinct advantage under these circumstances due to issues with safety of large gatherings in a pandemic.
The primary limitation to this study is that we are unable to determine whether the results and usability achieved in our simulations would translate to real world deployment. Not only does participation in a simulation induce a Hawthorne effect which may over estimate success, it also fails to induce the cognitive stress induced by the sociotechnical factors encountered during a true mass disaster including maladaptive provider/patient ratios, fatigue, and burnout. It also failed to capture the additional workload induced by note creation or billing, both of which have been well documented to cause significant stress for providers with use of the EHR in the ambulatory environment. Our simulation design also explicitly avoided any assessment on clinical decision making, instead, it focused on pure data entry as a means of communicating with a hub site with aim to avoid poor assessment confounding the data. This leaves any assessment on the influence this software suite has on making appropriate decision making beyond the scope of this paper. With the creation of this testing environment, we have been able to prove interoperability across the suite of applications, thereby removing this step from further evaluations and allowing immediate deployment for further study or real-time use. Additionally, the framework of the simulation environment allows for further rapid iterative redesign based on real world feedback.
Conclusion
We successfully created a simulated hub-and-spoke critical care model system in which we maintained end user satisfaction while achieving competency of core documentation items through the use of a short, exclusively video based, asynchronous set of learning modules. Based on these results, we feel this modeled approach should be considered when there is need to provide a rapid or remote response to a disaster scenario.
Supplementary Material
To view supplementary material for this article, please visit https://doi.org/10.1017/dmp.2021.302