Introduction
During the last decade focus has been put on sow longevity due to its economic and ethical importance. Increased sow longevity results in improved use of fewer animals, which reduces the costs in piglet production and thereby increasing net income for the farmers. In Sweden, 50% of the commercial crossbred sows are annually removed (Engblom et al., Reference Engblom, Lundeheim, Dalin and Andersson2007), which is similar to Europe and North America (Boyle et al., Reference Boyle, Leonard, Lynch and Brophy1998; Lucia et al., Reference Lucia, Dial and Marsh2000; Rodriguez-Zas et al., Reference Rodriguez-Zas, Southey, Knox, Connor, Lowe and Roskamp2003). In addition, mainly young animals are removed; about 15% to 20% of the removed sows have produced only one litter (López-Serrano et al., Reference López-Serrano, Reinsch, Looft and Kalm2000; Lucia et al., Reference Lucia, Dial and Marsh2000; Engblom et al., Reference Engblom, Lundeheim, Dalin and Andersson2007). The main reason for removal is reproductive failure, accounting for 30% of the removal, and most of this is in low parity numbers (Boyle et al., Reference Boyle, Leonard, Lynch and Brophy1998; Lucia et al., Reference Lucia, Dial and Marsh2000; Engblom et al., Reference Engblom, Lundeheim, Dalin and Andersson2007).
Sows need to become more robust to be able to stay and produce well in the existing production systems. Improved genetic potential would give a higher upper limit of longevity regardless of the environment. Recent studies have shown that selection for sow longevity should lead to improvement (Heusing et al., Reference Heusing, Hamann and Distl2005; Serenius et al., Reference Serenius, Stalder and Puonti2006; Tarrés et al., Reference Tarrés, Bidanel, Hofer and Ducrocq2006). Selection can be direct for longevity and stayability, or indirect through selection for component traits such as reproduction and conformation. To compare the efficiency of direct and indirect selection for sow longevity, parameters such as heritability and correlations to other traits need to be known.
Heritability for longevity has been reported to range from 0.1 to 0.4 (López-Serrano et al., Reference López-Serrano, Reinsch, Looft and Kalm2000; Serenius and Stalder, Reference Serenius and Stalder2004; Heusing et al., Reference Heusing, Hamann and Distl2005). Favourable genetic correlations between longevity and reproductive traits (e.g., litter size and farrowing intervals) (Tholen et al., Reference Tholen, Bunter, Hermesch and Graser1996; Serenius and Stalder, Reference Serenius and Stalder2004; Heusing et al., Reference Heusing, Hamann and Distl2005) as well as between longevity and osteochondrosis/leg score (López-Serrano et al., Reference López-Serrano, Reinsch, Looft and Kalm2000; Yazdi et al., Reference Yazdi, Lundeheim, Rydhmer, Ringmar-Cederberg and Johansson2000a; Serenius and Stalder, Reference Serenius and Stalder2004), have been reported. The genetic correlation between sow longevity and growth rate recorded at performance testing was found to be significant and unfavourable (i.e., high growth rate was associated with inferior longevity) in one study (López-Serrano et al., Reference López-Serrano, Reinsch, Looft and Kalm2000), whereas another (Serenius and Stalder, Reference Serenius and Stalder2004) found no significant association. The genetic correlation between sow longevity and backfat thickness recorded at performance testing was found to be unfavourable (i.e., thin backfat depth was associated with inferior longevity) for Large White (López-Serrano et al., Reference López-Serrano, Reinsch, Looft and Kalm2000; Serenius and Stalder, Reference Serenius and Stalder2004), but for Landrace, only López-Serrano et al. (Reference López-Serrano, Reinsch, Looft and Kalm2000) found a significant (unfavourable) correlation.
Longevity is of most importance in commercial piglet-producing herds. However, traditionally, breeding evaluation is based solely on information from purebred sows in nucleus and multiplier herds. Purebred sows in nucleus and multiplier herds are generally replaced early in life, i.e., with younger sows possessing better breeding values, to maximize genetic improvement. Therefore, different removal strategies may result in longevity being a different trait for crossbred sows, in the piglet-producing herds, than for purebred sows, which are higher up in the breeding pyramid.
The aim of this study was to estimate genetic parameters of longevity from Swedish crossbred sows to examine the possibilities of selecting for this trait.
Material and methods
Herds
The study is based on data from 16 commercial piglet-producing herds, in the south-central part of Sweden. All these herds bought their genetic material from the Swedish pig-breeding organization, Quality Genetics (QG; Hörby, Sweden). Data from these 16 herds have also been included in a larger study (21 herds) investigating the longevity (Engblom et al., Reference Engblom, Lundeheim, Strandberg, Schneider, Dalin and Andersson2008) and removal pattern of crossbred (Landrace × Yorkshire) sows (Engblom et al., Reference Engblom, Lundeheim, Dalin and Andersson2007). A detailed description of the 21 herds, covering housing system and management has been presented earlier (Engblom et al., Reference Engblom, Lundeheim, Dalin and Andersson2007). Herds were selected to be in the study on the basis of their herdsmen’s ability to make reliable registrations, both on events in the herd, as well as on the identity and pedigree of the sows. Mean and median herd sizes for the 16 herds were 544 and 329 sows, respectively, with a range of 122 to 2086 sows. Four of the herds were ‘sow pools’, i.e. a sow leasing system where a central unit supplies satellite units with pregnant sows which are returned to the central unit after the lactation period (at weaning).
Batch-wise production, a fixed circulatory system, was practiced in all herds. The herds practiced cross fostering and the average lactation period was between 4 and 5 weeks (Swedish animal welfare legislation requires at least 4 weeks of lactation). After weaning, oestrus was checked once (three herds) or twice (13 herds) a day. During the dry period, sows were group housed. Artificial insemination was used extensively in all herds. Pregnancy was diagnosed with ultrasound equipment (Doppler or Pulse eco, A-mode) in all herds except one. Sows were removed if they returned to oestrus after first mating (four herds), after second mating (nine herds) or after three or more returns to oestrus (three herds). For replacement, 1 of the 16 herds had its own multiplying unit with purebred sows and four herds used two-breed rotational crossing. In the other 11 herds, gilts were purchased, either as young prepubertal gilts (30 kg; six herds) or as pregnant gilts (five herds).
Data
Data collection started in January 2002 and continued for 3 years. After an initial visit (main author), herds were revisited about 3, 6, 12, 20 and 30 months later. At each visit, data were collected electronically from the herd-monitoring programme ‘PigWin Sugg’ (Quality Genetics HB, Hörby, Sweden) and additional information was recorded on paper. Data were checked for obvious errors and if possible, corrected or otherwise excluded.
Data included crossbred Landrace (L) × Yorkshire (Y) sows in different combinations with at least one farrowing during the period 1 January 2001 to 31 December 2004. Only sows for which identity of their sire and dam was known were included. Sows whose first litter was recorded to be born before 290 days or later than 480 days of age were excluded from the analyses to avoid sows with erroneously reported dates of birth or farrowing. Sows that produced their first litter in ‘another herd’ were also excluded from the analyses, as were sows sold to ‘another herd’ (these restrictions affected only few sows in few herds). The final data set contained 10 373 sows, mainly F1 crosses (i.e., L × Y or Y × L; 7119 sows from 14 herds) and the remaining (3254 from four herds) were two-breed rotational crossings (e.g. Y × LY, L × YL).
The data set was divided into two sets according to the sire breed of the sows, i.e., Landrace sires (LS) and Yorkshire sires (YS). Within both data sets, only herds with more than 10 sows remaining after exclusions were included in the analyses, resulting in 14 herds in LS data set and 13 herds in YS data set. Replacement model was in most herds purchased gilts, 10 herds in LS data and eight herds in YS data. In both data sets there were four herds that practiced rotational crossing, and these herds purchased no or very few F1 animals. In addition, one of the herds in the YS data had its own multiplying unit. The final two data sets used in the analyses consisted of 3626 sows offspring of 319 LS (LS_sow), and 6747 sows offspring of 315 YS (YS_sow). The average number of LS per herd was 63 (range 25 to 108) and that of YS was 56 (range 8 to 139). The average number of herds for each LS was 2.8 herds (range 1 to 11) and that of YS was 2.3 (range 1 to 9). The pedigrees used in the analyses included information only on the pedigree of the sows’ sire. The dams of the sows were in most cases of the other breed, or breed combination and often with an unknown pedigree.
Estimated breeding value (EBV) for the sires were obtained (June 2007) from the Swedish breeding organization QG (http://www.qgenetics.com). The current Swedish breeding evaluation (QG) is based on information from purebred animals in nucleus and multiplier herds. The traits evaluated are:
• piglets born alive in parity 1 (PBA1), parity 2 (PBA2) and parity 3 (PBA3),
• weaning to first service interval after parity 1 (WSI_1),
• age at first farrowing (AFF),
• litter weight at 3 weeks in parity 1 (LW3w1) and parity 2 (LW3w2), both adjusted for differences in litter size,
• age at 100 kg live weight at farm test (Age100 kg),
• backfat thickness at 100 kg live weight at farm test (Fat100 kg),
• exterior conformation score (legs and gait) in nucleus herds (Ext_N) and at boar testing station (Ext_S).
A high EBV is desirable for Ext_N whereas a low EBV is desirable for Ext_S. The EBVs for the conformation scores (Ext_N and Ext_S) and litter weight (LW3w1 and LW3w2) were only available for the YS.
Statistical analyses
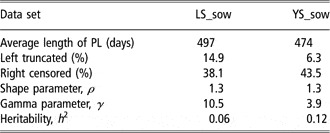
Survival analyses were performed using the Survival Kit V3.12 (Ducrocq and Sölkner, Reference Ducrocq and Sölkner1998). Removal hazard during productive life (PL) was analysed. The definition of PL was the number of days between first farrowing, which might be before January 2001, and removal or the end of data collection period. Data were left truncated on 1 January 2001. Left truncation allowed inclusion of all sows present in the herds at this date, irrespective of parity number. Records were treated as censored if sows were still alive at the end of the studied period, i.e. on 31 December 2004. The proportions of truncated and censored records are presented in Table 1. The number of observations included in the PL analyses was 3626 in LS_sow and 6747 in YS_sow.
Survival analysis statistics and estimates of length of productive life (PL) for Swedish crossbred sows, offspring of Landrace sires (LS_sow) and Yorkshire sires (YS_sow)

Removal hazard during PL was analysed using the following Weibull model:

where h 0 (t) is the baseline hazard function λρ(λt)ρ−1, assumed to follow a Weibull distribution with scale parameter λ and shape parameter ρ; t is time in days from first farrowing; β contains the fixed (possibly time-dependent) covariates affecting the hazard, with the corresponding design vectors x(t)′ and u is a vector of random (possibly time-dependent) variables with associated incidence vector z(t)′. The ρ estimates are shown in Table 1. In order to test whether a Weibull distribution properly fitted the data, the log of minus the log of the Kaplan–Meier estimate (non-parametric) of the survivor curves, was plotted against log of time. If the assumption for Weibull distribution holds, a straight line is obtained. The survival trait PL displayed approximately straight lines in both data sets when tested graphically (not shown).
The model applied for the survival trait PL, included the random time-dependent effect of herd–year, the fixed time-dependent effect of farrowing month and the random time-independent effect of sire. The sire effect was assumed to follow normal distribution whereas the effect of herd–year was assumed to follow a log-gamma (γ) distribution and was integrated out in the analyses. The γ estimates are shown in Table 1. The heritability on the original scale was calculated as suggested by Yazdi et al. (Reference Yazdi, Visscher, Ducrocq and Thompson2002):

where  is the sire variance and p is the proportion of uncensored records.
In addition, EBV for PL for the sires of the crossbred sows was estimated. For survival analysis of longevity traits, a low value is desirable and indicates a low removal hazard.
Mixed linear analyses were carried out using the DMU package (Madsen and Jensen, Reference Madsen and Jensen2000). For these analyses, further restrictions were imposed on data so that only sows with first farrowing from 1 January 2001 to 31 December 2004 were included. Four longevity traits were constructed for the analyses. Two stayability traits, stayability from first to second litter (STAY12) and from first to third litter (STAY13), were assigned a value of 0 for a sow removed before second or third parity, respectively, and 1 for a sow surviving up to second or to third litter, respectively, following López-Serrano et al. (Reference López-Serrano, Reinsch, Looft and Kalm2000). Sows weaning their first litter after 30 June 2004 (31 December 2003) were treated as missing for STAY12 (STAY13) since they did not have the time to have their second (third) litter before 31 December 2004. The third linear trait, length of productive life (LPL) was defined as the number of days from the first farrowing to culling. The difference compared with PL (survival analysis) is that only complete records, i.e. only sows that had been removed before 31 December 2004, were included in LPL. The fourth linear trait, lifetime production (LTP) was determined as the number of piglets born alive during the LPL of the sow. In addition to these four longevity traits, the number of piglets born alive in parity 1 for crossbred sows (PBA1C) was also included in the analyses as a reference trait. The number of observations included in the analyses of STAY12, STAY13, LPL, LTP and PBA1C were 2580, 2183, 1706, 1706 and 3087 in LS_sow, and 5280, 4472, 3385, 3385 and 6319 in YS_sow, respectively.
In the linear analyses, co(variance) components were estimated using the average information (DMU AI) residual maximum likelihood (REML) algorithm based on mixed linear models (Madsen and Jensen, Reference Madsen and Jensen2000). Linear model analysis was performed using the following animal model:

where y is the vector of observations of the traits considered one trait (univariate) or two traits (bivariate) at a time, X and Z are the incidence matrices for fixed (b) and random (u) effects, and e is the vector of residuals.
The model fitted for the five linear traits included the random effect of animal, the fixed effect of herd, the fixed effect of year and the random effect of herd × year × period (hyp) combination. Period (last farrowing) here was set as 2-month periods. The random effect of animal was assumed to be normally distributed with zero means and variances of  , where A is the additive relationship matrix. The pedigrees used in the analyses included information on dam and sire of the sow and information on the pedigree of the sire. The heritability was calculated as

Univariate analyses were performed to estimate the heritability as well as EBVs for the sires of the crossbred sows. In addition, bivariate analyses were performed to attain genetic and phenotypic correlations between the traits. For all linear longevity traits, a high value is desirable and indicates a high probability of survival or long life.
Correlations were estimated in two different ways. Genetic (r g) and phenotypic (r p) correlations were estimated in the bivariate linear analyses. In addition, correlations between sires’ EBVs (r_EBV) for all longevity traits were estimated using Spearman rank correlations. In these calculations, only sires with at least 10 female offspring in the data were included. The number of sires that met this criterion was 85 in LS (LS_sire1) and 133 in YS (YS_sire1). Furthermore r_EBV were calculated between the traits included in the running Swedish breeding evaluation (QG) and the longevity traits from survival analysis, as well as linear model analysis. The number of sires, with at least 10 female offsprings in the data and a breeding value from the QG evaluation, for PL were 76 in LS (LS_sire2) and 121 in YS (YS_sire2). The corresponding number of sires for STAY12, STAY13, LPL, LTP and PBA1C were 67 in LS_sire2 and 112 in YS_sire2.
Significant EBV correlations between longevity traits and traits included in the Swedish breeding evaluation were evaluated regarding efficiency of indirect selection v. direct selection with the formula:

assuming the same selection intensity (i) for both traits.
Results
The average length of PL was slightly longer in LS_sow than in YS_sow (Table 1). Sire solutions of PL, expressed as relative risk, ranged from 0.71 to 1.22 in LS_sow and from 0.67 to 1.59 in YS_sow. This means that females after the worst sire had 1.7 times higher (LS_sow) and 2.4 times higher (YS_sow) risk of removal than females after the best sire.
Heritabilities
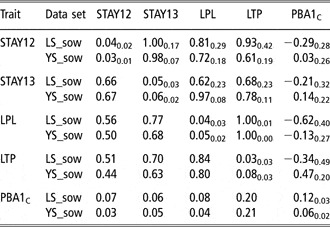
Heritability estimate for PL was higher in YS_sow (0.12) than in LS_sow (0.06) (Table 1). The heritabilities for the linear longevity traits ranged from 0.03 to 0.08 and for the reference trait (PBA1C), heritability was estimated at 0.06 and 0.12 (Table 2).
Linear model heritability estimates (diagonal), genetic (above the diagonal) and phenotypic (below the diagonal) correlations between longevity traits and PBA1C for Swedish crossbred sows, offspring of Landrace sires (LS_sow) and Yorkshire sires (YS_sow)

STAY12 = stayability from first to second litter; STAY13 = stayability from first to third litter; LPL = length of productive life; LTP = lifetime production; PBA1C = piglets born alive in parity 1 for crossbred sows.
Standard errors are given as subscripts.
Correlations
The genetic correlations between the four linear model longevity traits, using the DMU software, were all high and positive, ranging from 0.62 to 1.00 in LS_sow and 0.61 to 1.00 in YS_sow (Table 2). The genetic correlations between STAY12 and STAY13, and between LPL and LTP were very high, 0.98 to 1.00 in both data sets. Both positive and negative genetic correlations were found between the reference trait PBA1C and the linear longevity traits, but only one was statistically significant: PBA1C − LTP (0.47 ± 0.20) in YS_sow.
Moreover, the phenotypic correlations between the four linear longevity traits were positive and high, ranging from 0.51 to 0.84 in LS_sow and 0.44 to 0.80 in YS_sow (Table 2). Phenotypic correlations between the reference trait PBA1C and all the linear longevity traits were positive and less than 0.1, except for PBA1C and LTP which had a correlation of 0.2 in both data sets.
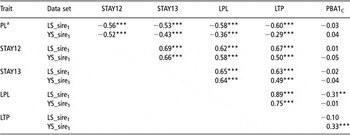
The correlations between sires’ EBVs for all the five longevity traits were all significant (P < 0.001) and moderate to strong in both data sets (Table 3). The EBV correlation found between the reference trait PBA1C and longevity traits was moderately unfavourable (P < 0.01) with LPL (−0.31) in LS_sire1 and moderately favourable (P < 0.001) with LTP (0.33) in YS_sire1. The r_EBV for the linear traits were all in the same direction as the genetic correlations shown in Table 2. However, the level was lower for all traits, except between STAY13 and LPL in LS_sire1, which was at the same level.
Estimated breeding values (EBV) correlations (Spearman rank), including levels of significance for Landrace sires (LS_sire1) and Yorkshire sires (YS_sire1)

PL = productive life, STAY12 = stayability from first to second litter, STAY13 = stayability from first to third litter, LPL = length of productive life, LTP = lifetime production, PBA1C = piglets born alive in parity 1 for crossbred sows.
aHazard for removal.
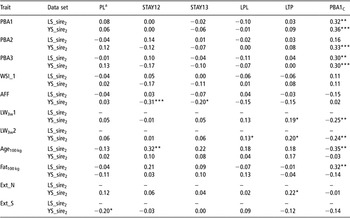
Sire EBV correlations between the traits in the running Swedish breeding evaluation (QG) and the longevity traits, as well as the reference trait are shown in Table 4. None of the reproductive traits (PBA, WSI_1 or AFF) had significant EBV correlation to any of the longevity traits in LS_sire2. In YS_sire2, AFF was favourably correlated with STAY12 (P < 0.001) and STAY13 (P < 0.05; Table 4). Mothering ability, measured by litter weight at 3 weeks (only available for YS_sire2), was favourably correlated to LTP (P < 0.05) and to LPL (P < 0.05; Table 4). Among production traits (growth rate and backfat thickness), unfavourable correlation between Age100 kg and STAY12 (P < 0.01; Table 4) was found in LS_sire2, but no significant correlation to backfat was found. The exterior conformation traits recorded in the nucleus herds (Ext_N) and at testing station (Ext_S), were only available for YS_sire2 and there was an unfavourable correlation between PL and Ext_S (P < 0.05; Table 4).
Estimated breeding values (EBV) correlations (Spearman rank), including levels of significance between traits in the Swedish breeding evaluation and longevity traits for Landrace sires (LS_sire2) and Yorkshire sires (YS_sire2)

PL = productive life; STAY12 = stayability from first to second litter; STAY13 = stayability from first to third litter; LPL = length of productive life; LTP = lifetime production; PBA1C = piglets born alive parity 1 for crossbred sows; PBA1 = piglets born alive parity 1; PBA2 = piglets born alive parity 2; PBA3 = piglets born alive parity 3; WSI_1 = weaning to first service interval after parity 1; AFF = age at first farrowing; LW3w1 = litter weight at 3 weeks in parity 1; LW3w2 = litter weight at 3 weeks in parity 2; Age100 kg = age at 100 kg live weight on farm; Fat100 kg = backfat thickness at 100 kg live weight on farm; Ext_N = exterior conformation score evaluation in nucleus herds; Ext_S = exterior conformation score evaluation on station.
aHazard for removal.
Significant EBV correlations between longevity traits and traits included in the Swedish breeding evaluation were evaluated regarding efficiency of indirect v. direct selection. The ratio of indirect v. direct selection response were generally low (<0.4), except for indirect selection for STAY12 based on AFF, which was estimated at 0.8.
In both data sets, PBA1C (crossbred) sows had favourable correlation to PBA1 (P < 0.01) and PBA3 (P < 0.01) in purebred sows (Table 4). In YS_sire2, PBA1C also had favourable correlation to PBA2 (P < 0.01), LW3w1 (P < 0.01) and LW3w2 (P < 0.01), whereas in LS_sire2, PBA1C had favourable correlation to Age100 kg (P < 0.01) and an unfavourable correlation to Fat100 kg (P < 0.01; Table 4).
Discussion
Heritabilities
The heritability estimates for PL (survival analysis) in this study were slightly higher in YS_sow compared with LS_sow. However, both estimates were lower than those in earlier studies (Yazdi et al., Reference Yazdi, Lundeheim, Rydhmer, Ringmar-Cederberg and Johansson2000a and Reference Yazdi, Rydhmer, Ringmar-Cederberg, Lundeheim and Johansson2000b; Serenius and Stalder, Reference Serenius and Stalder2004). This difference may be because earlier studies were based on purebred animals in nucleus and multiplying herds, whereas the present study was based on crossbred sows in commercial herds. Moreover, possibly the registrations were more accurate in nucleus and multiplying herds compared with commercial herds. Furthermore, both the genetic materials and models used in the analyses were different compared with earlier studies. The stayability heritabilities estimated with linear model in this study were at the same level (Tholen et al., Reference Tholen, Bunter, Hermesch and Graser1996; Serenius et al., Reference Serenius, Stalder and Puonti2006) or lower (López-Serrano et al., Reference López-Serrano, Reinsch, Looft and Kalm2000) than those reported earlier. Heritability estimates for LPL and LTP in the present study were at the same level (Serenius and Stalder, Reference Serenius and Stalder2004), or lower (Guo et al., Reference Guo, Gianola, Rekaya and Short2001; Heusing et al., Reference Heusing, Hamann and Distl2005) than those reported earlier. The heritability estimates for number of piglets born alive in the first litter were in agreement with several earlier studies based on purebred animals (Rydhmer et al., Reference Rydhmer, Lundeheim and Johansson1995; Serenius et al., Reference Serenius, Sevón-Aimonen, Kause, Mäntysaari and Mäki-Tanila2004; Heusing et al., Reference Heusing, Hamann and Distl2005).
In the present study, LPL analysed with survival analysis gave higher heritability estimates compared with estimates from linear model analysis. This agrees with earlier studies (Serenius and Stalder, Reference Serenius and Stalder2004; Schneider et al., Reference Schneider, Strandberg, Ducrocq and Roth2005) and is probably due to more effective use of the data available, i.e., accounting for censoring and using time-dependent variables in survival analyses. However, in the present study, the survival analysis was performed with a sire model, whereas the linear analyses were based on an animal model. The use of a sire model is likely to be less appropriate for pig data since several females after a sire can be littermates. In the present study, the average number of sows from common litters was 2. A recent study by Serenius et al. (Reference Serenius, Stalder and Puonti2006) reported a substantial common litter effect for longevity traits in the Finnish pig population. Therefore, ignoring the litter effect might result in overestimation of the sire variance and consequently the heritability estimates.
Correlations
The genetic correlations (linear model analysis) between the longevity traits found in this study were high. The genetic correlation between STAY12 and STAY13 was close to 1, as was r g between LPL and LTP. These correlations may be slightly overestimated, indicating that the program is struggling to reach convergence. Still, they agree well with previous studies where the genetic correlation between LPL and LTP (Serenius and Stalder, Reference Serenius and Stalder2004; Heusing et al., Reference Heusing, Hamann and Distl2005), and between STAY12 and STAY13 (Tholen et al., Reference Tholen, Bunter, Hermesch and Graser1996) were estimated close to 1.
The method of estimating correlations between EBVs has been applied earlier by Yazdi et al. (Reference Yazdi, Lundeheim, Rydhmer, Ringmar-Cederberg and Johansson2000a) and Serenius and Stalder (Reference Serenius and Stalder2004). This method is useful since the survival analysis has only recently been applied to bivariate analyses (Holm Damgaard, Reference Holm Damgaard2004), and Survival Kit still only handles single trait analysis. The negative sign between the survival and linear model correlations is due to the different direction of the scales. With survival analysis, a low EBV is desirable, as low PL EBV means low risk of removal, whereas with the linear models a high EBV is desirable, as high EBV means high probability of long life.
The current Swedish breeding evaluation (QG) and sow longevity
Indications of indirect selection for sow longevity, expressed in piglet-producing herds, were studied with estimation of r_EBV between traits included in the current Swedish breeding evaluation (QG) and longevity traits analysed in the present study. Based on the present study, it was concluded that there was no significant association between PBA and longevity traits analysed, whereas earlier studies have reported favourable correlations between PBA and the two longevity traits LPL and LTP (Serenius and Stalder, Reference Serenius and Stalder2004; Heusing et al., Reference Heusing, Hamann and Distl2005). It was concluded that there was a favourable EBV correlation between AFF and the two stayability traits in YS_sire2, which agrees with findings by Serenius and Stalder (Reference Serenius and Stalder2004) for Large White sows. The favourable r_EBV between litter weight at 3 weeks and longevity indicates that good mothering ability is associated with high sow longevity.
The moderate unfavourable correlation to growth rate found in LS_sire2, i.e., high growth rate was associated with low stayability, agrees with findings by López-Serrano et al. (Reference López-Serrano, Reinsch, Looft and Kalm2000) but disagrees with findings from Serenius and Stalder (Reference Serenius and Stalder2004), who concluded that there was no significant correlation. The unfavourable correlation (−0.20) between PL (removal hazard) and the conformation trait (Ext_S) found in YS_sire2, i.e., good conformation score was associated with high removal hazard, was in contrast to several other studies that present low to moderate favourable, good conformation-improved longevity, correlations between leg score and longevity traits (López-Serrano et al., Reference López-Serrano, Reinsch, Looft and Kalm2000; Yazdi et al., Reference Yazdi, Lundeheim, Rydhmer, Ringmar-Cederberg and Johansson2000a; Serenius and Stalder, Reference Serenius and Stalder2004). The unfavourable EBV correlation between Ext_S and PL (removal hazard) found in the present study, is difficult to explain and needs to be further investigated since the exterior conformation trait is a trait aimed to improve longevity.
The efficiency of indirect selection was evaluated and only indirect selection for STAY12 based on AFF was estimated at a reasonably high level. However, both these traits are measured relative early in life of sows, and may have limited value for selection for sow longevity.
The lack of correlations between longevity and the traits included in the current Swedish breeding evaluation (QG) may be due to the method used to calculate the correlations. The present study used EBV correlations to investigate the association between the longevity traits analysed and the traits included in the breeding evaluation (QG). As shown in the present study and earlier (Serenius and Stalder, Reference Serenius and Stalder2004), correlations between EBVs give lower estimates compared with genetic correlations. Moreover, correlations between EBVs are influenced by variation in accuracy, number of observations in calculation of each EBV, of the EBVs, which might show up as re-ranking among sires.
In the present study, the longevity traits were recorded at commercial level on crossbred sows, whereas the breeding evaluation from QG is based on information on purebred animals in nucleus and multiplying herds. Serenius et al. (Reference Serenius, Stalder and Puonti2006) investigated the ‘same’ longevity trait, both on purebred and crossbred sows, and handled them as different traits. They found that the proportion of dominance variance was higher than the corresponding heritability estimates in the crossbred population. Furthermore, they found high (>0.75) genetic correlations between the ‘same’ trait registered in purebred and crossbred sows. This suggests that selection based on purebred information would result in genetic improvement of the crossbred sows. In the present study, we included litter size in first parity recorded on crossbred sows in commercial herds (PBA1C) and recordings on purebred sows in nucleus and multiplying herds (PBA1). The analyses gave moderate and positive EBV correlations (0.32 and 0.36), showing that PBA1 is not exactly the same trait in the two types of herd. This result in different ranking among the sires, i.e., the best sires in the breeding and multiplying herds may not be the best in the commercial herds. The reason that the association was only moderate, in addition to the different environments and management, and variation in accuracy of EBVs, is the heterosis effects, a result of crossbreeding. However, in the present study, the effect of heterosis was not significant. This was probably due to inferior data structure, since only four herds in each data set applied rotational crossing and these four herds purchased no or very few F1 animals.
How to breed for sow longevity
The level of the estimated heritabilities for longevity indicates that genetic improvement of sow longevity would be possible. Overall, today there is no strong indirect selection for sow longevity with the current Swedish breeding evaluation (QG). Since removal rate is high and a large proportion of the removed sows are young, the longevity of the average sow has the potential to be improved. This could be accomplished by including additional indirect traits such as osteochondrosis, and/or by adding a direct longevity trait into the breeding programme. However, none of these measures will improve sow longevity among the crossbred sows unless there is a high association between ‘the same trait’ at different levels of the breeding pyramid. Thus, if the correlation between the nucleus herds and the commercial herds is not high enough, it may be necessary to include information from the commercial herds in the breeding evaluation. However, at present, problems regarding data collection and ensuring data quality need to be solved before this would be possible and worthwhile.
Acknowledgements
We wish to acknowledge the Swedish Farmers Foundation for Agricultural Research (Svensk lantbruksforskning, SLF) for their financial support, and both the owners and staff of the herds who made this study possible.