


Introduction
A continuous, 2500 m long core was recovered at the summit of Dome F, east Dronning Maud Land, Antarctica, during the years 1993-97 (Dome-F Deep Coring Group, 1998). This ice core provides us with paleoclimate and atmospheric records over the order of 300 000 years (Reference Watanabe, Kamiyama, Motoyama, Fujii, Shoji and SatowWatanabe and others, 1999). However, fully confident interpretation of the paleoclimate record requires an understanding of the stratification and the deformation of the ice sheet at the site, based on studies of crystal structure and fabrics.
The first comprehensive studies on textures and fabrics of deep ice cores were performed on the Byrd Station (Antarctica) ice core by Reference Gow and WilliamsonGow and Williamson (1976). Subsequent crystallography studies of deep ice cores (Reference Herron and LangwayHerron and Langway, 1982; Reference Herron, Langway, Brugger, Langway, Oeschger and DansgaardHerron and others, 1985; Reference Lipenkov, Barkov, Duval and PimientaLipenkov and others, 1989; Reference GowGow and others, 1997; Reference Thorsteinsson, Kipfstuhl and MillerThorsteinsson and others, 1997) provided substantial information about ice-flow conditions.
The purpose of this paper is to present a full set of data on textures and fabrics in the Dome F ice core and to assess the deformation mode and stratigraphic disturbance in the ice sheet beneath Dome F.
Samples and Methods
Sample preparation
Ice cores were stored immediately after recovery in a snow cave at -40° to -50°C adjacent to the drill site at the Dome Fuji camp. Cores were split into two parts (40% and 60%) along the core axis using a band-saw in a science trench at -40°C. A 60% portion of the core (named A core) was archived in a storage cave at -50°C for future study. The other 40% of the core was itself split in two (60%: B core and 40%: C core) along the core axis in the science trench after stratigraphy and electrical conductivity measurements had been made. Core quality from the surface to 2500 m depth was excellent, with few cracks forming after core recovery. Although cracking took place frequently in the brittle zone from 500 to 800 m during band-sawing, the ice core did not break into pieces. The split cores were shipped to Japan. These cores, destined for physical studies, were stored in a cold room at -50°C. Thin sections for this study were cut from the B core, parallel to the core axis in a cold room at -20°C. The thin sections, 100 mm long, 50 mm wide and 0.5 mm thick, were prepared using standard methods.
In 1996 and 1997, basic sampling and measurements were performed at 20 m intervals from 100 to 2250 m, and continuous sections of 1 m were measured along the core at ten selected depths between 500 and 1900 m. In 1998, basic sampling and measurements were done at 10 m intervals below 2250 m.
Measurements
Measurements of ,-axis orientation, crystal size and crystal shape were carried out on the thin sections mentioned above using an automatic ice-fabric analyzer developed by us (Reference Yun and AzumaWang and Azuma, 1999). The validity and accuracy of the automated method are discussed in that paper. The crystal images were captured into a personal computer (PC) by a charge coupled device (CCD) camera, and individual crystals were recognized by image-analysis techniques, ,-axis orientations and crystal parameters such as size, aspect ratio and elongation direction of all individual crystals in the view of the CCD camera can be calculated rapidly by the PC. The diameter of the view was set at 35 mm in this study. Three views of the CCD camera can cover one thin section of 100 mm length.
Crystal size, shape and c-axis orientation
Images of each crystal taken at ten different polarizing directions were processed with several image filters, and two-dimensional crystal shape on the section plane was well recognized automatically. When the ,-axis orientations between adjacent crystals are similar, their interference colors are so similar that the grain boundary between the two crystals cannot be detected. In this case the proper grain boundaries were drawn manually on the images. Individual crystal areas were calculated and converted to the diameter of equivalent-area circle. We hereafter use the term "crystal size" to mean equivalent-area diameter. Mean crystal size was calculated over each thin section. For the thin sections below 1000 m, we also made crystal-size measurements manually on the same thin sections as measured automatically to check the validity of the automated method.
In order to evaluate the evolution of crystal shape with depth, the aspect ratio (ratio of long axis to short axis) of each crystal and its elongation direction were measured on all thin sections.
The measured ,-axis orientations of individual crystals on each thin section were plotted on a Schmidt net. Several statistical parameters to express the ,-axes orientation strength and its direction were calculated on each thin section. Mean orientation of, axes (MOC) is defined as the orientation of a resultant vector obtained by summing all c-axis unit vectors. This orientation corresponds to a pole of single maximum on the Schmidt net. In order to examine quantitatively a measure of concentration on the mean orientation, we calculated the median inclination (MI) of, axes in reference to the MOC, which is defined as a half apex angle of the cone in which a half of the measured c axes are included. This MI value is 60° for a uniform distribution of, axes and zero for completely parallel ,-axes orientations. Note that the borehole is within 1° of vertical until 1800 m depth and then deviates with depth, reaching a maximum of 4.6° at 2250 m (Dome-F Deep Goring Group, 1998). This means that the longitudinal axis of the thin section that is parallel to the core axis is not geographically vertical.
Results
Crystal size and c-axis orientation fabrics
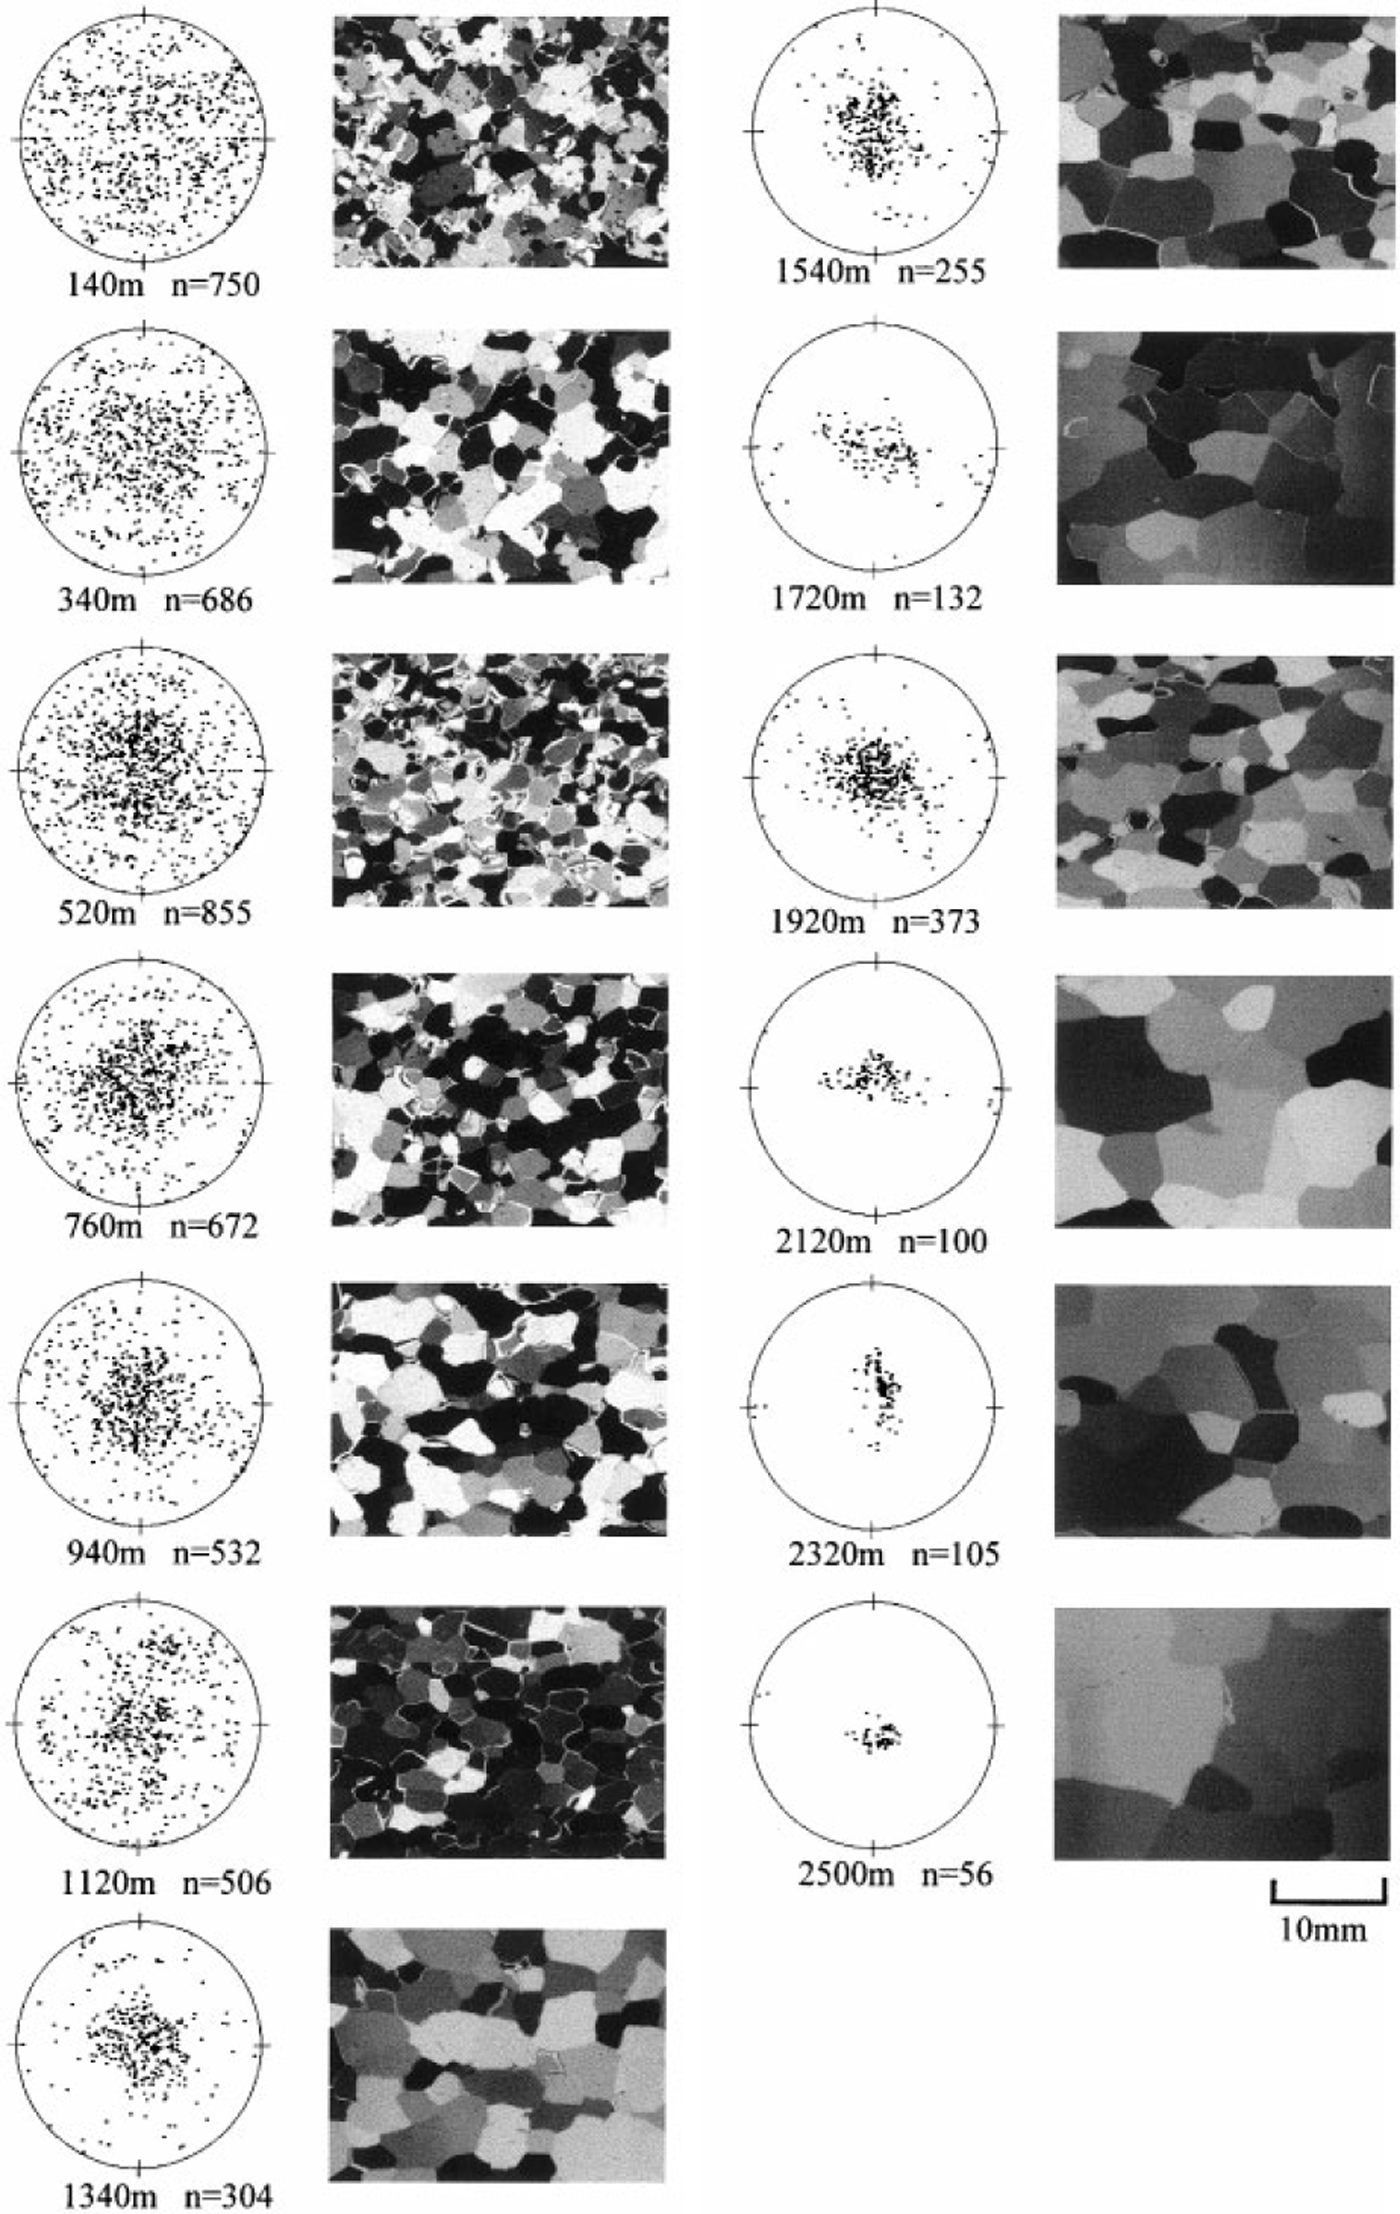
Figure 1 shows the fabric diagrams and thin-section photographs taken by the GGD camera at selected depths. All fabric diagrams are shown, with the center of each diagram coinciding with the core axis, while the top-bottom direction of each photograph coincides with that of the core. The mean crystal-size and the median inclination profiles are presented in Figure 2. Crystal-size data measured with the automatic method (filled circles) are in good agreement with the data measured manually (triangles), although some differences are observed below 2000 m. Measurements have not been conducted for the present study between the surface and 112 m depth. The mean crystal size is 2 mm at 112 m depth and keeps nearly constant until 420 m. Between 420 and 700 m the crystal size is observed to decrease, and then it steadily increases with depth except for sudden decreases at depths of around 1800, 2000, 2200 and 2300 m. A maximum value of 10.3 mm was obtained at 2490 m.
Fabric diagrams and thin-section photographs from the Dome Fcore. The center of each diagram and the top-bottom direction of each photograph coincide with the core axis.
Crystal size and median inclination of c axes in the Dome Fcore. The median inclination is defined as the half apex angle of the cone in which a half of measured c axes are included.
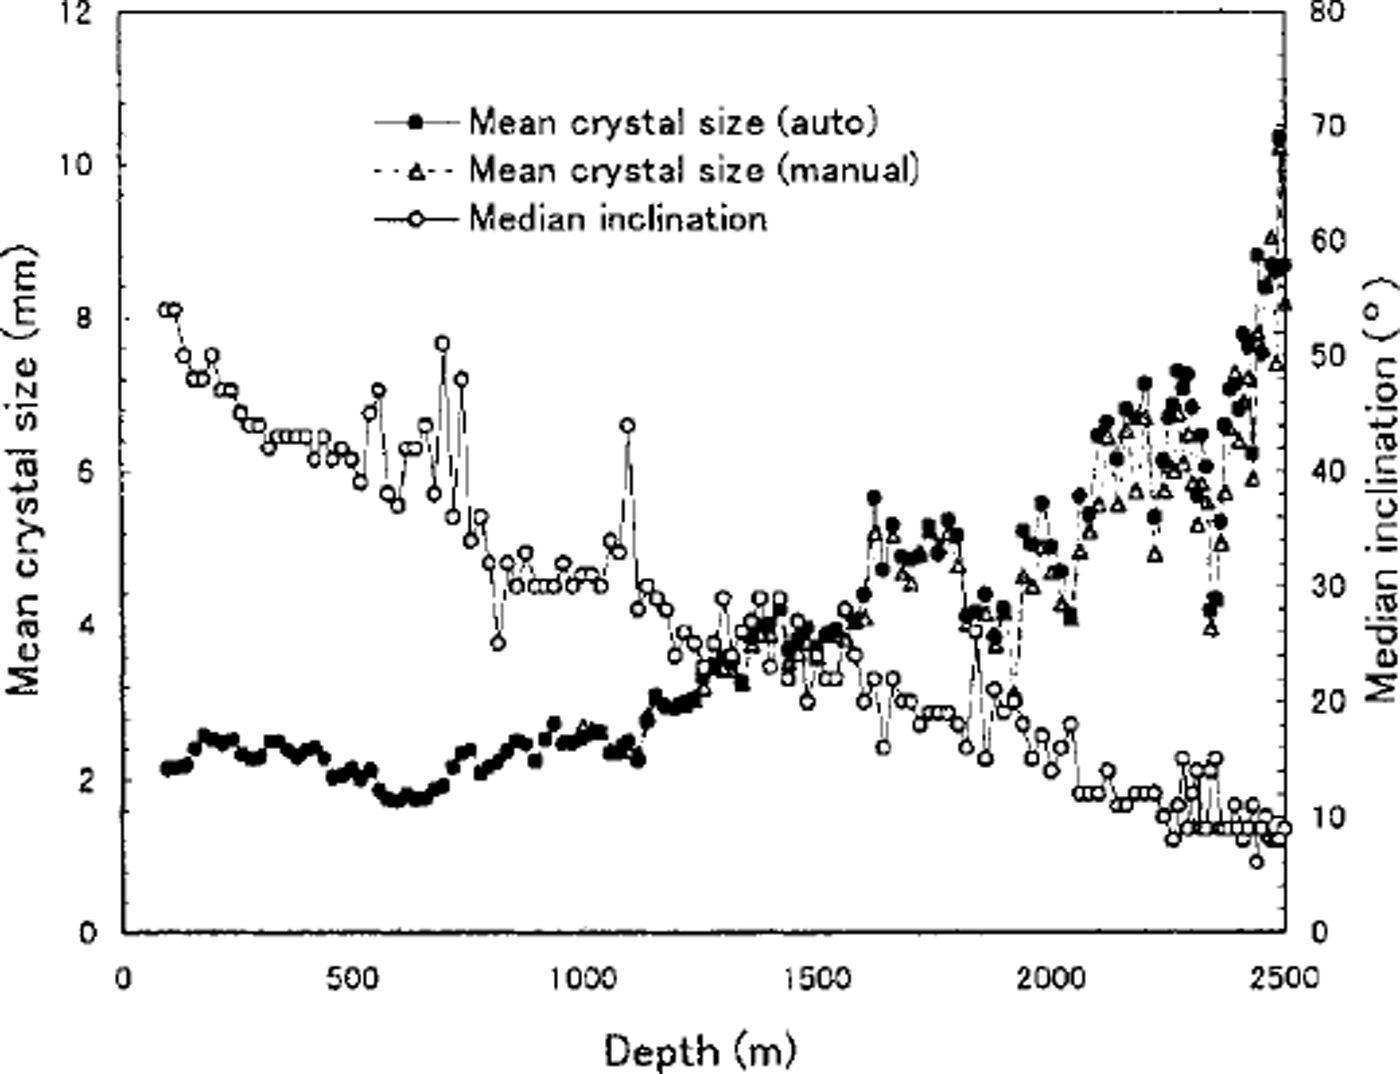
As shown in Figure 1, the ,-axis orientation fabrics gradually change with depth from a random orientation pattern near the surface to a strong vertical single maximum, a development which is very similar to that observed in the Greenland Ice Gore Project (GRIP) core (Reference Thorsteinsson, Kipfstuhl and MillerThorsteinsson and others, 1997). The median inclination varies from 54° at 112 m to 9° at 2500 m. Throughout the present sampling depths no characteristic fabric patterns such as small girdle, great girdle and multi-maxima were observed, although some deviations of c-axes vertically can be seen in the median inclination profile (Fig. 2).
The profile of the MOC, the angle between the pole of the single maximum and the core axis, is presented in Figure 3. It is found that the MOC kept constant at 2 ± 2° until 1900 m depth, and below this depth it increased to a maximum value of 14° at 2490 m with large fluctuations. According to the borehole-inclination data (Dome-F Deep Coring Group, 1998), the borehole deviates from the vertical with depth below 1800 m, reaching a maximum of 4.6° at 2250 m depth. Although the inclination of the MOC with respect to the vertical cannot be known since there is no information about the orientation of the ice core within the borehole, the large deviation of the MOC from the core axis below 2000 m is more than offset by the borehole inclination. Thus the mean orientation of the c axes inclines at least several degrees from the vertical below 2000 m. Visual stratigraphy observation reveals that below 2000 m, tephra layers and cloudy bands are inclined about 10° with respect to the normal plane of the core axis. It is therefore likely that the layers below 2000 m incline with respect to the horizontal due to the influence of bedrock topography or for some other reason.
Median inclination (thick line) and mean orientation ofc axes (thin line) in the Dome Fcore. The mean orientation of c axes is defined as the angle between the core axis and the orientation of a vector obtained by the sum of all unit vectors parallel to thee axis.

Crystal elongation
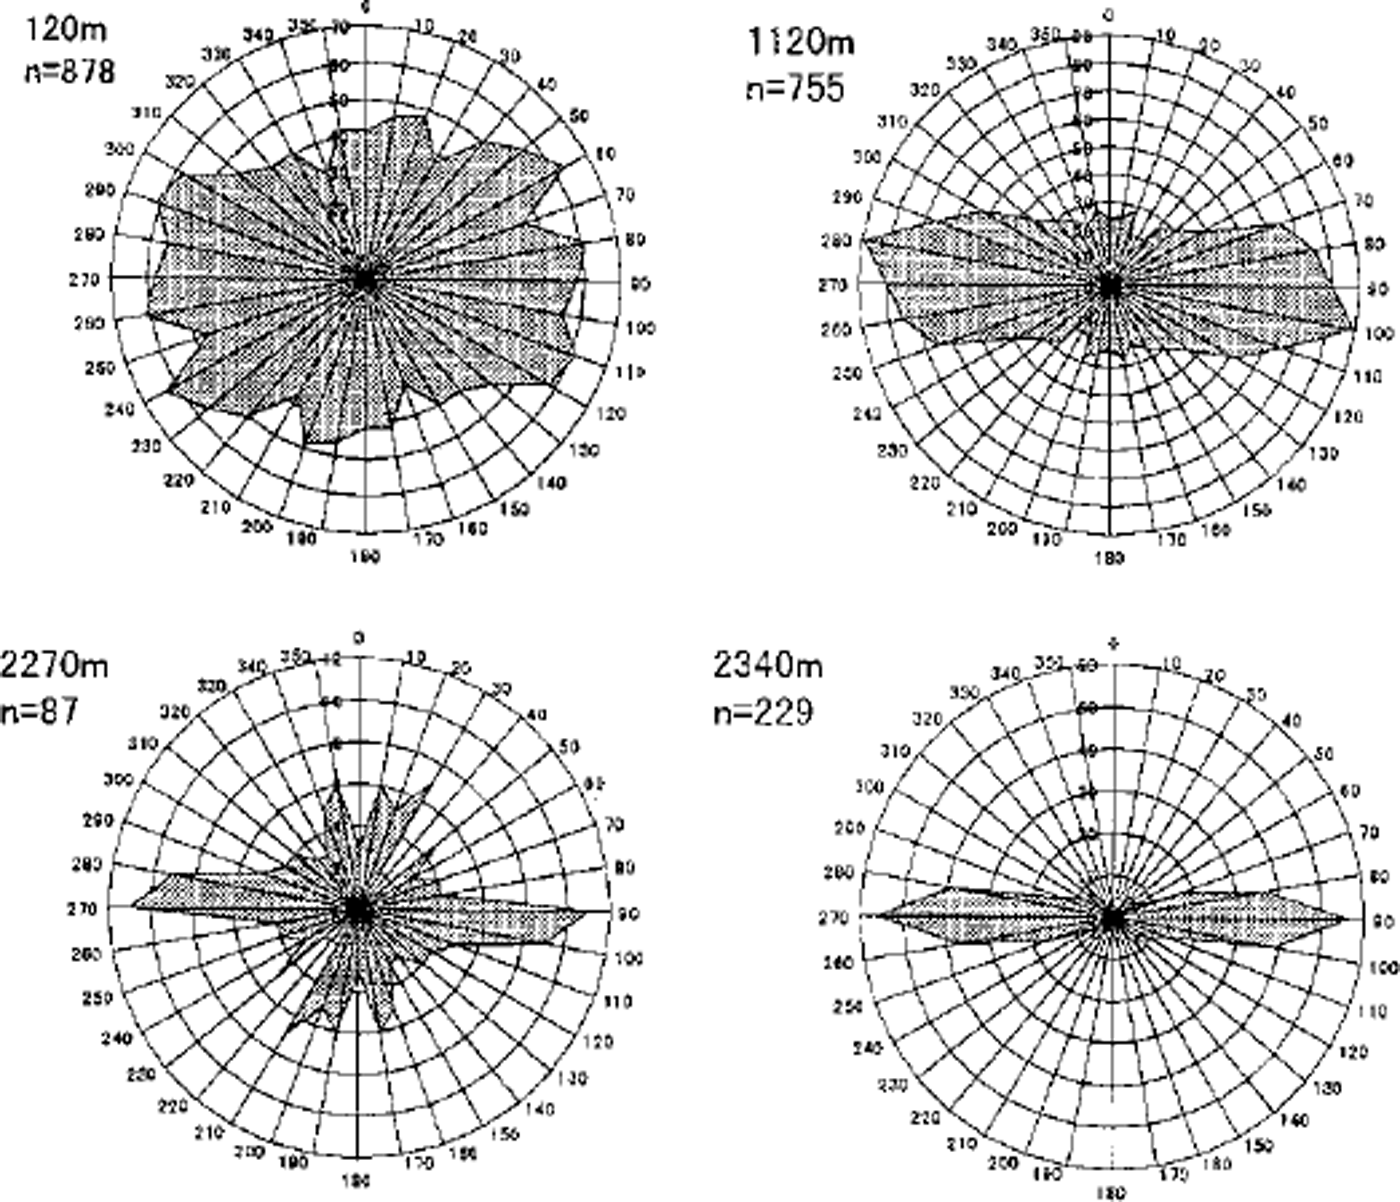
As can be seen in the thin-section photographs in Figure 1, the crystals tend to elongate in the horizontal direction with depth. The profile of the mean aspect ratio (MAR) and that of the mean crystal elongation direction (MCED) are presented by the thick line and the thin line, respectively, in Figure 4. An MAR value of about 1.7 is kept nearly constant until 800 m. It then increases with depth until 1500 m. Below this depth it fluctuates around 1.9 until 2500 m. Crystals are already elongated at a shallow depth, and their elongation directions vary with depth. Figure 5 shows a circular histogram of the crystal elongation direction. The direction of 0 - 180° corresponds to the core axis. At the shallow depth of 120 m the long axes of crystals orient in various directions. As the depth increases, the number of crystals elongated horizontally increases. A typical example is the diagram for 2340 m in Figure 5. The MCED indicates the mean angle between the crystal elongation axis and the core axis. It becomes 90° if all crystals elongate horizontally. From Figure 4, the MCED increases with depth for the first 1000 m and then keeps constant with large fluctuations until 2000 m. Below this depth it decreases again with large fluctuations. Note that the MCED is 50-60° over most of the depth. This means that although a large number of crystals elongate horizontally as shown in Figure 5, a considerable number of crystals that elongate in other directions still exist.
Mean crystal-elongation direction (thin line) and mean aspect ratio (thick line) of crystals. The mean crystal-elongation direction indicates the mean angle between the crystal-elongation axis and the core axis.

Circular histogram of the crystal-elongation direction. The direction 0-180° corresponds to the core axis.
Discussion
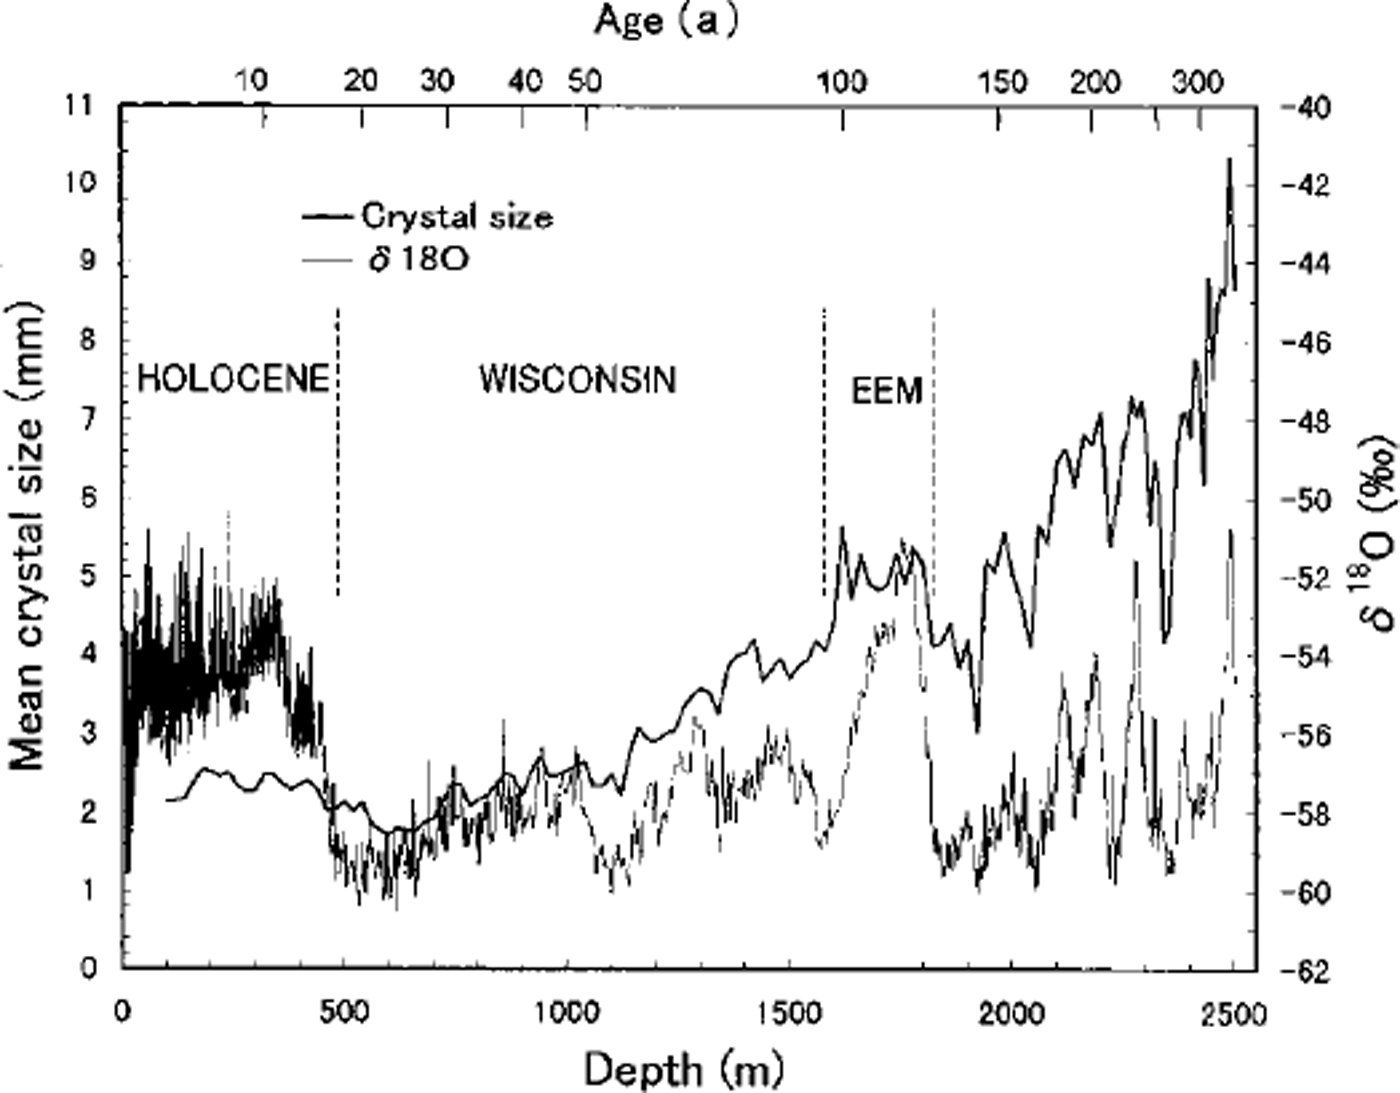
Figure 6 shows the crystal-size-variation and the oxygen-isotope-ratio (Reference Watanabe, Kamiyama, Motoyama, Fujii, Shoji and SatowWatanabe and others, 1999) profiles for the Dome F core. Although the crystal data were obtained at rough sampling intervals compared with the isotope data, the highs and lows of the crystal-size profile correlate with the isotope variation. Similar results are reported in the GRIP core (Reference Thorsteinsson, Kipfstuhl, Eicken, Johnsen and FuhrerThorsteinsson and others, 1995, Reference Thorsteinsson, Kipfstuhl and Miller1997) and the Vostok (Antarctica) core (Reference Lipenkov, Barkov, Duval and PimientaLipenkov and others, 1989). Reference ThorsteinssonThorsteinsson (1996) analyzed in detail the correlation between the crystal size, the isotope data and the impurity concentration in the GRIP core. He demonstrated that high concentrations of impurities slow grain growth when calcium concentrations exceed 12 ppb, chloride concentrations exceed 20 ppb and the dust content rises above 0.5 m gL-1. In the Dome F core the impurity concentrations at the depths where crystal size decreases exceed 40 ppb for Ca2+, and 100 ppb for GT (Reference Watanabe, Kamiyama, Motoyama, Fujii, Shoji and SatowWatanabe and others, 1999). Further investigations are necessary to clarify the effect of impurities on the grain growth rate.
Crystal-size variation (measured by the automated method) and oxygen-isotope ratio of the Dome F core. The Dome F time-scale according to Reference Watanabe, Kamiyama, Motoyama, Fujii, Shoji and SatowWatanabe and others (1999) is indicated at the top.
According to the results from crystallography studies on the Camp Century, Byrd Station and Dye 3 cores (Reference Gow and WilliamsonGow and Williamson, 1976; Reference Herron and LangwayHerron and Langway, 1982; Reference Herron, Langway, Brugger, Langway, Oeschger and DansgaardHerron and others, 1985), the vertical ,-axis orientation fabrics of ice-age (Wisconsin) ice (which are co-located with small-crystal-size ice) are stronger than that of interglacial (Holocene) ice (co-located with large-crystal-size ice). These drilling sites are located in flank regions. On the other hand, the crystallography studies on the GRIP core (Reference Thorsteinsson, Kipfstuhl and MillerThorsteinsson and others, 1997) and GISP2 core (Reference GowGow and others, 1997), which were recovered at Summit, central Greenland, reported that significant crystal-fabric strengthening was not observed at the Holocene-Wisconsin transition. As can be seen in Figures 1 and 2, the general trend of fabric evolution in the Dome F core is very similar to that in the GRIP and GISP2 cores, which is characterized by a progressive reorienting of, axes toward the vertical without any sharp change. Reference PatersonPaterson (1991) proposed the following explanation for the sudden changes in crystal size and fabric strengthening at the boundary between the Holocene and Wisconsin in flank regions. The relatively high concentrations of impurities and dust particles in the ice-age ice reduce the rate of grain growth and increase the dislocation density. This favors subgrain boundary formation, polygonization and dynamic recrystallization processes that facilitate the development of a strong single-maximum fabric by simple shear. Any small difference in fabric strength produced by recrystallization is reinforced by a positive feedback mechanism in the simple shear regime (Reference PatersonPaterson, 1994). Although this hypothesis, that the trigger of the process is the easiness of recrystallization due to high concentrations of impurities, is controversial, the positive feedback mechanism in the simple shear regime explains convincingly the drastic changes of fabric strength and crystal size between the ice age and interglacial age. In the case of a vertical uniaxial regime like a dome summit, uniaxial compression provides the rotation of the c axis towards a compression axis. The enhancement of ice deformation caused by the favorable ,-axis orientation fabric for vertical compression induces further rotation of, axes towards the vertical axis, and the ice becomes harder unless dynamic recrystallization occurs (Reference AlleyAlley, 1992; Reference AzumaAzuma, 1994). This negative feedback mechanism hinders abrupt changes between ice-age ice and interglacial ice in features such as grain-size, grain shape and crystal fabric.
Now let us examine in more detail the ,-axis fabric evolution data of the Dome F core. In Figure 2 it is found that the median inclination deviates largely at depths around 500-700, 1100, 1800-1900 and 2300 m, the same depths at which a decrease in crystal size is observed. This means that the clustering of, axes about the vertical is weakened at those depths.
Although the cause of this phenomenon cannot be explained at present, the following two possibilities are proposed.
-
(1) Under low temperature (<-60°C) and low deviatoric stress, the ratio of diffusional creep to dislocation glide becomes significant if the ice contains high concentrations of impurities.
-
(2) High concentrations of impurities enhance rotation recrystallization.
If diffusional creep is activated due to fine grains with high impurity concentrations to the point that diffusional creep rate becomes comparable with dislocation creep rate under low-temperature and low-deviatoric-stress regimes, ,-axes rotation will slow because the diffusional creep does not contribute to it. On the other hand, high concentrations of impurities impede grain growth so that the highly elongated crystals are subdivided easily by deformation. If this "rotation recrystallization" is activated, ,-axes concentration could be weakened.
Except for the anomalies stated above, the steady development of the single maximum and the horizontal crystal elongation without any interlocked shape throughout the depth of the Dome F core seems to suggest that ice beneath Dome F deforms mainly unaxially parallel to the vertical and that nucleation-recrystallization does not take place above 2500 m depth.
However, it still seems possible that the progressive single-maximum fabric development with no sharp change can be formed by horizontal shear deformation if dynamic recrystallization does not take place. Even near dome summits where the basal ice does not move significantly, horizontal shear increases with depth (e.g. Reference HvidbergHvidberg, 1996). It is also possible that the exact center of flow migrates over time. Therefore, at the present stage we cannot conclude that the ice sheet beneath Dome F deforms vertically in uniaxial compression.
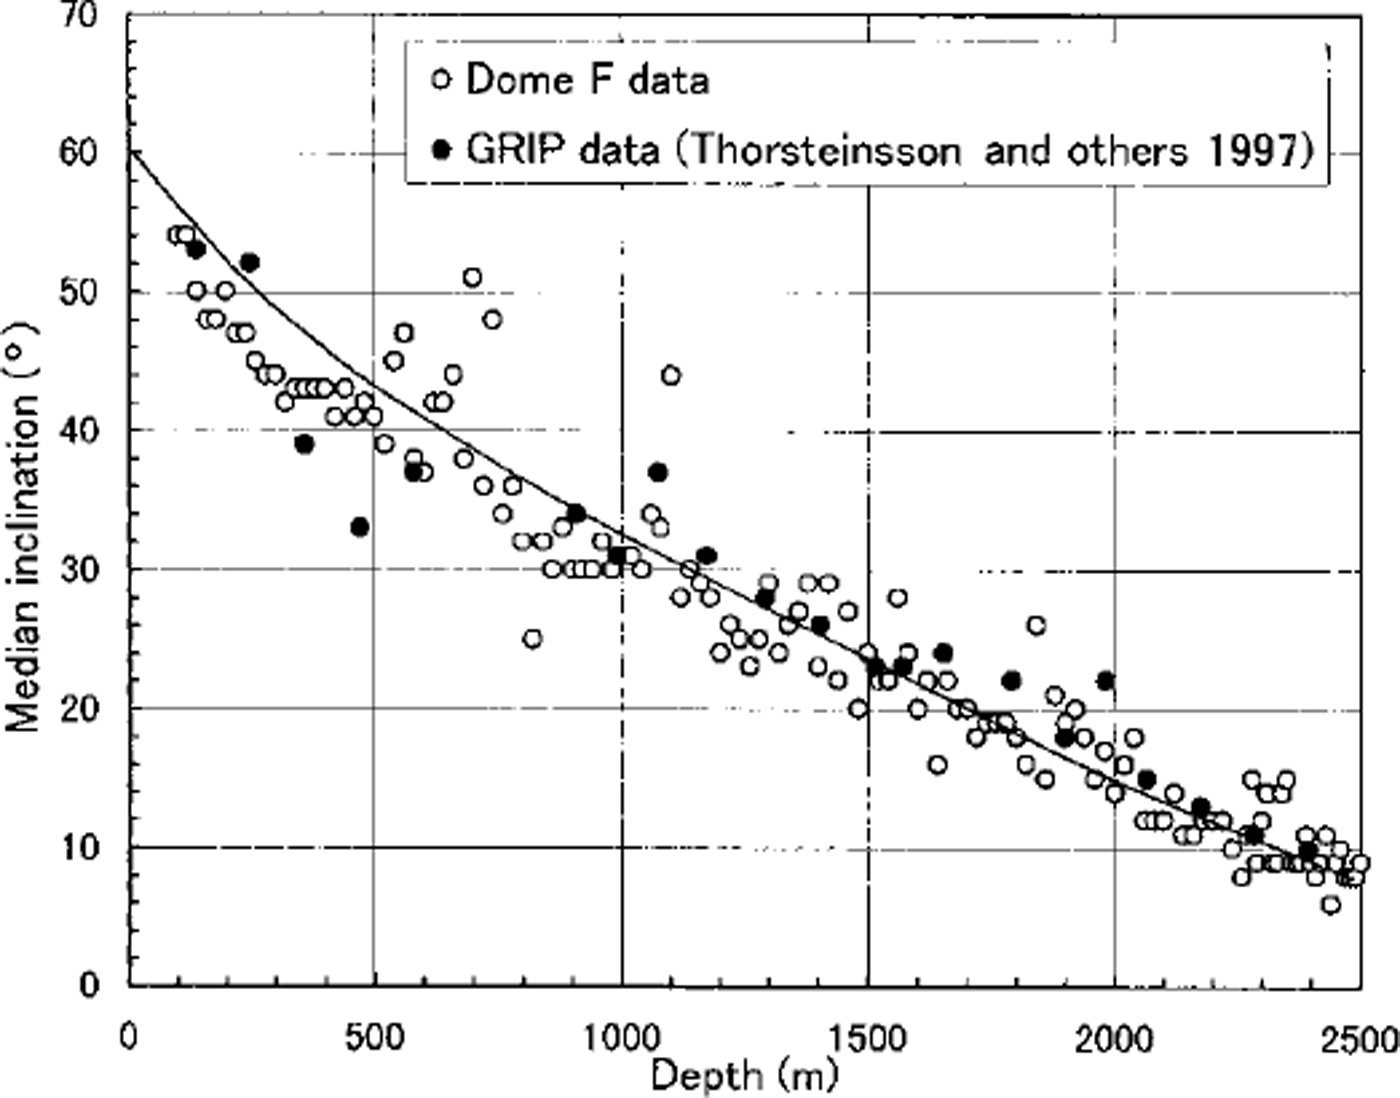
Median inclinations of c axes from the GRIP core (Reference Thorsteinsson, Kipfstuhl and MillerThorsteinsson and others, 1997) are plotted in Figure 7 to compare with those of the Dome Fcore. The degrees of median inclination in the two cores are in good agreement. The ice thickness at both Dome F and GRIP is approximately 3000 m. Assuming that both ice sheets are in steady state and that ice deformation obeys Nye’s model (which means that vertical strain rate is a constant throughout the depth), the calculated results of ,-axis rotation due to uniaxial compression using an anisotropic flow model (Reference AzumaAzuma,1994) are represented by the solid line. In spite of differences in ice temperatures and strain rates between Dome F and GRIP, good fits of both datasets of c-axis orientation to the theoretical calculation suggest that ice deformation beneath both summits is not far from Nye’s model.
Median inclination of Dome F core and GRIP core ( Reference Thorsteinsson, Kipfstuhl and MillerThorsteinsson and others, 1997).
Conclusions
The crystallography ice fabrics and textures from the 2500 m deep Dome F core have been studied. The results show that the crystal size steadily increases with depth, and its variation correlates well with the δ18O profile. The ,-axis orientation fabrics gradually change with depth from a random orientation pattern near the surface to a strong vertical single maximum, very similar to those observed in the GRIP core. The proportion of crystals elongated horizontally increases with depth. From the present study it is concluded that the ice-sheet ice beneath Dome F deforms without nucleation recrystallization, to a depth of at least 2500 m.
Acknowledgements
The research was carried out within the framework of the Ice Core Consortium program on the Dome Fuji research project. We are grateful to K. Chujo, K. Sato, M. Kawaguchi, M. Nishioka, T Kakihara and T. Uno who assisted with sampling and operating the present system. We would like to thank T. Thorsteinsson, T.H.Jacka, Lijun and an anonymous reviewer for helpful comments.



