Introduction
During the past few decades the search for life elsewhere in the universe has risen to the forefront of scientific research (Gleiser Reference Gleiser2012). This is motivated by recent discoveries of exoplanets, including the discoveries of super-Earths (Marcy et al. Reference Marcy2005) and Earth-like planets (Cassan et al. Reference Cassan2012), opening up the possibility of a potentially large number of habitable planetary platforms beyond Earth. In addition, carbon isotopic evidence indicating that life existed on Earth at least as early as 3.5 billion years ago (Bya) (Schopf Reference Schopf1993a, Reference Schopfb; van Zuilen et al. Reference Viedma2002), and the discoveries of extremophilic life forms on Earth (Satyanarayana et al. Reference Satyanarayana, Raghukumar and Shivaji2005), suggest that life can survive and even thrive under harsher conditions than previously imagined. In light of such evidence, it is reasonable to conjecture that at least simple, unicellular life may be more common in the universe than anticipated. When attempting to answer the question of how widespread life is, it is pertinent to examine the only example of abiogenesis known to date: the origin of life on Earth.
One of the most distinctive features of life – the existence of a specific and seemingly universal chiral signature – also presents one of the longest standing mysteries in studies of abiogenesis. It is well known that chiral selectivity plays a key role in the biochemistry of living systems: nearly all life on Earth contains exclusively dextrorotary sugars and levorotary amino acids. Quite possibly, the development of homochirality was a critical step in the emergence of life. Although there are numerous models for the onset of homochirality presented in the literature, none is conclusive: the details of chirobiogenesis remain unknown.
We propose that the environment of early Earth played a crucial role in chirobiogenesis. Environmental effects, when strong enough, can destroy any memory of a prior chiral bias, whatever its origin. They can also drive a specific chiral choice. Life's chirality is interwoven with early-Earth's environmental history; specifically, with how the environment influenced the prebiotic soup that led to first life. The same should be true of life anywhere in the cosmos. As remarked in Gleiser (Reference Gleiser2012), ‘the history of life in a planet mirrors the planet's life history’. Here, it will be argued that the same is true for life's chirality.
Life in the universe
The rapidity with which life first appeared on Earth is often cited as evidence that life may be common in the universe. Observational constraints on the timescale for the origin of life on Earth suggest that Earth-like planets older than about 1 Gyr support their own abiogeneses with a probability >13% at the 95% confidence level (Lineweaver & Davis Reference Lineweaver and Davis2002). Combining this estimate with results demonstrating that Earth-like planets in habitable zones may be a common by-product of star formation (Kasting et al. Reference Kasting, Whitmire and Reynolds1993; Lineweaver Reference Lineweaver2001), the search for extraterrestrial life may yield promising results in the near future. However, until extraterrestrial life is discovered, the existence of life on Earth is our only insight into abiogenesis, presenting important clues on the likelihood of life elsewhere in the universe.
Given early Earth's tumultuous environment, it is remarkable that paleontological evidence suggests life may have been thriving as early as 3.5 Bya (Schopf Reference van Zuilen, Lepland and Arrhenius1993a, Reference Schopfb; van Zuilen et al. Reference van Zuilen, Lepland and Arrhenius2002). Perhaps even more surprising are results suggesting that any early life may have been killed off as late as 3.8 Bya (Maher & Stevenson Reference Maher and Stevenson1988; Sleep et al. Reference Sleep1989). These findings indicate that the origin and early diversification of life occurred within a window as short as 300 million years. Additional constraints stemming from the half-life of prebiotic compounds and the recycling of oceans through hydrothermal vents set an even shorter timescale for abiogenesis, estimated to be as brief as 5 million years (Lazcano & Miller Reference Lazcano and Miller1996).
The short timescales constraining the origin of life on Earth shed little light on the environmental conditions required for abiogenesis. The question of where life began remains open, with few details known about where the first prebiotic ingredients may have been synthesized. Potential sites for the origin of life include submarine vents (Corliss et al. Reference Corliss, Baross and Hoffman1981), primordial beaches (Bywater & Conde-Frieboes Reference Bywater and Conde-Frieboes2005), and shallow pools and lagoons (Robertson & Miller Reference Robertson and Miller1995). An even more debated aspect of the puzzle is whether the ingredients for life originated on Earth or were delivered to Earth from outerspace (Chyba & Sagan Reference Chyba and Sagan1992). Evidence supporting the latter hypothesis includes the ubiquity of organic chemical ingredients in the interstellar medium (Charnley et al. Reference Charnley, Rogers, Kuan and Huang2002) and in the solar system in carbonaceous chondrites (Cronin Reference Cronin1989). However, organic compounds have also been shown to be readily synthesized under conditions likely to be prevalant on the prebiotic Earth (Miller Reference Miller1953; Ring et al. Reference Ring, Wolman, Friedmann and Miller1972; Wolman et al. Reference Wolman, Haverland and Miller1972).
Of equal ambiguity is the mechanism of abiogenesis. Although the uniformity of life on Earth suggests that all extant organisms descended from a last universal common ancestor (LUCA), we know almost nothing about the abiotic ingredients and prebiotic chemistries present on the primitive Earth from which the LUCA evolved (Orgel Reference Orgel1998a, Reference Orgelb). Potential mechanisms range from ‘metabolism-first’ models, such as the iron-sulfide world hypothesis of Wächtershäuser (Wächtershäuser Reference Wächtershäuser1992) and ‘membrane-first’ lipid-world scenarios as investigated by Deamer and co-workers (Morowitz et al. Reference Morowitz, Heinz and Deamer1988; Monnard & Deamer Reference Monnard and Deamer2002), to the ‘peptide-first’ models proposed by Fox (Fox Reference Fox1973, Reference Fox1995) and others (Fishkis Reference Fishkis2007; Gleiser & Walker Reference Gleiser and Walker2008, Reference Gleiser and Walker2009), and the popular ‘genetics-first’ hypotheses such as the RNA (Gilbert Reference Gilbert1986) and pre-RNA (Orgel Reference Orgel2000) world scenarios. In considering any of these models, one must investigate how the characteristic properties of life might have arisen – including the emergence of homochirality.
With such a short window for the origin of life, it is likely that the primordial Earth experienced multiple abiogeneses. As has been pointed out by Davies and Lineweaver (Reference Davies and Lineweaver2005), if large impacts had frustrated abiogenesis, then as the frequency of impacts abated at the end of heavy bombardment, there would have been brief quiescent periods when life may have emerged only to be annihilated by the next large impact. Extending this to studies of potential abiogenic mechanisms, we must therefore be mindful that in prebiotic Earth reactor pools were submitted to environmental disturbances ranging from mild (e.g. tides and evaporating lagoons) to severe (e.g. volcanic eruptions and meteoritic impacts). Both kinds of disturbances must have affected the evolution of chirality in early Earth (Bradenburg & Multamäki Reference Brandenburg and Multamäki2004; Gleiser et al. Reference Gleiser, Thorarinson and Walker2008; Hochberg Reference Hochberg2009). For the remainder of this work, we will discuss how such a scenario might have played out.
Deciphering the origin of life's chirality
An important question is whether the observed homochirality of biomolecules is a prerequisite for life's emergence or if it developed as its consequence (Cohen Reference Cohen1995; Bonner Reference Bonner and Cline1995). Adding to the mystery, prebiotically relevant laboratory syntheses yield racemic mixtures (Dunitz Reference Dunitz1996). Therefore, a chiral selection process must have occurred at some stage in the origin or early evolution of life (Bada Reference Bada1997).
A common viewpoint is that chiral selection occurred at the molecular level (Lahav Reference Lahav2007), and that the resultant complexity of molecular species led to the eventual emergence of life. This view is based on the argument that life could neither exist nor originate without biomolecular asymmetry (Bonner Reference Bonner and Cline1995), and is supported by experiments demonstrating that specific conformations of structural entities such as α-helices and β-sheets can only form from enantiomerically pure building blocks (Cline Reference Cline1995; Fitz et al. Reference Fitz, Reiner, Plakensteiner and Rode2007) (for an alternative viewpoint, see Nielsen Reference Nielsen2007). Taking this bottom-up approach, we therefore assume that the prebiotic conditions necessary for the subsequent development of complex biomolecules had to be chiral.
Modelling prebiotic homochirality
Although it was Louis Pasteur (Pasteur Reference Pasteur1848), inspired by previous work by Biot, who in the late 1840s was the first to recognize that many biomolecules display mirror asymmetry, it was not until the pioneering work of Frank (Reference Frank1953), over 100 years later, that the first breakthrough in understanding the origin of this asymmetry was presented. In this influential work, Frank identified autocatalysis and some form of mutual antagonism as necessary ingredients for obtaining biomolecular homochirality from prebiotic precursors. In the ensuing decades, many models exhibiting such features have been proposed, each providing its own description of chiral symmetry breaking.
The various models presented in the literature range from investigations of simple modifications to Frank's original model (Kondepudi & Nelson Reference Kondepudi and Nelson1983; Hochberg & Zorzano Reference Hochberg and Zorzano2007), to more recent studies describing the onset of homochirality in crystallization (Saito & Hyuga Reference Saito and Hyuga2005a; Viedma Reference Viedma2005), and chiral selection during polymerization (Sandars Reference Sandars2003; Saito & Hyuga Reference Saito and Hyuga2005b) (see Plasson et al. Reference Plasson2007, for a detailed discussion). Among these ‘Frank’ models, one of the better known is that of Sandars (Sandars Reference Sandars2003), which provides a basis for understanding chiral symmetry breaking in an RNA world (Nilsson et al. Reference Nilsson2005). This model succeeds because it includes both the necessary features of antagonism and autocatalysis as originally proposed by Frank, where the mutual antagonism is provided by enantiomeric cross-inhibition as is observed in template-directed polycondensation of polynucleotides (Joyce Reference Joyce1984). (These terms will be clarified below.)
As various authors have pointed out (Brandenburg et al. Reference Brandenburg, Lehto and Lehto2007; Plasson et al. Reference Plasson2007; Gleiser & Walker Reference Gleiser and Walker2009), when addressing the validity of the Sandars model one must consider that the autocatalysis necessary for chiral symmetry breaking in such systems is presently only observed for a few non-biological molecules (Soai et al. Reference Soai, Shibata, Choji and Morioka1995; Blackmond Reference Blackmond2004), and would be trying to achieve with even very simple organic molecules (Joyce Reference Joyce1991). Despite this shortcoming, the RNA world hypothesis is still deemed viable by some authors (Monnard Reference Monnard2007). In addition, the Sandars model provides an elegant, and relatively simple, model of chiral symmetry breaking, while sharing general features in common with other (usually more complicated) models, and as such it has been extensively studied in the literature (Brandenburg & Multamäki Reference Brandenburg and Multamäki2004; Gleiser Reference Gleiser2007). As we know little about the compositions of the primitive atmospheres and seas (Lazcano & Miller Reference Lazcano and Miller1996) and even less about prebiotic chemistry (Orgel Reference Orgel1998a, Reference Orgelb), it is pertinent to study general features as opposed to details of specific models. We thus begin by investigating the Sandars model as the basis of our study with the reasonable expectation that the results should be qualitatively similar for other models. We will then briefly describe a recently developed polymerization model that obtains a substantial amount of chiral bias without any specific external source: only the reaction rates display chiral dependence which may be induced environmentally (Gleiser et al. Reference Gleiser, Nelson and Walker2012).
In Sandars-like models and in most models that seek to explain homochirality, a small initial chiral asymmetry is amplified due to non-linearities. This initial chiral excess can be classified as endogenous or exogenous. By endogenous causes we mean those that are intrinsic to the physics and/or chemistry of the reactor pool. For example, parity symmetry breaking in the weak nuclear interactions has been proposed as a possible source of the initial homochiral excess (Yamagata Reference Yamagata1966; Kondepudi & Nelson 1985; Salam Reference Salam1991), although the numbers obtained in quantum computations using perturbed Hamiltonians are exceedingly small.
In contrast, exogenous sources are caused by outside influences. Examples of exogenous sources of initial chiral bias include circularly-polarized UV light from active star formation regions (Lucas et al. Reference Lucas2005), and deposits of chiral compounds by meteoritic bombardment (Cronin 1989). Another possibility of an exogenous influence is that chirality is induced by a clay template, such as in recent results for n-propyl NH3Cl vermiculite clay gels (Fraser et al. Reference Fraser, Fitz, Jakschitz and Rode2011), which exhibit chiroselective absorption of amino acids.
At this point, the debate is still open as to whether any of these possible sources of chiral bias was present at prebiotic times and, if it was, whether it was efficient or necessary. Gleiser, Walker and Thorarinson have recently argued that even if an initial chiral excess was produced by any of these (or other) mechanisms, environmental disturbances could have erased it, restoring either achiral conditions or switching chirality in the opposite direction: chiral selection might be the result of a series of stochastic reversals prompted by large temperature and/or density fluctuations, or other possible environmental effects (Gleiser et al. Reference Gleiser, Thorarinson and Walker2008). Similar conclusions were recently reached (Hochberg Reference Hochberg2009; Hochberg Reference Hochberg2010). Accordingly, the question of biological homochirality cannot be separated from the details of planetary history. The same holds for any other planetary platform displaying stereoselective chemistry.
Prebiotic homochirality as a critical phenomenon
Although the details of models describing the onset of prebiotic homochirality mentioned above differ, the qualitative features are the same; chiral symmetry breaking occurs due to the introduction of instabilities to the symmetric (racemic) state that lead to spontaneous symmetry breaking in physical systems (Plasson et al. Reference Plasson2007; Gleiser Reference Gleiser2007). In other words, the spatiotemporal dynamics of the reaction network is equivalent to a two-phase system undergoing a symmetry-breaking phase transition, where the order parameter is the net chiral asymmetry, A. If we define L and D as the sums of all left- and right-handed chiral subunits, respectively, then the net chirality may be defined as
 $$A = \displaystyle{{L - D} \over {L + D}}.$$
Note that the net chirality is symmetric A 0 = 0 in the racemic state, and asymmetric in the non-racemic states. The reaction network is a non-linear dynamical system with behaviour controlled by model-dependent parameters, including fidelity of enzymatic reactions (Sandars Reference Sandars2003; Brandenburg & Multamäki Reference Brandenburg and Multamäki2004; Wattis & Coveney Reference Wattis and Coveney2005), ratios of reaction rates (Gleiser & Walker Reference Gleiser and Walker2008), stereoselectivity (Plasson et al. Reference Plasson, Bersini and Commeyras2004) and total mass (Gleiser & Walker Reference Gleiser and Walker2009).
Just as in other areas of physics, environmental interactions can restore the system to the symmetric (racemic) state, even in cases where model parameters are set such that the asymmetric state is stable. In such cases, it is important to consider how temperature, or other environmental effects, might work to restore the stability of the racemic state. Thinking in this direction, it was Salam (Reference Salam1991) who first suggested that there should be a critical temperature, T c, above which any net chirality is destroyed. One can think in analogy with a ferromagnet: if heated through the Curie point any net magnetization is erased and the system is restored to a symmetric configuration. Here, the net chirality plays the role of the net magnetization. While Salam conceded that calculating T c would be challenging using the electroweak theory of particle physics (assuming the weak force biases chiral selection; Yamagata Reference Yamagata1966; Kondepudi & Nelson Reference Kondepudi and Nelson1985), a different route was recently taken by Gleiser and Thorarinson (Reference Gleiser and Thorarinson2006). Coupling the reaction network to an external environment modelled by a stochastic force, they were able to determine the critical point for homochirality in two and three dimensions. We move now to a discussion of their work.
Modelling spatiotemporal polymerization
Although the work of Gleiser and Thorarinson was based on the Sandars model, from the above discussion and the work of Gleiser and Walker (Reference Gleiser and Walker2008) we expect the results to be quite general. The reaction network proposed by Sandars includes the following polymerization reactions:
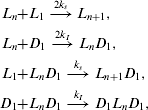 $$\eqalign{L_n + & L_1 \buildrel {2k_s} \over \longrightarrow L_{n + 1}, \cr L_n + & D_1 \buildrel {2k_I} \over \longrightarrow L_n D_1, \cr L_1 + & L_n D_1 \buildrel {k_s} \over \longrightarrow L_{n + 1} D_1, \cr D_1 + & L_n D_1 \buildrel {k_I} \over \longrightarrow D_1 L_n D_1,} $$
supplemented by reactions for D-polymers by interchanging L with D. A ‘left-handed’ polymer L n made of n left-handed monomers, L 1, may grow by adding another left-handed monomer with a rate k s, or be inhibited by adding a ‘right-handed’ monomer D 1 with a rate k s. The latter process is referred to as enantiomeric cross-inhibition: attachment of a monomer with opposite chirality to one end of a growing chain terminates growth on that end of the chain (Joyce et al. Reference Joyce1984) and inhibits any further enzymatic activity. This process is the driving force that causes a net asymmetry to develop in this model (Gleiser & Walker Reference Gleiser and Walker2008).
In addition, the reaction network includes a substrate, S, from which monomers of both chiralities are generated: 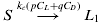 $S\buildrel {k_c (\,pC_L + qC_D )} \over \longrightarrow L_1 $;
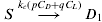 $S\buildrel {k_c (\,pC_D + qC_L )} \over \longrightarrow D_1 $, where
 $p = {\textstyle{1 \over 2}}(1 + f)$ and
 $q = {\textstyle{1 \over 2}}(1 - f)$, with f a measure of the enzymatic fidelity. So, if p=q, f = 0 and there is no stereoselectivity, while if p = 1 and q = 0, that is, when there is perfect stereoselectivity, f = 1. C L(D) determines the enzymatic enhancement of chirally-pure L(D)-handed monomers, and are assumed to depend on the length of the largest polymer in the reactor pool, N, such that C L(D)=L n(D n) (Sandars Reference Sandars2003). Other choices are possible, but lead to similar qualitative results (Gleiser & Walker Reference Gleiser and Walker2008).
Given that the Soai reaction (Soai et al. Reference Soai, Shibata, Choji and Morioka1995) – the most well-known illustration of an autocatalytic network leading to chiral purity – features at least dimers as catalysts (Blackmond Reference Blackmond2004), we focus on the truncated system for N = 2. We note that it is possible to make this truncation while maintaining the essential aspects of the dynamics leading to homochiralization (Gleiser & Walker Reference Gleiser and Walker2008). The reaction network is further simplified by assuming that the rate of change of the substrate, [S], and of the dimers, [L 2] and [D 2], is much slower than that of the monomers, [L 1] and [D 1]. These approximations are known as the adiabatic elimination of rapidly adjusting variables (Haken Reference Haken1983) and have been shown to produce a reliable approximation to the full (n > 2) Sandars model (Gleiser & Walker Reference Gleiser and Walker2008).
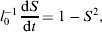
It is convenient to introduce the dimensionless symmetric and asymmetric variables, S = X+Y and A = X−Y, where X = [L 1](2k s/Qs)1/2 and Y = [D 1](2k s/Q s)1/2, respectively (Brandenburg & Multamäki Reference Brandenburg and Multamäki2004). For k s/k I = 1, after a little algebra, the reaction network simplifies toFootnote 1
 $$l_0^{ - 1} \displaystyle{{{\rm d}S} \over {{\rm d}t}} = 1 - S^2, $$
 $$l_0^{ - 1} \displaystyle{{{\rm d}A} \over {{\rm d}t}} = \displaystyle{{2fSA} \over {S^2 + A^2}} - SA,$$
where l U = (2k SQ)1/2 has the dimensions of inverse time. S = 1 is a fixed point: the system tends quickly towards this value at timescales of order  $l_U^{ - 1} $.
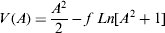
Substituting S = 1 into equation (3), we obtain an effective potential for V(A)
 $$V(A) = \displaystyle{{A^2} \over 2} - f\; Ln[A^2 + 1]$$
with fixed points $A = 0;\, \pm \sqrt {2f - 1} $. Note that for f < 1/2 an enantiomeric excess is impossible and the only steady state is the (stable) symmetric state. In the case f = 1, the potential takes the form of a symmetric double-well, where the two fixed asymmetric steady states are homochiral (Λ = ±1) and represent the global minima. In this case, the symmetric state is unstable.
The form of this potential introduces the possibility of describing chiral symmetry breaking as a phase transition. This, in fact, suggests that a proper treatment of the problem should include spatial dependence. To introduce spatial dependence to the reaction network, the usual procedure in the phenomenological treatment of phase transitions is implemented with the substitution  ${\rm d}/{\rm d}t \to \partial /\partial t - k\nabla ^2 $, where k is the diffusion constant (Brandenburg & Multamäki Reference Brandenburg and Multamäki2004). In this coarse-grained approach, the number of molecules per unit volume is large enough so that the concentrations vary smoothly in space and time. Dimensionless time and space variables are then defined as t 0=l 0t, and x 0=x(l 0/k)1/2, respectively. For diffusion in water, k = 109 m2 s−2, and nominal values k S = 10−23 cm3 s−2 and Q = 1013 cm−3 s−2, we obtain
 $l_{U} = \sqrt 2 \times 10^{ - 5} \;{\rm s}^{ - {\rm 2}} $ corresponding to t = (7 × 10⁴s)t 0 and x = (1 cm)x 0.
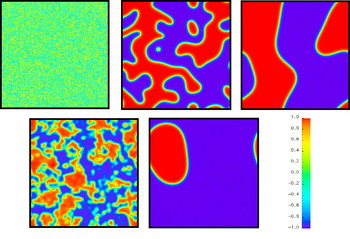
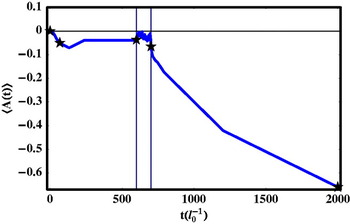
Considering the case where f = 1, for near-racemic initial conditions (|Λ(0, x, y, z)| ⩽ 10−1), the spatiotemporal evolution leads to the formation of left- and right-handed percolating chiral domains separated by domain walls, as is well known from systems in the Ising universality class (see Fig. 1). Surface tension drives the walls until their average curvature matches approximately the linear dimension of their confining volume. At this point, wall motion becomes quite slow, d(Λ(t))/dt → 0, where 〈A(t)〉 is the spatially averaged value of the net chiral asymmetry, and the domains coexist in near dynamical equilibrium in that the net stresses add to zero (see Fig. 1, top right). The time evolution of A(t) is shown in Fig. 2. For such model systems, and considering only diffusive processes, it has been shown that the presence of a bias from parity-violating weak neutral currents (PV) or most circularly polarized light (CPL) sources (Lucas et al. Reference Lucas2005) (even in the unlikely situation where they could be sustained unperturbed for hundreds of millions of years), would not lead to chirally pure prebiotic conditions, since the timescales needed for efficient chiral bias would be longer than the hundred of million years or so allowed from current data on the origin of life (Gleiser Reference Gleiser2007). Furthermore, such biases are overwhelmed by environmental influences, as shown below.
Evolution of 2d chiral domains. Red (+1 on the colour bar) corresponds to the L-phase and blue (−1 on the colour bar) corresponds to the D-phase. Time runs from left to right and top to bottom. Top left, the near-racemic initial conditions. Top mid and top right, evolution of the two percolating chiral domains separated by a thin domain wall. Bottom left, environmental effects break the stability of the domain wall network. Bottom right, subsequent surface-tension driven evolution leads to an enantiomerically pure world.

Time evolution of the spatially averaged net chirality corresponding to the snapshots shown in Fig. 1. Stars denote times for snapshots and vertical lines mark the beginning and end of stochastic environmental influence.

Coupling to the environment: a critical point for homochirality
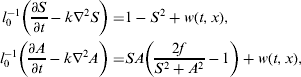
Chiral symmetry breaking in the context of this model can be understood in terms of a second-order phase transition, where the critical ‘temperature’ is determined by the strength of the coupling between the reaction network and the external environment. The external environment is modelled via a generalized spatiotemporal Langevin equation (Gleiser & Thorarinson Reference Gleiser and Thorarinson2006) by rewriting equation (3) as
 $$\eqalign{l_0^{ - 1} \left( {\displaystyle{{\partial S} \over {\partial t}} - k\nabla ^2 S} \right) = & 1 - S^2 + w(t,x), \cr l_0^{ - 1} \left( {\displaystyle{{\partial A} \over {\partial t}} - k\nabla ^2 A} \right) = & SA\left( {\displaystyle{{2f} \over {S^2 + A^2}} - 1} \right) + w(t,x),} $$
where l U = (2k SQ)1/2 and w(x, t) is a dimensionless Gaussian white noise with two-point correlation function (w(x′, t′)×w(x, t))=a 2δ(t′−t)δ(x′−x). The parameter a 2 is a measure of the environmental influence. For example, in the mean-field models of phase transitions, it is common to write a 2 = 2γk ST, where γ is the viscosity coefficient, k 8 is Boltzmann's constant and T is the temperature. Using the dimensionless space and time variables, t r=l μt, and χμ=x(l U/k)2/2, introduced above, the noise amplitude scales as  $a_0^3 \to {\rm \lambda} _0^{ - 1} ({\rm \lambda} _0 /k)^{d/2} a^2 $, where a 1 is the number of spatial dimensions. A crucial point is that even in the case of perfect fidelity, f = 1, where the potential supports stable homochiral steady-states, an enantiomeric excess may not develop if a is above a critical value a c.
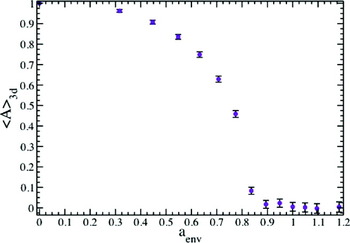
As shown in Fig. 3, an Ising phase diagram can be constructed showing that (Λ) → 0 for a>a c and chiral symmetry is restored. The value of a c has been obtained numerically in two ( $a_{\rm c}^2 = 1.15(k/l_0^2 ){\rm cm}^2 \,{\rm s}$) and three (
 $a_{\rm c}^2 = 0.65(k^3 /l_0^5 )^{1/2}\; {\rm cm}^3 \,{\rm s}$) dimensions (Gleiser & Thorarinson Reference Gleiser and Thorarinson2006). Above a c the stochastic forcing due to the external environment overwhelms any local excess of L over D within a correlation volume V ξ = ξd, where ξ is the correlation length: racemization is achieved on large scales and chiral symmetry is restored throughout space.
Average enantiomeric excess versus environmental noise amplitude in three dimensions. The error bars denote ensemble averages over 20 runs.

In light of these results, it has been shown that within the violent environment of prebiotic Earth, effects from sources such as weak neutral currents (which introduce a small tilt in the potential), even if cumulative, would be negligible: any accumulated excess could be easily wiped out by an external disturbance (Gleiser & Thorarinson Reference Gleiser and Thorarinson2006; Gleiser et al. Reference Gleiser, Thorarinson and Walker2008). The history of life on Earth and on any other planetary platform is inextricably enmeshed with its early environmental history.
Punctuated chirality (Gleiser et al. Reference Gleiser, Thorarinson and Walker2008)
The results of the previous section indicate that the environment of early Earth, or other potential prebiotic extraterrestrial environments, must have played a crucial role in chirobiogenesis. The chirality of the prebiotic soup might have been reset multiple times by significant environmental events such as active volcanism and meteoritic bombardment. Under this view, the history of prebiotic chirality is interwoven with the Earth's environmental history through a mechanism we call punctuated chirality (Gleiser et al. Reference Gleiser, Thorarinson and Walker2008): life's homochirality resulted from sequential chiral symmetry breaking triggered by environmental events.
Punctuated chirality is an extension of the punctuated equilibrium hypothesis of Eldredge and Gould (Reference Eldredge, Gould and Schopf1972) to prebiotic times. The theory of punctuated equilibrium describes evolutionary processes whereby speciation occurs through alternating periods of stasis and intense activity prompted by external influences: the punctuation is the geological moment when species arise which may be slow by human standards but is certainly abrupt by planetary standards as evidenced by the fossil record. If phyletic gradualism (traditional Darwinian evolution) is like pushing a ball up an inclined plane, then punctuated equilibrium is like climbing a staircase (Gould Reference Gould1991).
It is commonly accepted that molecules undergo selective processes that lead to evolutionary adaptions (see, e.g. Kimura Reference Kimura1968; Trevors Reference Trevors1997). It is therefore natural to extend the punctuated equilibrium hypothesis to the prebiotic realm. In this context, the concept of punctuated equilibrium is borrowed with some freedom: the network of chemical reactions described in prebiological systems is a non-equilibrium open system capable of exchanging energy with the environment. The periods of stasis that develop correspond to steady-states in that even though environmental influences may be negligible, chemical reactions are always occurring so as to keep the average concentrations of reactants at a near-constant value.
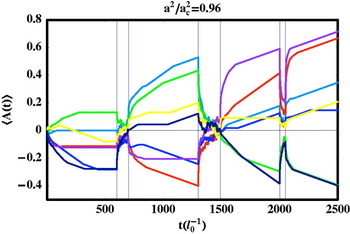
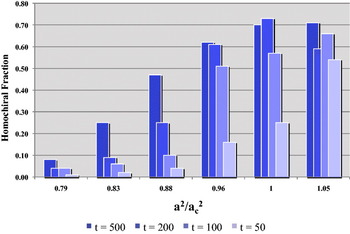
As an example of punctuated chirality in a prebiotic scenario, one can consider how repeated environmental interactions influence the evolution of chirality in the context of the model presented in the previous section. In Fig. 4, we show several 2d runs where the environmental effects vary in duration, while their magnitude was set at a 2/a c2 = 0.96, so that the magnitude of the disturbance is just below the critical value found by Gleiser and Thorarinson (Gleiser & Thorarinson Reference Gleiser and Thorarinson2006). Each coloured line represents a prebiotic scenario, with the same environmental disturbances of different duration occurring in sequence.
Punctuated chirality. Impact of environmental effects of varying duration and fixed magnitude (a 2/a c2 = 0.96) on the evolution of prebiotic chirality in 2d. Short events (last from left), which have little to no effect, should be contrasted with longer ones, which can drive the chirality towards purity and/or reverse its trend. (See, e.g. the green line.)

In order to investigate the impact of environmental effects on chiral selectivity, the scenarios reflect situations where there is no chiral selection, that is, where the two phases coexist in dynamical equilibrium (mathematically, when d(Λ(t))/dt → 0 for Λ(t)≠ ± 1; chemically, in a steady state). We observe that long disturbances can drive the net chirality towards purity ((Λ(t)) → ±1 for large t): the noise destabilizes the phase coexistence in favour of a homochiral system. Furthermore, note that subsequent events may erase any previous chiral bias, favouring the opposite handedness. In other words, environmental effects of sufficient intensity and duration can reset the chiral bias. This is true even if the system evolves towards homochirality prior to any environmental event.
Figure 5 summarizes the results of a detailed statistical analysis of 100 2d runs that led to initial domain coexistence, that is, d{Λ}/dt = 0 (see Fig. 4 for t<600) [34]. The horizontal axis displays the magnitude of the disturbance in units of a c2. The vertical axis gives the fraction of homochiral worlds, that is, those that after the disturbance obtain chiral purity. The colours represent the duration of the event. For a 2 ⩾ 0.96a c2, that is, near the critical region, all but the shortest events (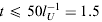 $t \leqslant 50 & l_ U^{ - 1} = 1.5$ months, for the nominal value of
 $l_U = \sqrt 2 \times 10^{ - 5} \hskip 1pt {\rm s}^{ - 2} $ mentioned previously) lead to statistically significant chiral biasing. Results in 3d are qualitatively very similar [34].
Fraction of 2d homochiral worlds after a single environmental event. Colours indicate duration of the event, while the horizontal axis labels its magnitude in units of a c2, the critical value for chiral symmetry restoration. The statistical sample included 100 runs and the timescales of the events are in units t{l U−1}.

Chirality from chiral-selective reaction rates (Gleiser et al. Reference Gleiser, Nelson and Walker2012)
Could prebiotic homochirality be achieved without autocatalysis exclusively through chiral-selective reaction rate parameters without any other explicit mechanism for chiral bias? In a recent work, we investigated this question, focusing on the simplest possible chemical network: no autocatalysis and no enantiomeric cross-inhibition, the trademarks of Frank-like chirobiogenesis models. Instead, we investigated how rare a set of chiral-selective reaction rates in a polymerization model needs to be in order to generate a reasonable amount of chiral bias. We quantified our results adopting a statistical approach: varying both the mean value and the rms dispersion of the relevant reaction rates, we showed that moderate to high levels of chiral excess can be achieved.
Consider a polymerization reaction network where activated L and D monomers (L and  $D_1^* $, respectively), can chain up to generate longer homochiral or heterochiral molecules. (Here, ‘activated’ refers to these monomers being highly reactive due to energy input into the reactor pool.) The model reactions include deactivation of activated monomers,
 $$L_1^* \buildrel {h_L} \over \longrightarrow L_1 ;\;D_1^* \buildrel {h_D} \over \longrightarrow D_1 $$
and the polymerization reactions
 $$L_1^* + L_i \buildrel {a_L} \over \longrightarrow L_{i + 1} ;\;D_1^* + D_j \buildrel {a_D} \over \longrightarrow D_{\,j + 1}, $$
 $$L_1^* + D_j \buildrel {a_L} \over \longrightarrow M_{1j} ;\;D_1^* + L_i \buildrel {a_D} \over \longrightarrow M_{i1}, $$
 $$L_1^* + M_{ij} \buildrel {a_L} \over \longrightarrow M_{i + 1j} ;\;D_1^* + M_{ij} \buildrel {a_D} \over \longrightarrow M_{ij + 1}, $$
where h L(D) is the deactivation rate for L(D)-monomers and a L(D) is the polymerization rate for adding activated L(D)-monomers to a growing chain. Here L i and D i denote homochiral polymers of length i and j, respectively, and M ij denotes polymers of mixed chirality consisting of t L-monomers and j D-monomers. There is no autocatalysis (either explicit or through enzymatic activity of homochiral chains) or enantiomeric cross-inhibition present. We also add a source S and a disappearance rate d to the reaction equations so as to model an open system. All reaction rates are scaled by the disappearance rate d.
Instead of assigning ad hoc values for the rates of opposite chirality, we conducted a statistical analysis whereby, for different numerical experiments, that is, different realizations of prebiotic scenarios, the values for L and D reactions rates were picked from a set allowed to randomly fluctuate about a given mean. In other words, each time we solved the coupled non-linear ordinary differential equations describing the reactions, we picked a set of random, Gaussian-distributed values for the four reactions rates h L(D) and a L(D) (for details, see Gleiser et al. Reference Gleiser, Nelson and Walker2012).
We define the enantiomeric excess [ee(t)], that is, the net chirality, as
 $$ee(t) = \displaystyle{{\left[ {L_1^* (t) + L_1 (t) + L(t)} \right] - \left[ {D_1^* (t) + D_1 (t) + D(t)} \right]} \over {\left[ {L_1^* (t) + L_1 (t) + L(t)} \right] + \left[ {D_1^* (t) + D_1 (t) + D(t)} \right]}}.$$
Note that our definition of the enantiomeric excess implicitly assumes that we are only interested in pure homochiral polymers. Here, we have taken the limit of large N in the polymerization equations and introduced
 $$L = \sum\limits_{i = 2}^\infty {L_i} ;\;D = \sum\limits_{\,j = 2}^\infty {D_j} ;\;M = \sum\limits_{i = 1;j = 1}^\infty {M_{ij}}, $$
for L, D and mixed polymers, respectively.
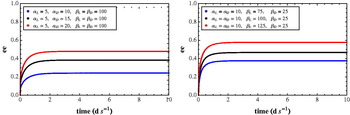
In Fig. 6, we show the behaviour of the time evolution of enantiomeric excess for several illustrative examples with S/d = σ = 200 and different choices for the reaction rates a L(D)/d = αL(D) and h L(D)/d = βL(D). (As long as σ>βL(D) results are not sensitive to choice of σ.) On the left, we show results with βL = βD = 100 fixed, and varying ratios of αL/αD. Shown are the results for αL = 0.5, αD = 10.0 ( ${\rm \alpha} _L /{\rm \alpha} _D = {\textstyle{1 \over 2}}$) in blue, αL = 0.5, αD = 15.0 (
 ${\rm \alpha} _L /{\rm \alpha} _D = {\textstyle{1 \over 3}}$) in black and αL = 0.5, αD = 20.0 (
 ${\rm \alpha} _L /{\rm \alpha} _D = {\textstyle{1 \over 1}}$) in red. The system quickly reaches a steady state with net chiral excess ee ss = 0.24, ee ss = 0.38 and ee ss = 0.48, respectively (corresponding to 24, 38 and 48% enantiomeric excess). On the right, we show results holding αL = αD = 10.0 fixed, and varying the ratio of βL/βD. Shown are the results for βL = 75, βL = 25 (βL/βD = 3) in blue, βL = 100, βL = 25 (βL/βD = 4) in black and βL = 125, βL = 25 (βL/βD = 5) in red. In this case the net chiral excess at steady-state is cc ss = 38, cc ss = 0.47, and cc ss = 58, respectively (corresponding to 38, 47 and 58% antiomeric excess). These test runs show that for differing left and right reaction rates a substantial amount of chiral excess may be reached at steady-state. Although for these examples the differences were fairly large, and that typically the net asymmetry of the reaction rates was larger than the resulting enantiomeric excess, we note that if the chiral-selective changes in rates appear in exponential factors (as in the example above for temperature dependence), small changes in the parameters may generate fairly large changes in the resulting reaction rates.
Time evolution of enantiomeric excess for illustrative examples of reaction rates with σ = 200. Left: βL = βD = 100, with varying ratios of αL/αD. Shown are αL = 5.0, αD = 10.0 (${\rm \alpha} _L /{\rm \alpha} _D = {\textstyle{1 \over 2}}$) in blue, αL = 5.0, αD = 15.0 (${\rm \alpha} _L /{\rm \alpha} _D = {\textstyle{1 \over 3}}$) in black, and αL = 5.0, αD = 20.0 (${\rm \alpha} _L /{\rm \alpha} _D = {\textstyle{1 \over 1}}$) in red. Right: αL = αD = 10.0, with varying ratios of βD/βL. Shown are βL = 75, βL = 25 (βL/βD = 3) in blue, βL = 100, βL = 25 (βL/βD = 4) in black and βL = 125, βL = 25 (βL/βD = 5) in red.

We have performed a detailed statistical study of the reaction equations with fluctuating values for the L- and D-reaction rates αL, αD, βL and βD. This involves solving the coupled system of ordinary differential equations N times, each with values for the four reaction rates given by  ${\rm \alpha} _L = {\rm \bar \alpha} + {\rm \delta} _L $,
 ${\rm \alpha} _D = {\rm \bar \alpha} + {\rm \delta} _D $,
 ${\rm \beta} _L = {\rm \bar \beta} + {\rm \xi} _L $ and
 ${\rm \beta} = {\rm \bar \beta} _D + {\rm \xi} _D $, where the bars denote the mean values and δL(D) and ξL(D) are Gaussian-distributed random numbers, within a fixed rms width set by αL and βD βD.
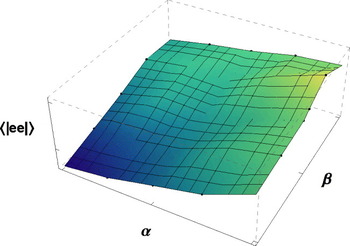
Our results indicate that the net chirality is overall more sensitive to the amplitude of the chiral-selective variations about the mean values of the reaction rates than to the values of the reaction rates themselves. In Fig. 7, we explore the spread in the distribution of the enantiomeric excess in experimental systems for an ensemble with  ${\rm \bar \alpha} = 20$,
 ${\rm \bar \beta} = 120$, and
 $0.1 \leqslant {\textstyle{{I_U} \over \alpha}} \leqslant 0.3$ and
 $0.1 \leqslant {\textstyle{{{\rm \beta} c} \over {\rm \beta}}} \leqslant 0.3$. Outliers in the distribution have very high enantiomeric excesses up to as much as 80–90%, although most systems fall within a range of enantiomeric excesses with |ee| < 0.25, where the mean of the distribution lies.
Distribution of ensemble ee values for N = 5000 with ${\rm \bar \alpha} = 20$, ${\rm \bar \beta} = 120$,  $0.1 \leqslant {\textstyle{{J_\parallel} \over J}} \leqslant 0.3$,
 $0.1 \leqslant {\textstyle{{{\rm \beta} _x} \over {\rm \beta}}} \leqslant 0.3$ and σ = 200.

Conclusions
During the past few decades, several biasing mechanisms have been proposed to explain life's remarkable homochirality. Parity violation in weak neutral currents (Yamagata Reference Yamagata1966), if effective, would provide a universal bias: all amino acids found in the universe should be ‘left-handed,’ or L. (Although one would still need to explain why sugars are ‘right-handed’ or D.) In contrast, circularly polarized UV light (Lucas et al. Reference Lucas2005), if produced in active star-forming regions, would act within a stellar system or, at most, within neighbouring stellar systems without any uniform bias: in different star-forming regions across the galaxy, stellar systems should have stereochemistry with uncorrelated chirality. One of us has recently argued that – if relegated to diffusive processes – both mechanisms would probably be ineffective within the timescales relevant for life's emergence on Earth (Gleiser Reference Gleiser2007). In any case, the point we are making here is stronger: punctuated chirality would render any biasing mechanism ineffective: environmental events have the potential to restore chiral symmetry and thus to wash out previous values of chirality locally and, for events of great violence, globally. The same conclusion holds for the very different mechanism towards homochirality described in the last section, where no autocatalysis or enantiomeric excess is needed to amplify an initial bias; instead, chiral-selective reaction rates alone can lead to substantial chiral excess. We noted that this chiral selectivity may also be prompted by environmental effects (Gleiser et al. Reference Gleiser, Nelson and Walker2012). Both parity violation and circularly polarized UV light predict that within the same stellar system, each planetary platform would have its own chiral bias, ultimately determined by its environmental history. In contrast, environmentally induced chiral selectivity is a local effect that depends on the particular history of the planetary platform harbouring life. We thus propose that it is possible to distinguish between the three mechanisms through future space missions aimed at studying stereochemistry (Welsh & Lunine Reference Welsh and Lunine2001). If chiral bias, as life on Earth, goes through periods of stasis (chemical steady state) punctuated by violent upheavals and symmetry restoration, we predict that there would be no chiral correlations even within the same stellar system: the same amino acid found, say, in Titan would not necessarily display the same chirality if found on Earth or Mars. Of course, only a large enough statistical sample would resolve the issue.
Biological precursors certainly interacted with the primordial environment and may have had their chirality reset multiple times before homochiral life first evolved. In this case, separate domains of molecular assemblies with randomly set chirality may have reacted in different ways to environmental disturbances. A final, Earth-wide homochiral prebiotic chemistry would have been the result of multiple interactions between neighbouring chiral domains (Brandenburg & Multamäki Reference Brandenburg and Multamäki2004; Gleiser Reference Gleiser2007; Gleiser & Walker Reference Gleiser and Walker2008) in an abiotic process that mimics natural selection.
Acknowledgments
MG is supported in part by a National Science Foundation grant PHY-1068027, and would also like to thank Fapesp and USP for the financial support to participate on SPASA 2011. SIW gratefully acknowledges support from the NASA Astrobiology Institute through the NASA Postdoctoral Fellowship Program.