1 Introduction
Gas bubbles rising in a liquid generate a peculiar kind of agitation, sometimes called pseudo-turbulence or bubble-induced turbulence. Probability density functions (p.d.f.s) of the liquid velocity components in a homogeneous swarm of high-Reynolds-number rising bubbles have been reported in several experimental works (Zenit, Koch & Sangani Reference Zenit, Koch and Sangani2001; Risso & Ellingsen Reference Risso and Ellingsen2002; Martínez Mercado, Palacios-Morales & Zenit Reference Martínez Mercado, Palacios-Morales and Zenit2007; Martínez Mercado et al. Reference Martínez Mercado, Chehata Gómez, Van Gils, Sun and Lohse2010; Riboux, Risso & Legendre Reference Riboux, Risso and Legendre2010). They have also been obtained in direct numerical simulations (Roghair et al. Reference Roghair, Martínez Mercado, van Sint Annaland, Kuipers, Sun and Lohse2011) and large-eddy simulations (Riboux, Legendre & Risso Reference Riboux, Legendre and Risso2013). In contrast to classic shear-induced turbulence, the p.d.f.s are clearly non-Gaussian. When a grid is used to generate additional fluctuations in a bubble column, the shape of the p.d.f. depends on the energy ratio between bubble-induced agitation and shear-induced turbulence (Rensen, Luther & Lohse Reference Rensen, Luther and Lohse2005; Prakash et al. Reference Prakash, Martínez Mercado, van Wijngaarden, Mancilla, Tagawa, Lohse and Sun2016). As the relative intensity of the shear-induced turbulence is increased, the p.d.f. progressively takes a Gaussian form. The present work focuses on the case where only bubble-induced agitation is present, with the objective to discuss the nature of the liquid fluctuations from the analysis of their p.d.f.s.
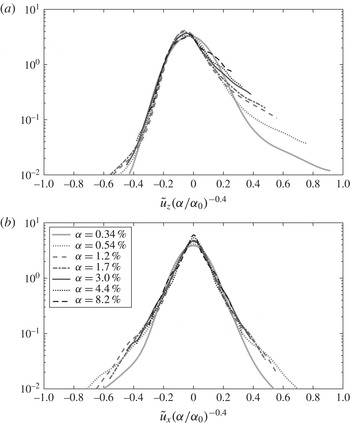
The p.d.f.s of liquid velocity fluctuations measured in a homogeneous swarm of bubbles for various gas volume fractions by Riboux et al. (Reference Riboux, Risso and Legendre2010) for case C (
 $Re=760$
) defined in table 1. (The reference volume fraction is
 $\unicode[STIX]{x1D6FC}_{0}=0.01$
.)

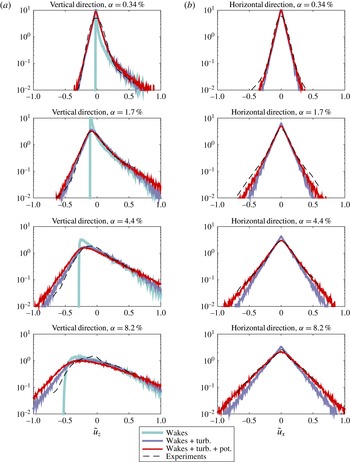
Figure 1 presents a typical example of p.d.f.s of liquid velocity fluctuations measured in a homogeneous swarm of air bubbles rising in water at a Reynolds number of several hundred by Riboux et al. (Reference Riboux, Risso and Legendre2010). These results correspond to case C defined in table 1, with a bubble equivalent diameter
 $d=2.5$
mm and a bubble rise velocity
 $V=305~\text{mm}~\text{s}^{-1}$
(
 $Re=Vd/\unicode[STIX]{x1D708}=760$
). Various gas volume fractions
 $\unicode[STIX]{x1D6FC}$
from 0.34 % to 8.2 % are considered and the velocity fluctuations are normalized by
 $V(\unicode[STIX]{x1D6FC}/\unicode[STIX]{x1D6FC}_{0})^{0.4}$
, which was found to provide the best scaling. Note that a semilog scale is used to highlight the main features. Figure 1(b) shows the horizontal fluctuations. The normalized p.d.f.s of all gas volume fractions are similar. They are maximum at the origin and symmetric. They show a first exponential decay followed by a less steep second one. At the lower considered gas volume fraction (
 $\unicode[STIX]{x1D6FC}=0.34$
%), the maximum is more rounded and the second exponential decay is reached for larger fluctuations. For
 $\unicode[STIX]{x1D6FC}\geqslant 0.54$
%, all p.d.f.s are in rather good agreement, with perhaps a tendency to become sharper at the origin when
 $\unicode[STIX]{x1D6FC}$
is increased. Figure 1(a) shows the vertical fluctuations. The vertical p.d.f.s are clearly asymmetric, with large positive (upward) fluctuations, which are commonly attributed to the bubble wakes. On the one hand, negative (downward) fluctuations again follow an exponential decay and match for all gas volume fractions. On the other hand, the normalization does not allow the collapse of large positive fluctuations, which follows a slow exponential decay that starts from increasingly low fluctuations as
 $\unicode[STIX]{x1D6FC}$
is increased.
The p.d.f.s of liquid velocity fluctuations induced by bubbles rising at high Reynolds number thus possess three general properties: (i) exponential decay, (ii) partial self-similarity when varying the gas volume fraction and (ii) strong asymmetry between upward and downward fluctuations. It is interesting to know whether these characteristics still hold at lower Reynolds numbers. Velocity fluctuations of particle velocity in a sheared suspension have been computed numerically in the limit of vanishing Reynolds number (Drazer et al.
Reference Drazer, Koplik, Khusid and Acrivos2002; Abbas et al.
Reference Abbas, Climent, Simonin and Maxey2006). (No significant drift is expected in this case and particle velocity fluctuations are expected to be similar to fluid velocity fluctuations.) In this situation where neither wakes nor turbulence can develop, the p.d.f.s of all components of the particle velocity fluctuations are symmetric. For particle volume fractions from 1 % to 10 %, p.d.f.s normalized by their standard deviation are remarkably similar to those presented in figure 1(b), with exponential tails and rather good matching of the various volume fractions. At large volume fraction (35 %), the p.d.f.s lose their exponential behaviour and take a Gaussian shape. Liquid velocity fluctuations induced by a homogenous swarm of rising bubbles at moderate Reynolds number (
 $Re\approx 10$
) have been investigated experimentally by Cartellier, Andreotti & Sechet (Reference Cartellier, Andreotti and Sechet2009) for gas volume fraction from 0.2 % to 10 %. In this situation, a wake is present behind each bubble but turbulence does not develop. The p.d.f.s of the vertical fluctuations possess the three aforementioned properties and resemble those of figure 1(a). The fact that some important statistical characteristics of the fluctuations induced by rising bubbles are observed for such a large range of flow regime raises questions about the nature of these fluctuations. Even if this work focuses on the large-Reynolds-number case, it will also shed some light on the underlying mechanisms at lower
 $Re$
.
Parameters of the three considered cases. The parameters
 $d$
,
 $V$
,
 $Re=Vd/\unicode[STIX]{x1D708}$
and
 $\unicode[STIX]{x1D709}$
are the bubble diameter, the average rise velocity of an isolated bubble, the Reynolds number and the aspect ratio corresponding to the experiments of Riboux et al. (Reference Riboux, Risso and Legendre2010). In addition,
 $\tilde{L}=L/d$
and
 $\tilde{w}=w/d$
are the normalized wake and width parameters of the wake model; and
 $\tilde{v}_{t}=v_{t}/V$
is the normalized velocity scale of the turbulence model.

A first elementary approach to model the fluctuations is to consider the sum of the velocity disturbances generated by individual bubbles. By considering the potential flow generated by a spherical bubble rising at constant velocity and assuming random bubble positions independent of each other, Biesheuvel & Wijngaarden (Reference Biesheuvel and Van Wijngaarden1984) calculated the variances of the three components of the velocity fluctuations generated in the liquid phase. Because high-Reynolds-number rising bubbles take an oblate shape and because of interface contamination, strong wakes develop behind them (Ellingsen & Risso Reference Ellingsen and Risso2001), which account for a major part of the liquid fluctuations. Parthasarathy & Faeth (Reference Parthasarathy and Faeth1990) investigated a very dilute homogeneous swarm of solid spheres falling in water (solid volume fraction less than 0.01 %) and modelled the liquid fluctuations by considering both the potential flow and the wake generated by each individual sphere. Their model considered the turbulent wake of an isolated sphere and accounted for both the mean flow and the turbulent fluctuations. Unfortunately, the sum of randomly distributed wakes diverges as the size of the swarm increases. They dealt with this problem by arbitrarily stopping the wake at a length where it was expected to lose its coherence in the turbulent field. By this method, they found the measured variances and concluded that the wake contribution represented 90 % of the energy of the fluctuations. However, it is worth mentioning that both their prediction and their measurements led to Gaussian p.d.f.s. For large-Reynolds-number rising bubbles, Lance & Bataille (Reference Lance and Bataille1991) also interpreted the bubble-induced fluctuations as the sum of the contribution of the potential flows generated around the bubbles and that of the turbulent fluctuations generated within the wakes. However, they limited their discussion to the variances of the fluctuations and did not consider p.d.f.s.
Risso et al. (Reference Risso, Roig, Amoura, Riboux and Billet2008) proposed to make a clear distinction between two kinds of fluctuations of different nature. The first corresponded to the strong spatially localized inhomogeneities generated in the vicinity of each bubble, and was called spatial fluctuations. The second corresponded to the turbulent fluctuations resulting from the flow instability, and was called time fluctuations. The decomposition of the bubble-induced agitation into these two contributions is straightforward provided the bubbles have no motion relative to each other, which allows one to consider the flow in the frame where the bubbles are fixed. This has been achieved numerically by means of large-eddy simulations (Riboux et al. Reference Riboux, Legendre and Risso2013) of the flow through a random array of immobile bubbles and experimentally from the investigation of the flow through a random array of fixed spheres (Amoura Reference Amoura2008; Risso et al. Reference Risso, Roig, Amoura, Riboux and Billet2008). It turned out that both contributions had exponential p.d.f.s and were weakly dependent on the gas volume fraction when normalized by their variances. However, spatial fluctuations are anisotropic and strongly asymmetric in the vertical direction, whereas time fluctuations are isotropic and symmetric in both the horizontal and vertical directions. Moreover, numerical simulations have shown that, contrary to spatial fluctuations, time fluctuations are not localized in the vicinity of the bubbles and result from a collective instability of the flow through a random array of obstacles.
The present work aims to understand the nature of the liquid-induced agitation from the interpretation of their p.d.f.s. In particular, we seek to find the reasons for the exponential decay, the partial self-similarity and the different levels of anisotropy that are observed when the gas volume fraction is changed. Also, we would like to find a method to distinguish between the different contributions to the fluctuations in the case of real bubble swarms where bubbles are rising in the laboratory frame and moving relative to each other. For that purpose, we will first examine the p.d.f.s resulting from each possible mechanism and then try to combine them in order to describe the experimental results. Section 2 focuses on the agitation resulting from local disturbances generated by the bubbles, considering first the wake and then potential flow. Section 3 considers the fluctuations resulting from the flow instability. In § 4, the different contributions are added and the results of the model are discussed by comparison with experiments. Conclusions and prospects for future works are presented in § 5.
2 Agitation resulting from the addition of individual disturbances
2.1 General formulation
In this section, we consider that the liquid fluctuations
 $\boldsymbol{u}$
generated in a bubble swarm are described by the sum of the velocity disturbances
 $\boldsymbol{v}$
generated by each individual bubble. A bubble located at location
 $x_{i}$
and rising at velocity
 $V$
induces a velocity field
 $V\tilde{\boldsymbol{v}}(\boldsymbol{x}_{\boldsymbol{i}})$
at the origin.
We assume that the swarm is dilute enough to neglect any interactions between the bubbles. Consequently, (i) the flow disturbance
 $\tilde{v}$
is a given function of only the bubble location, and (ii) the bubble positions
 $\boldsymbol{x}_{\boldsymbol{i}}$
are random variables that are statistically independent from each other and uniformly distributed in space. For
 $N$
bubbles in a volume
 $\unicode[STIX]{x1D717}$
, the total velocity fluctuation
 $$\begin{eqnarray}\boldsymbol{u}=V\mathop{\sum }_{i=1}^{N}\tilde{\boldsymbol{v}}(\boldsymbol{x}_{\boldsymbol{ i}})\end{eqnarray}$$
is a random variable. In the limit of
 $\unicode[STIX]{x1D717}$
tending towards infinity, the statistical distribution of
 $\boldsymbol{u}$
is fully characterized by the knowledge of its cumulants, which can be obtained from the summation over space of the flow disturbance generated by a single bubble (Rice Reference Rice1944),
 $$\begin{eqnarray}k_{n}={\tilde{N}}V^{n}\int _{x\in \unicode[STIX]{x1D717}}\tilde{\boldsymbol{v}}^{n}(\boldsymbol{x})\,\text{d}\unicode[STIX]{x1D717},\end{eqnarray}$$
where
 ${\tilde{N}}=N/\unicode[STIX]{x1D717}$
is the bubble number density. This result is valid provided the velocity disturbance
 $\tilde{\boldsymbol{v}}$
generated by each bubble decays fast enough with the distance to the bubble such that the integrals in (2.2) converge. Physically, that means that the kinetic energy of the steady flow induced by a single moving bubble has to be finite.
The moments
 $m_{n}$
of the statistical distribution are related to the cumulants by the classic recurrence relation,
 $$\begin{eqnarray}k_{n}=m_{n}-\mathop{\sum }_{i=1}^{n-1}C_{i-1}^{n-1}k_{i}m_{n-i},\end{eqnarray}$$
where
 $C_{i}^{\,j}$
denotes the binomial coefficients. This relation is particularly simple for the moments of the first three orders: the mean is equal to the first cumulant (
 $m_{1}=k_{1}$
), the variance to the second cumulant (
 $\unicode[STIX]{x1D70E}^{2}=m_{2}-m_{1}^{2}=k_{2}$
), and the third-order centred moment to the third cumulant (
 $\unicode[STIX]{x1D707}_{3}=m_{3}-3m_{1}m_{2}+2m_{1}^{3}=k_{3}$
). Even if the cumulants (or the moments) are sufficient to fully define the statistical distribution, we are presently interested by obtaining the p.d.f. This is particularly simple in the limiting case where
 ${\tilde{N}}$
tends towards infinity. Equation (2.2) shows that all
 $k_{n}$
are proportional to
 ${\tilde{N}}$
and hence
 $k_{n}/k_{2}^{n/2}$
tends towards zero for all
 $n$
greater than 2. Consequently, only the first two cumulants of the limit distribution are non-zero, which means that it is Gaussian. The fact that the statistics tend towards a Gaussian distribution as the number density is increased can be seen as a direct consequence of the central limit theorem.
In reality, the finite size of the bubbles limits the value of
 ${\tilde{N}}$
because bubbles cannot penetrate into each other. Gaussian distributions are therefore not expected to be observed. To be approximated by a Gaussian distribution, the velocity at a given point must result from the addition of a large enough number of random bubble disturbances. A good parameter to quantify the convergence towards a Gaussian distribution is hence the fraction of the total volume that is disturbed by the bubbles, which is proportional to both the number density
 ${\tilde{N}}$
and the volume of the region perturbed by a single bubble. At low Reynolds number, the slow decay of the velocity disturbance allows long-range interactions. That is probably the reason why a Gaussian distribution has been predicted for particle volume fractions of approximately 35 %. Except that the maximum of the p.d.f.s becomes slightly more rounded, the convergence towards a Gaussian distribution is not observed in figure 1 for a swarm of large-Reynolds-number bubbles at volume fractions up to 8 %.
We therefore need to determine the shape of the p.d.f.s for finite values of
 ${\tilde{N}}$
. Unfortunately, the p.d.f. cannot be easily obtained analytically even when the expressions of all the cumulants are known. In particular, it is worth recalling that a truncated sequence of cumulants does not represent a valid probability law and therefore cannot be used as a relevant approximation (except for either the uniform or the Gaussian distribution, for which only the first two cumulants are non-zero). In the following, we will determine the p.d.f.s numerically by adding disturbances that are randomly distributed over space.
2.2 Contribution of the average wakes
Let us consider an isolated axisymmetric body rising at constant velocity. In the laminar regime, the flow profile in the wake is Gaussian in the radial direction
 $r$
and decreases as the reciprocal of the distance
 $z$
to the body:
 $\tilde{\boldsymbol{v}_{\boldsymbol{z}}}(\boldsymbol{r},\boldsymbol{z})\propto (L/z)\exp (-r^{2}/w^{2})$
, where
 $L$
and
 $w$
are two length scales that depend on the body size, drag coefficient and Reynolds number (Batchelor Reference Batchelor1967). For a turbulent wake, the decrease is even slower (Tennekes & Lumley Reference Tennekes and Lumley1972):
 $\tilde{v_{z}}(r,z)\propto (L/z)^{2/3}\exp (-r^{2}/w^{2})$
. As remarked by Parthasarathy & Faeth (Reference Parthasarathy and Faeth1990), if we sum the wakes of randomly distributed bodies, integral (2.2) diverges for
 $n=2$
, leading to an infinite velocity variance in both the laminar and turbulent cases. However, it has been observed (Risso & Ellingsen Reference Risso and Ellingsen2002) that the wake of a high-Reynolds-number bubble belonging to a swarm of bubbles vanishes at a distance of a few bubble diameters provided the volume fraction is at least a few tenths of one per cent. The wake of an isolated bubble is therefore not relevant for bubbly flows. Indeed, at large Reynolds number, the wake behind a body immersed in a swarm of similar bodies turns out to decrease exponentially with the distance (Risso et al.
Reference Risso, Roig, Amoura, Riboux and Billet2008):
 $\tilde{v_{z}}(z)\propto \exp (-z/L)$
.
The mechanism responsible for this strong wake attenuation is not an enhanced diffusion induced by the turbulent fluctuations that develop within the swarm. First, it has been observed that the wakes do not spread significantly before they vanish (Amoura Reference Amoura2008). Second, the action of an external turbulence leads to a power-law decay (Wu & Faeth Reference Wu and Faeth1994, Reference Wu and Faeth1995; Bagchi & Balachandar Reference Bagchi and Balachandar2004; Legendre, Merle & Magnaudet Reference Legendre, Merle and Magnaudet2006; Risso et al. Reference Risso, Roig, Amoura, Riboux and Billet2008), which is not able to cause the strong exponential attenuation observed in bubbly flows. The wake cancellation is caused by interactions between the wakes and can probably be explained by the mechanisms proposed by Hunt & Eames (Reference Hunt and Eames2002).
For a homogeneous swarm of rising bubbles,
 $L$
has been found to scale as the ratio between the bubble diameter and its drag coefficient, and to be independent of the gas volume fraction in the range
 ${\sim}$
0.5–10 % (Risso et al.
Reference Risso, Roig, Amoura, Riboux and Billet2008). It is therefore reasonable to model the velocity disturbance generated by each individual bubble located at the point of coordinates
 $(x,y,z)$
by
 $$\begin{eqnarray}\left.\begin{array}{@{}l@{}}\tilde{v}_{x}(x,y,z)=0,\\ \tilde{v}_{y}(x,y,z)=0,\\ \tilde{v}_{z}(x,y,z)=0\quad \text{for }z<0,\\ \tilde{v}_{z}(x,y,z)=\exp (-z/L)\exp (-(x^{2}+y^{2})/w^{2})\quad \text{for }z\geqslant 0,\end{array}\right\}\end{eqnarray}$$
where the characteristic length
 $L$
and width
 $w$
of the wake are independent of
 $\unicode[STIX]{x1D6FC}$
. It is important to stress that expression (2.4) represents the wake of a bubble within the bubble swarm and accounts for the attenuation due to interactions with the other wakes.
Substituting this expression in (2.3) yields the expression of the cumulants of the fluctuations generated by summing randomly distributed wakes,
 $$\begin{eqnarray}k_{n}={\tilde{N}}\frac{\unicode[STIX]{x03C0}Lw^{2}}{n^{2}}V^{n}.\end{eqnarray}$$
The corresponding p.d.f.s can be estimated analytically in the limits of
 ${\tilde{N}}$
tending towards either zero or infinity. In the limit of vanishing bubble number density, the probability that two wakes intersect is very low. Consequently, we can assume that the liquid velocity at a given point is due only to the wake of a single bubble. Under this assumption, the analytical expression of the probability density
 $f_{z}$
of the normalized vertical velocity fluctuations,
 $\tilde{u_{z}}=u_{z}/V$
, is found to be
 $$\begin{eqnarray}f_{z}(\tilde{u_{z}})=\unicode[STIX]{x1D705}\,\frac{1}{\tilde{u_{z}}+M}\log \left(\frac{1}{\tilde{u_{z}}+M}\right)\quad \text{for }\unicode[STIX]{x1D716}-M\leqslant \tilde{u_{z}}\leqslant 1-M,\end{eqnarray}$$
where
 $\unicode[STIX]{x1D705}=6\unicode[STIX]{x1D6FC}\tilde{w}^{2}\tilde{L}$
,
 $\unicode[STIX]{x1D716}=\exp (-\sqrt{2/\unicode[STIX]{x1D705}})$
,
 $M=\unicode[STIX]{x1D705}(1-\unicode[STIX]{x1D716}-\unicode[STIX]{x1D716}\sqrt{2/\unicode[STIX]{x1D705}})$
, and
 $\tilde{L}=L/d$
and
 $\tilde{w}=w/d$
are the normalized length and width of the wake (see appendix A for a detailed derivation).
In the limit of large bubble number density, the p.d.f. tends towards a Gaussian function,
 $$\begin{eqnarray}f_{z}(\tilde{u} _{z})=\frac{1}{\tilde{\unicode[STIX]{x1D70E}_{w}}\sqrt{2\unicode[STIX]{x03C0}}}\exp \left(-\frac{\tilde{u} _{z}^{2}}{2\tilde{\unicode[STIX]{x1D70E}_{w}}^{2}}\right),\end{eqnarray}$$
with a variance
 $\unicode[STIX]{x1D70E}_{w}^{2}$
obtained by taking
 $n=2$
and
 $\unicode[STIX]{x1D6FC}=\unicode[STIX]{x03C0}d^{3}{\tilde{N}}/6$
in (2.5),
 $$\begin{eqnarray}\tilde{\unicode[STIX]{x1D70E}}_{w}^{2}=\left(\frac{\unicode[STIX]{x1D70E}_{w}}{V}\right)^{2}=\frac{3}{2}\unicode[STIX]{x1D6FC}\,\tilde{w}^{2}\tilde{L}.\end{eqnarray}$$
For intermediate gas volume fractions, the p.d.f. has been obtained numerically by the following method. A cubic domain
 $\unicode[STIX]{x1D717}_{T}$
of size
 $L=40d$
is considered. The coordinates
 $(x_{i},y_{i},z_{i})$
of
 $N=6\unicode[STIX]{x1D6FC}L^{3}/\unicode[STIX]{x03C0}d^{3}$
bubbles are chosen randomly and independently of each other such that their distribution be uniform over
 $\unicode[STIX]{x1D717}_{T}$
. The velocity induced by each bubble, given by (2.4), is computed at the middle of the domain. (Note that, because the wakes only develop behind the bubbles, only the bubbles located in the upper half of the domain contribute to the fluctuation.) A velocity sample is obtained by summing the contributions of the
 $N$
bubbles. The operation is repeated a large number,
 $N_{s}$
, of times in order to build a statistically representative ensemble of samples. The average velocity is then subtracted from each sample to get the fluctuating velocity. Several values of
 $N_{s}$
have been tested. For all cases considered in this work (figure 2 and following), increasing
 $N_{s}$
beyond
 $10^{5}$
no longer changes the global shape of the p.d.f.s but only reduces the amplitude of the high-frequency scattering around this global shape, which is a residue of an imperfect statistical convergence. Finally, we have chosen
 $N_{s}=5\times 10^{5}$
, which was found to be a good compromise between computation time and the smoothness of the numerical curves.
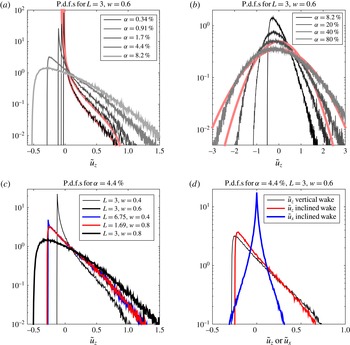
The p.d.f.s of liquid velocity fluctuations induced by average bubble wakes described by (2.4). (a,b) Results at various gas volume fractions for a bubble of 2.5 mm (case C in table 1). The two light (red) curves in (a) correspond to the analytical solution for low bubble number density (2.6) for
 $\unicode[STIX]{x1D6FC}=0.34\,\%$
and
 $\unicode[STIX]{x1D6FC}=0.91\,\%$
. The two light (red) curves in (b) correspond to the Gaussian solution valid at large bubble number density (2.7) and (2.8) for
 $\unicode[STIX]{x1D6FC}=40\,\%$
and
 $\unicode[STIX]{x1D6FC}=80\,\%$
. (c) Results for various wake parameters at a single gas volume fraction. (d) Effect of bubble path inclination.

Typical p.d.f.s of statistical samples generated by this method are shown in figure 2. In these examples, the model parameters,
 $\tilde{L}$
and
 $\tilde{w}$
, have been chosen to correspond to a bubble of
 $d=2.5$
mm rising in water (case C in table 1). The discussion of these values will be presented in § 4 when comparing the model with experiments. Figure 2(a,b) shows the p.d.f.s for various gas volume fractions from 0.34 % to 80 % for a fixed pair of parameters
 $\tilde{L}=3$
and
 $\tilde{w}=0.6$
. Considering values of
 $\unicode[STIX]{x1D6FC}$
lower than a few tenths of one per cent would not be relevant with the assumption that the wake dimensions are independent of
 $\unicode[STIX]{x1D6FC}$
. Considering values of
 $\unicode[STIX]{x1D6FC}$
much greater than 10 % is probably not physically relevant because strong hydrodynamic interactions between bubbles should take place. We have however plotted p.d.f.s up to unreasonably large values of
 $\unicode[STIX]{x1D6FC}$
to examine the convergence towards a Gaussian function.
As expected, the p.d.f.s are well described by the low-gas-volume-fraction approximation as long as the probability of occurrence of fluctuations of order one or greater remains negligible. In the present case, the agreement of the computed p.d.f.s with (2.6) is excellent at
 $\unicode[STIX]{x1D6FC}=0.34$
% and good until
 $\tilde{u} _{z}=0.5$
at
 $\unicode[STIX]{x1D6FC}=0.91$
%. Conversely, the convergence towards the other asymptotic solution (2.7) and (2.8) for increasing
 $\unicode[STIX]{x1D6FC}$
is slow. The Gaussian function only starts to be a relevant approximation for a gas volume fraction as large as 80 %, and has therefore no chance of being observed in an experiment. At intermediate gas volume fractions (
 $1\,\%\leqslant \unicode[STIX]{x1D6FC}\leqslant 40\,\%$
), the p.d.f.s are strongly asymmetric. When
 $\unicode[STIX]{x1D6FC}$
is increased, negative fluctuations, which are initially totally absent, developed very slowly as the p.d.f. maximum gradually becomes more and more rounded. Conversely, positive fluctuations show a long exponential tail, which is still present at
 $\unicode[STIX]{x1D6FC}=40$
%.
We discuss now how the p.d.f. depends on the wake width and length. Figure 2(c) shows some results obtained for various values of
 $\tilde{w}$
and
 $\tilde{L}$
. We observe that increasing
 $\tilde{w}$
at constant
 $\tilde{L}$
has an effect similar to increasing
 $\unicode[STIX]{x1D6FC}$
. Increasing
 $\tilde{L}$
at constant
 $\tilde{w}$
(not shown here) is found to have the same effect. Moreover, it turns out that a similar p.d.f. is obtained for various values of
 $\tilde{L}$
and
 $\tilde{w}$
provided the wake volume,
 $\tilde{L}\tilde{w}^{2}$
, is kept constant. In fact, the p.d.f. depends on the fraction of the total volume that is occupied by the wake, which is proportional to
 $\unicode[STIX]{x1D6FC}\tilde{L}\tilde{w}^{2}$
.
Equation (2.4) only accounts for the longitudinal velocity. It is reasonable to neglect the transverse velocity because a wake is a quasi-parallel flow. However, because of wake-induced oscillations (Ern et al.
Reference Ern, Risso, Fabre and Magnaudet2012), large-Reynolds-number bubbles do not rise on rectilinear paths. In order to assess a possible effect of bubble path inclinations on the p.d.f.s, additional computations have been carried out by considering that the velocity disturbance generated by each bubble is due to a wake that is inclined relative to the vertical direction. The inclination angles have been randomly chosen and uniformly distributed in the interval
 $[0,\unicode[STIX]{x1D703}_{max}]$
. The maximum inclination angle measured by Riboux et al. (Reference Riboux, Risso and Legendre2010) was
 $28^{\circ }$
. Figure 2(d) shows an example of p.d.f.s of the vertical and horizontal velocity fluctuations obtained for
 $\unicode[STIX]{x1D703}_{max}=30^{\circ }$
. The vertical p.d.f. is almost indistinguishable from the reference case without inclination. The p.d.f. of the horizontal fluctuations is a narrow peak centred around zero and involves fluctuations that are negligible compared to those observed in experiments. We can therefore conclude that wake inclinations have no significant effect on the p.d.f.s and we will no longer consider them.
Let us sum up about the p.d.f.s of the fluctuations resulting from the summation of randomly distributed wakes. For a given bubble rise velocity and a gas volume fraction, the model essentially depends on a single parameter that characterizes the wake volume:
 $\tilde{L}\tilde{w}^{2}$
. In the relevant range of gas volume fractions in which the model is expected to be relevant (
 $0.3\,\%\leqslant \unicode[STIX]{x1D6FC}\leqslant 20\,\%$
), an exponential tail is observed for upward fluctuations, while neither significant horizontal fluctuations nor vertical downward fluctuations are generated.
2.3 Contribution of the potential flow
In the flow regime considered here, the shape of a rising bubble can be approximated as an oblate ellipsoid of revolution. In the close region located above and next to the bubble, i.e. out of the wake, the velocity field is well described by the potential flow around a single rising bubble (Ellingsen & Risso Reference Ellingsen and Risso2001; Risso & Ellingsen Reference Risso and Ellingsen2002). Under the potential flow approximation, the flow
 $\tilde{\boldsymbol{v}}(\boldsymbol{x})$
around an oblate ellipsoid of revolution in translation in the direction of its axis is known analytically (Lamb Reference Lamb1932, § 108) and depends only on the aspect ratio
 $\unicode[STIX]{x1D709}$
between the major and the minor axes. In this section, we consider the liquid velocity fluctuations generated by the summation of such potential disturbances.
The statistical cumulants are still given by (2.3). In the simplest case of a spherical bubble (
 $\unicode[STIX]{x1D709}=1$
), the variances of the three components of the velocity fluctuations have been determined by Biesheuvel & Wijngaarden (Reference Biesheuvel and Van Wijngaarden1984) (see also Lance & Bataille Reference Lance and Bataille1991) as
 $$\begin{eqnarray}\left.\begin{array}{@{}l@{}}\tilde{\unicode[STIX]{x1D70E}}_{pot\,x}^{2}={\textstyle \frac{3}{20}}\,\unicode[STIX]{x1D6FC},\\ \tilde{\unicode[STIX]{x1D70E}}_{pot\,y}^{2}={\textstyle \frac{3}{20}}\,\unicode[STIX]{x1D6FC},\\ \tilde{\unicode[STIX]{x1D70E}}_{pot\,z}^{2}={\textstyle \frac{1}{5}}\,\unicode[STIX]{x1D6FC}.\end{array}\right\}\end{eqnarray}$$
Because of the very complex expression of
 $\tilde{\boldsymbol{v}}(\boldsymbol{x})$
, obtaining the analytical expression of the statistical moments for any
 $\unicode[STIX]{x1D709}$
is of no use. It is however worth mentioning that the variance of the fluctuations is in any case a linear function of
 $\unicode[STIX]{x1D6FC}$
.
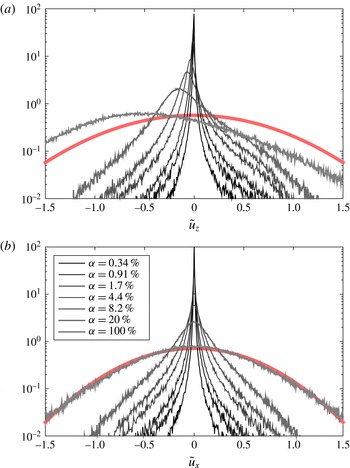
Statistically representative ensembles of samples of fluctuations induced by potential disturbances are obtained numerically by a method similar to that described previously for the wake disturbances. Figure 3 presents p.d.f.s that have been obtained for
 $\unicode[STIX]{x1D709}=2$
(case C, table 1) and various gas volume fractions. Figure 3(b) shows the p.d.f.s of the horizontal velocity fluctuations. As expected, they are symmetric. At low
 $\unicode[STIX]{x1D6FC}$
we observe a peak-shaped curve that is characteristic of fluctuations that each result from a single disturbance. Increasing
 $\unicode[STIX]{x1D6FC}$
, the maximum becomes rounded and exponential tails develop. Because the potential flow disturbance is closely localized near the bubble, the convergence towards a Gaussian function is very slow and only achieved for an unreasonable gas volume fraction of 100 %. Figure 3(a) shows the p.d.f.s of the vertical velocity fluctuations. Even if the streamlines of the potential flow are symmetric relative to the bubble mid-plane, the vertical velocity is not. The convergence towards a Gaussian function is even slower than for the horizontal fluctuations and the asymmetry needs a very high bubble number density to fade away. For intermediate gas volume fractions, exponential tails are still present.
The p.d.f.s of liquid velocity fluctuations induced by potential flow disturbances at various gas volume fractions for a bubble aspect ratio
 $\unicode[STIX]{x1D709}=2$
(case C in table 1). The light (red) curve shows the Gaussian solution valid at large bubble number density for the case
 $\unicode[STIX]{x1D6FC}=100\,\%$
.

The presence of exponential tails in the p.d.f.s of velocity fluctuations resulting from the summation of randomly distributed disturbances seems to be a general feature, independent of the nature of the disturbances. It was previously found in the Stokes regime (Drazer et al. Reference Drazer, Koplik, Khusid and Acrivos2002; Abbas et al. Reference Abbas, Climent, Simonin and Maxey2006). It is found here for both wake and potential disturbances. It is observed for intermediate number densities between the very dilute regime, in which each fluctuation results from a single disturbance, and the very concentrated regime, in which each fluctuation results from a very large number of individual disturbances and where the p.d.f. is Gaussian. The corresponding range of gas volume fractions depends on the spatial extent of the disturbance around each bubble, which is larger for a Stokes disturbance than for a wake-induced disturbance, which is itself larger than for a potential disturbance. It also depends on the asymmetry of the disturbance, which delays the convergence towards the asymptotic solution at large concentration. Both wake and potential disturbances do not converge to a Gaussian distribution for volume fractions that can be achieved when the finite size of the bubble is taken into account. At large Reynolds number, the summation of individual disturbances thus generates exponential tails in the range of gas volume fractions where they are observed in experiments, from a few tenths of one per cent to a few tens of per cent.
3 Turbulent agitation resulting from a flow instability
The average flow disturbance generated in the vicinity of a bubble is not the only source of velocity fluctuations. Provided the Reynolds number is large enough, the whole flow within the bubble swarm becomes unstable and turbulent fluctuations develop. From large-scale simulations, Riboux et al. (Reference Riboux, Legendre and Risso2013) showed that wake interactions gave birth to a collective instability, which develops as the bubble Reynolds number or the gas volume fraction is increased. In these simulations, as well as in experiments of the flow through a random array of spheres (Amoura Reference Amoura2008; Risso et al. Reference Risso, Roig, Amoura, Riboux and Billet2008), the fluctuations resulting from the flow instability can be separated from those resulting from the superposition of velocity disturbances induced by individual bubbles. It turns out that they are not localized within the vicinity of the bubbles or their wakes, but are rather homogeneously distributed over the liquid phase. Moreover, they appear to be almost isotropic and the p.d.f.s of both the horizontal and vertical fluctuations are symmetric and show exponential tails.
We thus propose to model the p.d.f.s of the three velocity components by the same symmetric exponential function,
 $$\begin{eqnarray}\left.\begin{array}{@{}l@{}}f_{t\,x}(\tilde{u} _{x})={\displaystyle \frac{\sqrt{2}}{2\tilde{\unicode[STIX]{x1D70E}}_{t}}}\exp \left(-{\displaystyle \frac{\sqrt{2}|\tilde{u} _{x}|}{\tilde{\unicode[STIX]{x1D70E}}_{t}}}\right),\\ f_{t\,y}(\tilde{u} _{y})={\displaystyle \frac{\sqrt{2}}{2\tilde{\unicode[STIX]{x1D70E}}_{t}}}\exp \left(-{\displaystyle \frac{\sqrt{2}|\tilde{u} _{y}|}{\tilde{\unicode[STIX]{x1D70E}}_{t}}}\right),\\ f_{t\,z}(\tilde{u} _{z})={\displaystyle \frac{\sqrt{2}}{2\tilde{\unicode[STIX]{x1D70E}}_{t}}}\exp \left(-{\displaystyle \frac{\sqrt{2}|\tilde{u} _{z}|}{\tilde{\unicode[STIX]{x1D70E}}_{t}}}\right),\end{array}\right\}\end{eqnarray}$$
where
 ${\tilde{\unicode[STIX]{x1D70E}}_{t}}^{2}$
is the variance of each component and
 $3{\tilde{\unicode[STIX]{x1D70E}}_{t}}^{2}$
is the variance of the velocity vector norm. Since these fluctuations result from nonlinear interactions between the wakes, they are not expected to vary linearly with the gas volume fraction. Since we will compare the present model with the experimental results of Riboux et al. (Reference Riboux, Risso and Legendre2010), we will retain the scaling proposed in this paper,
 $$\begin{eqnarray}\tilde{\unicode[STIX]{x1D70E}}_{t}=\left(\frac{\unicode[STIX]{x1D6FC}}{0.01}\right)^{0.4}\tilde{v}_{t},\end{eqnarray}$$
where
 $\tilde{v}_{t}$
is the standard deviation of the fluctuation at
 $\unicode[STIX]{x1D6FC}=1$
%.
In the next section, we will add the fluctuations resulting from the flow instability to those resulting from individual disturbances. We therefore need to generate sets of realizations of a random variable
 $\tilde{u} _{i}$
that has an exponential probability density. For this purpose, it is convenient to introduce an auxiliary random variable
 $\unicode[STIX]{x1D701}_{i}$
such that
 $$\begin{eqnarray}\tilde{u} _{i}=\text{sgn}(1-2\unicode[STIX]{x1D701}_{i})\frac{\tilde{\unicode[STIX]{x1D70E}}_{t}}{\sqrt{2}}\log (1-|1-2\unicode[STIX]{x1D701}_{i}|).\end{eqnarray}$$
If
 $\unicode[STIX]{x1D701}_{i}$
is uniformly distributed within
 $[0,1]$
, then
 $\tilde{u} _{i}$
is distributed within
 $]\!-\infty ,+\infty \ $f_{t\,i}(\tilde{u} _{i})$
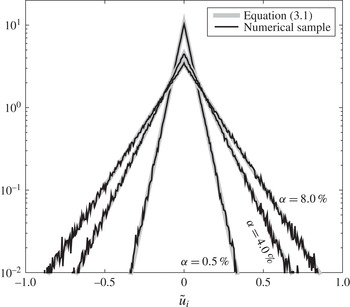
defined by (3.1) (see justification in appendix B). Figure 4 shows p.d.f.s of velocity samples generated by randomly choosing
 $5\times 10^{5}$
values of
 $\unicode[STIX]{x1D701}_{i}$
and computing the corresponding values of
 $\tilde{u} _{i}$
from (3.3). Comparison with the analytical expression of the p.d.f. shows that a good statistical convergence is achieved. In the following, the three components of the velocity fluctuations,
 $\tilde{u} _{x}$
,
 $\tilde{u} _{y}$
and
 $\tilde{u} _{z}$
, are considered statistically independent and generated from three independent sets
 $\unicode[STIX]{x1D701}_{x}$
,
 $\unicode[STIX]{x1D701}_{y}$
and
 $\unicode[STIX]{x1D701}_{z}$
.

4 Complete model and comparison with experiments
We now model the fluctuations by taking into account all the kinds of velocity fluctuations: (i) those induced by the flow disturbances in the vicinity of each bubble and (ii) those resulting from the turbulent agitation.
The procedure to compute a sample of velocity fluctuation within the bubble swarm is as follows. The first step is similar to the computation of either the wake-induced disturbance (§ 2.2) or the potential one (§ 2.3), except that both of them are now considered simultaneously.
 $N$
bubbles are randomly distributed over the computational domain. The contribution of each bubble in the middle of the domain is computed as the sum of the wake disturbance (2.4) and that of the potential flow. This is questionable in the region behind the bubble where the potential contribution should account for the presence of the wake. However, it is a reasonable approximation since the wake is largely dominant in this region. Then, the disturbances induced by all the bubbles are added to obtain the fluctuation due to the individual contributions of the bubbles,
 $u_{ind}$
. The second step consists in randomly choosing a value of a turbulent fluctuation,
 $u_{turb}$
, by the method described in § 3. A sample of the total velocity fluctuations in the bubble swarm is simply obtained as the sum of the two kinds of fluctuations:
 $u=u_{ind}+u_{turb}$
. Finally, an ensemble of
 $N_{s}=5\times 10^{5}$
velocity samples is generated from which the p.d.f. is determined.
The present model assumes that the two contributions,
 $u_{ind}$
and
 $u_{turb}$
, at a given location and a given instant are statistically independent. This assumption is supported by the fact that the temporal fluctuations generated in the flow through a random array of fixed spheres or bubbles have been found to be almost isotropic and homogeneously distributed over space (Amoura Reference Amoura2008; Riboux et al.
Reference Riboux, Legendre and Risso2013). Now, considering the flow around each bubble, it has been found to be similar to the flow around an isolated bubble except that the wake is attenuated by the interactions with the other wakes (Risso & Ellingsen Reference Risso and Ellingsen2002; Risso et al.
Reference Risso, Roig, Amoura, Riboux and Billet2008). It is therefore reasonable to assume that it is not significantly influenced by the instantaneous local turbulent fluctuation. It is important to stress that this assumption does not imply that the turbulent fluctuations and the disturbances in the vicinity of the bubbles are not coupled. It is in contradiction with a mechanism of local production–dissipation balance within the bubble wakes. However, it is compatible with the production of turbulence by a collective instability of the flow throughout a randomly distributed population of bubbles.
The model involves parameters that need to be chosen. The gas volume fraction
 $\unicode[STIX]{x1D6FC}$
, which is involved in all contributions, is a known parameter. The potential contribution depends on the bubble aspect ratio
 $\unicode[STIX]{x1D709}$
, which is taken equal to the value measured by Riboux et al. (Reference Riboux, Risso and Legendre2010) for an isolated rising bubble. The wake model involves two parameters, the normalized width
 $\tilde{w}$
and length
 $\tilde{L}$
of the wake. In the experiments of Riboux et al. (Reference Riboux, Risso and Legendre2010),
 $L$
was found to be equal to the Eulerian integral length scale of the velocity fluctuations (
 $\unicode[STIX]{x1D6EC}=7.7$
mm), independent of
 $\unicode[STIX]{x1D6FC}$
and the same for the three considered bubble sizes. In practice, the non-dimensional wake length has thus been taken here as
 $\tilde{L}=\unicode[STIX]{x1D6EC}/d$
, while the value of
 $\tilde{w}$
has been varied. However, it has been shown that the results depend only on the wake volume scale
 $\tilde{L}\tilde{w}^{2}$
. The choice of the value of
 $\unicode[STIX]{x1D6EC}$
is therefore insignificant – provided its order of magnitude is preserved – and the interpretation of the results has to be done by considering the value of
 $\tilde{L}\tilde{w}^{2}$
. Next, the model for the turbulent agitation involves another unknown parameter, the standard deviation
 $\tilde{v}_{t}$
of the turbulent fluctuations at
 $\unicode[STIX]{x1D6FC}=1$
%. Eventually, the model hence involves two a priori unknown parameters,
 $\tilde{L}\tilde{w}^{2}$
and
 $\tilde{v}_{t}$
.
In the following, the values of
 $\tilde{L}\tilde{w}^{2}$
and
 $\tilde{v}_{t}$
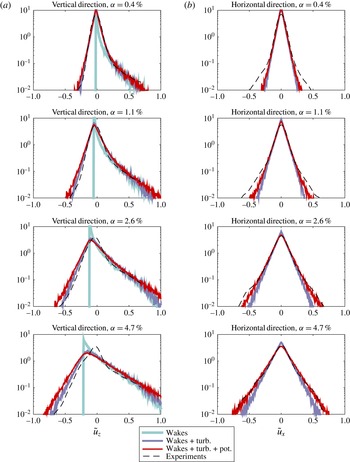
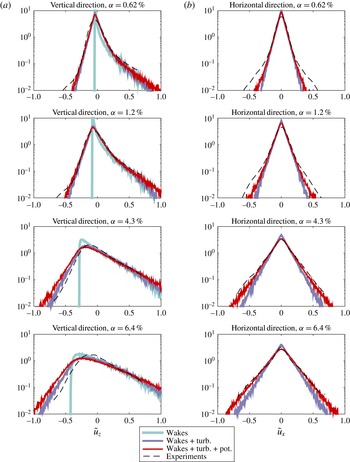
have been adjusted to fit the experimental results of Riboux et al. (Reference Riboux, Risso and Legendre2010). Figures 5, 6 and 7 show the p.d.f.s obtained with the present model for cases A, B and C (table 1), which correspond to experiments with bubbles of diameters 1.6, 2.1 and 2.5 mm, respectively. For each bubble size, the p.d.f.s of the vertical and horizontal fluctuations are shown for four gas volume fractions. In order to reveal the role of each contribution, the result of the model including the wake contribution only, that of the model including the wake and the turbulent contributions, and that of the complete model including the three contributions are plotted together with the experimental p.d.f.
Theoretical and experimental p.d.f.s of liquid velocity fluctuations for a bubble of 1.6 mm (case A in table 1).

Theoretical and experimental p.d.f.s of liquid velocity fluctuations for a bubble of 2.1 mm (case B in table 1).

Theoretical and experimental p.d.f.s of liquid velocity fluctuations for a bubble of 2.5 mm (case C in table 1).

Let us discuss how the two free parameters have been adjusted. For the value of
 $\tilde{v}_{t}$
, we consider the p.d.f. of the horizontal fluctuations. In any case, the contribution of the wake is totally negligible and that of the potential flow only has an influence on large fluctuations, an influence that increases with the bubble size and the gas volume fraction. It therefore turns out that the first exponential decay of the horizontal p.d.f. depends only on the turbulent agitation. The turbulent standard deviation has thus been adjusted from the slope
 $s$
of the first exponential decay,
 $\exp (-s|\tilde{u} _{x}|)$
, at the lowest available gas volume fraction
 $\unicode[STIX]{x1D6FC}_{min}$
:
 $\tilde{v}_{t}=(\sqrt{2}/s)(\unicode[STIX]{x1D6FC}_{min}/0.01)^{-0.4}$
. Eventually,
 $\tilde{v}_{t}$
is found to increase from 0.073 to 0.090 as the bubble diameter increases from 1.6 to 2.5 mm. For the wake parameter, we consider the p.d.f. of the vertical fluctuations. We remark that the exponential decay of the positive fluctuations is fully determined by the wake characteristics. The value of
 $\tilde{L}\tilde{w}^{2}$
has then been adjusted to fit the experimental decay at a value of
 $\unicode[STIX]{x1D6FC}$
around 4 %, in order to stay beyond the dilute regime described by (2.6), where the exponential decay is not yet attained. It is close to 0.8 for the smallest bubble and to 1.1 for the two largest ones. As expected, the wake dimensions are of the order of the bubble dimensions.
Figures 5, 6 and 7 show that the present model is in rather good agreement with the experimental p.d.f.s for the three diameters and predicts well their evolution with the gas volume fractions for
 $\unicode[STIX]{x1D6FC}$
in the range from 0.3 % to 8 %. Concerning the horizontal fluctuations (figures 5
b, 6
b and 7
b), the wake contribution is negligible. (Therefore, the p.d.f. obtained by considering only the wakes is not represented.) As already mentioned, at low gas volume fraction, the central part of the p.d.f., which corresponds to low to moderate velocity fluctuations, is totally dominated by the contribution of the turbulent agitation. The turbulent agitation is therefore responsible for the first exponential decay, the evolution of the slope of which is well reproduced by assuming that the standard deviation of the turbulent agitation scales as
 $\unicode[STIX]{x1D6FC}^{0.4}$
(3.2). Because it is localized in the close vicinity of the bubbles, the potential contribution can only influence the large fluctuations as long as
 $\unicode[STIX]{x1D6FC}$
remains small, and gives birth to a second exponential decay. When
 $\unicode[STIX]{x1D6FC}$
is increased, the potential contribution starts to significantly influence the statistics of lower and lower fluctuations as the close vicinity of the bubbles covers a larger and larger part of the flow.
However, if the comparison with the experiments shows that the slope of the second exponential decay is well reproduced for a gas volume fraction greater than or equal to 4 %, it is underestimated by the model at lower
 $\unicode[STIX]{x1D6FC}$
. A possible explanation for this deviation may be that we consider the potential flow that goes past an ellipsoidal bubble, while a better description would account for the fact that the flow has also to get around the bubble wake (Bush & Eames Reference Bush and Eames1998). More generally, it is evident that the present model is not based on an accurate description of the flow in the close vicinity of the bubble. However, we will not try to propose a more complex model because the interest of the present approach is to capture the main characteristics of the p.d.f.s of the liquid velocity fluctuations with the use of a minimum set of assumptions and adjustable parameters. Nevertheless, we think that it is reasonable to conclude that the second exponential decay in the experimental p.d.f. of the horizontal fluctuations is due to flow disturbances in the close vicinity of the bubble.
Regarding the p.d.f.s of the vertical fluctuations (figures 5
a, 6
a and 7
a), negative and positive velocities have to be distinguished. Negative vertical fluctuations are similar to horizontal fluctuations. At low gas volume fraction, the exponential decay is dominated by the turbulent agitation and the good agreement with the experiments confirms the validity of the assumption of an isotropic turbulent agitation (3.1). From the model we see that the contribution of the potential flow becomes significant when
 $\unicode[STIX]{x1D6FC}$
is increased. Again, a deviation from the experiments is seen at larger
 $\unicode[STIX]{x1D6FC}$
because of the crude model used to describe the flow in the close vicinity of the bubbles. Positive fluctuations are essentially generated by the wakes, with a secondary contribution of the turbulent agitation for large fluctuations.
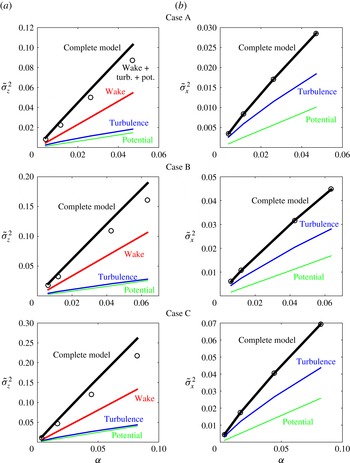
An advantage of the present model is to allow the distinction between the contributions of the different kinds of fluctuations. The variance of the fluctuations has been computed for the following cases: (1) the complete model including all contributions, (2) the potential contribution alone, (3) the wake contribution alone, and (4) the turbulent contribution alone. Figure 8 shows the corresponding variances as a function of the gas volume fraction for cases A, B and C. First, it is worth mentioning that, by model construction, the variance of the wake contribution is proportional to
 $\unicode[STIX]{x1D6FC}$
in the vertical direction (2.8) and zero in the horizontal direction, that of the potential contribution is proportional to
 $\unicode[STIX]{x1D6FC}$
in both directions, and that of the turbulent contribution is isotropic and proportional to
 $\unicode[STIX]{x1D6FC}^{0.8}$
(3.2): the relative weight of each of them is hence weakly dependent on
 $\unicode[STIX]{x1D6FC}$
. Second, since they both describe the flow in the vicinity of the bubble, the wake and the potential fluctuations are correlated to the bubble locations and are therefore not statistically independent of each other. Their common contribution to the total fluctuation is thus not simply the addition of their variances obtained in the case they are computed separately. That is the reason why, in the vertical direction, the sum of the three contributions considered separately (represented by circles in figure 8) is different from the variance obtained with the complete model. It is not the case in the horizontal direction because the wake contribution is zero.
Variances of vertical (a) and horizontal (b) liquid velocity fluctuations corresponding to the various contributions. (Note that the contribution of the average wakes is zero in the horizontal direction.)

This being said, we can discuss the main features of the fluctuating energy. In the vertical direction, the contribution of the individual bubble disturbances, which are mainly caused by the wakes, represents the major part of the fluctuating energy, while that of the turbulent agitation is relatively small. The picture is totally different in the horizontal direction where the energy of the turbulent agitation dominates over that of individual bubble disturbances, which are only due to the potential disturbances.
The present analysis leads to the conclusion that the total energy of the fluctuations is a rather poorly informative quantity, which does not reveal the physical nature of the fluctuation nor allow comparison between the directions. Moreover, the experimental determination of this quantity is in general not very robust since it can be notably altered by either a lack of detection or spurious measurements in the vicinity of the bubbles. Using the present model, the difficulty of describing the flow close to the bubbles will not significantly affect the determination of the turbulent contribution.
5 Conclusions
In most studies, the various contributions to the bubble-induced fluctuations are not distinguished. However, these contributions result from distinct physical mechanisms, such as local flow disturbances or flow instabilities, and therefore involve different time and length scales. With the purpose of understanding and modelling the bubble-induced agitation, it is therefore crucial to achieve such a decomposition. In this work, gathering all available pieces of information about homogeneous bubbly flows, we have proposed a simple model accounting for the elementary contribution of the flow disturbances in the vicinity of the bubbles and that of the turbulent agitation.
The flow in the vicinity of each bubble is modelled as the sum of the potential flow around an ellipsoidal bubble rising at constant velocity and an exponentially decaying wake, in agreement with observations (Risso et al. Reference Risso, Roig, Amoura, Riboux and Billet2008, and references therein). The turbulent contribution is modelled as an isotropic and homogeneous random fluctuation, the probability density of which is exponential, in agreement with the observation of the flow through a random array of fixed spheres or bubbles (Amoura Reference Amoura2008; Riboux et al. Reference Riboux, Legendre and Risso2013). Both these contributions involve nonlinear hydrodynamics: nonlinear interactions between individual bubble disturbances are responsible for wake attenuations, and nonlinear flow instabilities generate turbulent fluctuations.
The turbulent fluctuations and the flow disturbances generated in the vicinity of the bubbles are assumed to be statistically independent. This assumption is supported by the fact that the wake attenuation that is observed in bubbly flows does not result from an enhanced diffusion by the turbulence (Hunt & Eames Reference Hunt and Eames2002; Risso et al. Reference Risso, Roig, Amoura, Riboux and Billet2008), and is consistent with a turbulence generated by a collective instability of the flow through a bubble swarm.
The present model involves two unknown parameters, one accounting for the wake volume and the other for the intensity of the turbulent agitation. Taking advantage of the fact that some parts of the p.d.f. depend on a single contribution, we have proposed an objective way to determine these two parameters independently of each other by adjustment of experimental results. The model is found to reproduce well the experimental results obtained in a homogeneous bubble column by Riboux et al. (Reference Riboux, Risso and Legendre2010) for gas volume fractions in the range from a few tenths of one per cent up to 8 %, and high bubble Reynolds numbers from 540 to 760. In this range of parameters, the model can thus be used to decompose the three contributions to the bubble-induced turbulence in experiments where shear-induced turbulence is absent.
Comparisons of the model with other experiments are highly desirable, but there are no other published works that provide the data to do so. In future work, it would be interesting to test the robustness of the model assumptions for lower Reynolds number, say in the range from 10 to 500 that was considered in the experiments of Martínez Mercado et al. (Reference Martínez Mercado, Palacios-Morales and Zenit2007) and Mendez-Diaz et al. (Reference Mendez-Diaz, Serrano-Garcia, Zenit and Hernández-Cordero2013). First, the range in which the p.d.f. shapes remain similar to those found by Riboux et al. (Reference Riboux, Risso and Legendre2010) should be determined. In this range, the evolution of the turbulence and wake parameters of the model,
 $\unicode[STIX]{x1D70E}_{t}$
and
 $\tilde{L}\tilde{w}^{2}$
, should be determined. It could also be envisaged to complete the model by accounting for the contribution of the shear-induced turbulence to address more complex bubbly flows. Since shear-induced turbulence generates a Gaussian p.d.f. that is clearly different from the contributions of bubble-induced turbulence, the distinction between the various contributions from an experimental p.d.f. should still be possible.
Regarding bubble-induced turbulence, the contribution of the wakes is now rather well understood. It was already found that it could cause a
 $k^{-3}$
subrange in the spectral domain (Risso Reference Risso2011) and we have shown here that it is responsible for the exponential tail of the vertical p.d.f. in the direction of upward fluctuations. Conversely, even if the properties of the turbulent contribution have been determined experimentally, its dynamics still needs to be elucidated. From the study of the flow through a random array of fixed spheres or bubbles (Amoura Reference Amoura2008; Riboux et al.
Reference Riboux, Legendre and Risso2013), it turns out that the signature of the turbulent contribution is characterized by a
 $k^{-3}$
subrange in the spectral domain and by an isotropic exponential p.d.f. Furthermore, the present work has shown that assuming isotropic turbulent fluctuations with a exponential p.d.f. is consistent with measurements in a homogeneous bubble column. However, the reasons for these statistical features are still an open question. We think that they could be understood by a systematic study of the stability of the flow through a random array of obstacles.
Appendix A. Theoretical derivation of the p.d.f.s of wake-induced fluctuations in the limit of low gas volume fraction
In this section we present the derivation of the p.d.f. generated by the summation of the wakes of randomly distributed bubbles in the limit of small gas volume fractions. Let us consider a volume
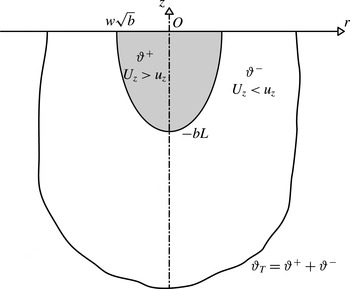
 $\unicode[STIX]{x1D717}_{T}$
of fluid located downward of a bubble that generates a wake described by (2.4) (see figure 9). Since the bubble number density is small, we assume that the liquid velocity in
 $\unicode[STIX]{x1D717}_{T}$
is only due to the wake of the bubble located at the origin
 $O$
of the cylindrical coordinates
 $(r,\unicode[STIX]{x1D703},z)$
. The volume
 $\unicode[STIX]{x1D717}^{+}$
in which the vertical liquid velocity is larger than a given value
 $\tilde{u_{z}}$
is located above the parabola with equation
 $$\begin{eqnarray}\frac{z}{L}+\frac{r^{2}}{w^{2}}=\log \left(\frac{1}{\tilde{u_{z}}}\right)=b,\end{eqnarray}$$
Schematic illustrating the theoretical derivation of the p.d.f.s of wake-induced fluctuations in the limit of low gas volume fraction (appendix A).

and thus we can write
 $$\begin{eqnarray}\unicode[STIX]{x1D717}^{+}=\int _{\unicode[STIX]{x1D703}=0}^{2\unicode[STIX]{x03C0}}\int _{z=-bL}^{0}\int _{r=0}^{w\sqrt{b+z/L}}r\,\text{d}\unicode[STIX]{x1D703}\,\text{d}r\,\text{d}z=\frac{\unicode[STIX]{x03C0}}{2}Lw^{2}\log ^{2}\left(\frac{1}{\tilde{u_{z}}}\right).\end{eqnarray}$$
If we randomly select a point within the volume
 $\unicode[STIX]{x1D717}_{T}$
, the probability that the velocity
 $\tilde{U_{z}}$
at this point is lower than a given value
 $\tilde{u_{z}}$
is
 $$\begin{eqnarray}G_{z}(\tilde{u_{z}})=\text{Prob}(\tilde{U_{z}}\leqslant \tilde{u_{z}})=1-\unicode[STIX]{x1D717}^{+}/\unicode[STIX]{x1D717}_{T}.\end{eqnarray}$$
Now, considering that
 $\unicode[STIX]{x1D717}_{T}$
is the average volume that contains a single bubble of volume
 $\unicode[STIX]{x1D717}_{b}$
, we can express it as a function of the bubble diameter and gas volume fraction,
 $$\begin{eqnarray}\unicode[STIX]{x1D717}_{T}=\frac{\unicode[STIX]{x1D717}_{b}}{\unicode[STIX]{x1D6FC}}=\frac{\unicode[STIX]{x03C0}d^{3}}{6\unicode[STIX]{x1D6FC}}.\end{eqnarray}$$
The p.d.f.
 $g_{z}$
is the derivative of the distribution function
 $G_{z}$
. Substituting (A 4) in (A 3) and differentiating yields
 $$\begin{eqnarray}g_{z}(\tilde{u_{z}})=\unicode[STIX]{x1D705}\,\frac{1}{\tilde{u_{z}}}\log \left(\frac{1}{\tilde{u_{z}}}\right)\quad \text{with }\unicode[STIX]{x1D705}=6\unicode[STIX]{x1D6FC}\,\frac{w^{2}L}{d^{3}}.\end{eqnarray}$$
Because of the assumptions made, this p.d.f. is only defined on the finite interval
 $[\unicode[STIX]{x1D716},1]$
. The lower bound results from the fact that the considered volume
 $\unicode[STIX]{x1D717}_{T}$
is finite. A velocity fluctuation cannot therefore be lower than the value of
 $\tilde{v_{z}}$
at the frontier of
 $\unicode[STIX]{x1D717}_{T}$
. The value of
 $\unicode[STIX]{x1D716}$
is obtained from the fact that the sum of a probability function must be unity,
 $$\begin{eqnarray}\int _{\unicode[STIX]{x1D716}}^{1}g_{z}(\tilde{u_{z}})\,\text{d}\tilde{u_{z}}=\frac{\unicode[STIX]{x1D705}}{2}\log ^{2}\left(\frac{1}{\unicode[STIX]{x1D716}}\right)=1,\end{eqnarray}$$
which leads to
 $$\begin{eqnarray}\unicode[STIX]{x1D716}=\exp \left(-\sqrt{\frac{2}{\unicode[STIX]{x1D705}}}\right).\end{eqnarray}$$
The upper bound is a consequence of the fact that any velocity fluctuation results only from the disturbance caused by a single bubble wake. It thus cannot exceed 1, which is the maximum of
 $\tilde{v_{z}}$
defined by (2.4).
Since the wakes induce only positive velocity disturbances, the present distribution has a positive average,
 $$\begin{eqnarray}M=\int _{\unicode[STIX]{x1D716}}^{1}g_{z}(\tilde{u_{z}})\tilde{u_{z}}\,\text{d}\tilde{u_{z}}=\unicode[STIX]{x1D705}\left(1-\unicode[STIX]{x1D716}-\unicode[STIX]{x1D716}\sqrt{\frac{2}{\unicode[STIX]{x1D705}}}\right).\end{eqnarray}$$
In order to have a distribution
 $f_{z}$
with a zero average velocity, we need to shift the p.d.f. as
 $$\begin{eqnarray}f_{z}(\tilde{u_{z}})=g_{z}(\tilde{u_{z}}+M),\end{eqnarray}$$
and we finally get
 $$\begin{eqnarray}f_{z}(\tilde{u_{z}})=\unicode[STIX]{x1D705}\,\frac{1}{\tilde{u_{z}}+M}\log \left(\frac{1}{\tilde{u_{z}}+M}\right)\quad \text{for }\unicode[STIX]{x1D716}-M\leqslant \tilde{u_{z}}\leqslant 1-M.\end{eqnarray}$$
Appendix B. Auxiliary variable for the generation of statistical samples following an exponential p.d.f.
Let
 $u$
be a random variable defined on the interval
 $]\!-\infty ,+\infty \ $f(u)$
its p.d.f. and
 $F(u)$
its distribution function (or cumulative p.d.f.). From elementary statistics, it is known that
 $\unicode[STIX]{x1D709}=F(u)$
is a random variable uniformly distributed on the interval
 $[0,1]$
.
If the p.d.f. is
 $$\begin{eqnarray}f(u)=\frac{\sqrt{2}}{2\unicode[STIX]{x1D70E}}\exp \left(-\frac{\sqrt{2}|u|}{\unicode[STIX]{x1D70E}}\right),\end{eqnarray}$$
then the distribution function is
 $$\begin{eqnarray}\left.\begin{array}{@{}l@{}}F(u)={\displaystyle \frac{\sqrt{2}}{2\unicode[STIX]{x1D70E}}}\displaystyle \int _{-\infty }^{U}\exp \left(+{\displaystyle \frac{\sqrt{2}u}{\unicode[STIX]{x1D70E}}}\right)={\displaystyle \frac{1}{2}}\exp \left(+{\displaystyle \frac{\sqrt{2}u}{\unicode[STIX]{x1D70E}}}\right)\quad \text{for }u\leqslant 0,\\ F(u)={\displaystyle \frac{1}{2}}+{\displaystyle \frac{\sqrt{2}}{2\unicode[STIX]{x1D70E}}}\displaystyle \int _{0}^{U}\exp \left(-{\displaystyle \frac{\sqrt{2}u}{\unicode[STIX]{x1D70E}}}\right)=1-{\displaystyle \frac{1}{2}}\exp \left(-{\displaystyle \frac{\sqrt{2}u}{\unicode[STIX]{x1D70E}}}\right)\quad \text{for }u\geqslant 0,\end{array}\right\}\end{eqnarray}$$
and its reciprocal is
 $$\begin{eqnarray}\left.\begin{array}{@{}l@{}}u=F^{-1}(\unicode[STIX]{x1D709})={\displaystyle \frac{\unicode[STIX]{x1D70E}}{\sqrt{2}}}\log (2\unicode[STIX]{x1D709})\quad \text{for }\unicode[STIX]{x1D709}\leqslant {\displaystyle \frac{1}{2}},\\ u=F^{-1}(\unicode[STIX]{x1D709})=-{\displaystyle \frac{\unicode[STIX]{x1D70E}}{\sqrt{2}}}\log (2-2\unicode[STIX]{x1D709})\quad \text{for }\unicode[STIX]{x1D709}\geqslant {\displaystyle \frac{1}{2}},\end{array}\right\}\end{eqnarray}$$
which can be rewritten by using the absolute value and sign functions as
 $$\begin{eqnarray}u=\text{sgn}(1-2\unicode[STIX]{x1D701}){\displaystyle \frac{\unicode[STIX]{x1D70E}}{\sqrt{2}}}\log (1-|1-2\unicode[STIX]{x1D701}|).\end{eqnarray}$$
Equation (B 4) thus allows one to transform a set of values of
 $\unicode[STIX]{x1D709}$
that are uniformly distributed between 0 and 1 into a set of values of
 $u$
that are distributed according to (B 1).