



1. Introduction
Particle-laden flows are ubiquitous in numerous natural and industrial processes, such as fluidized beds, drug delivery, drilling processes and sand storms. A great many works have been dedicated to the development of computational models for particle-laden flows. The two-fluid model (i.e. the Euler–Euler method) (Ding & Gidaspow Reference Ding and Gidaspow1990; Ishii & Hibiki Reference Ishii and Hibiki2010) and the discrete particle (or element) model (i.e. the Euler–Lagrange method) (Tsuji, Kawaguchi & Tanaka Reference Tsuji, Kawaguchi and Tanaka1993; Deen et al. Reference Deen, Van Sint Annaland, Van der Hoef and Kuipers2007) are two models widely used for simulations of industrial-scale multiphase flows. The drag model is most important for the accuracy of these two methods and is the subject of extensive studies (Tenneti & Subramaniam Reference Tenneti and Subramaniam2014; Wang Reference Wang2020). The feature of the two-fluid model is that the particle phase is treated as a continuous phase, like a fluid, and a computational cell could contain a large number of particles whose positions are not tracked. In the present study, we are concerned with modelling of the average drag used in the two-fluid model for dense particle-laden flows, and thus, in the following we only review the works on the drag models for two-fluid simulations, although there are many other state-of-the-art methods for the particle-laden flows based on filtering approaches, such as the multiphase turbulence models (Fox Reference Fox2014) and the Lagrangian probability-density-function model (Innocenti et al. Reference Innocenti, Fox, Salvetti and Chibbaro2019; Innocenti, Fox & Chibbaro Reference Innocenti, Fox and Chibbaro2021).
The early and widely used drag models were obtained from experimental data (Wen & Yu Reference Wen and Yu1966; Gidaspow Reference Gidaspow1994; Zhang & Reese Reference Zhang and Reese2003). In the past two decades, interface-resolved direct numerical simulations (IR-DNS) (van der Hoef et al. Reference van der Hoef, van Sint Annaland, Deen and Kuipers2008; Balachandar & Eaton Reference Balachandar and Eaton2010; Tenneti & Subramaniam Reference Tenneti and Subramaniam2014; Maxey Reference Maxey2017) have been employed extensively to develop more accurate drag models based on either fixed particle beds (Hill, Koch & Ladd Reference Hill, Koch and Ladd2001; van der Hoef, Beetstra & Kuipers Reference van der Hoef, Beetstra and Kuipers2005; Beetstra, van der Hoef & Kuipers Reference Beetstra, van der Hoef and Kuipers2007; Tenneti, Garg & Subramaniam Reference Tenneti, Garg and Subramaniam2011; Tang et al. Reference Tang, Peters, Kuipers, Kriebitzsch and van der Hoef2015; Zhou & Fan Reference Zhou and Fan2015) or dynamic particle-laden flows (Luo et al. Reference Luo, Tan, Wang and Fan2016; Rubinstein, Derksen & Sundaresan Reference Rubinstein, Derksen and Sundaresan2016; Tang, Peters & Kuipers Reference Tang, Peters and Kuipers2016; Tavanashad, Passalacqua & Subramaniam Reference Tavanashad, Passalacqua and Subramaniam2021; Xia et al. Reference Xia, Yu, Pan, Lin and Guo2022b).
The above-mentioned models were mainly developed for the homogeneous system where the particles are distributed homogeneously within the computational cell. In many industrial-scale applications, particles with random and uniform distributions initially may self-organize into heterogeneous structures (clusters) with a wide range of spatial and temporal scales. The heterogeneous structure of particles is also referred to as the mesoscale structure. When there exists a particle cluster, namely the particle distribution is inhomogeneous in a computational cell in the coarse-grid simulations, the drag models for the homogeneous system are no longer accurate, and often overestimate the drag significantly (Sundaresan, Ozel & Kolehmainen Reference Sundaresan, Ozel and Kolehmainen2018). The filtered method (Igci et al. Reference Igci, Andrews, Sundaresan, Pannala and O'Brien2008) and the heterogeneity-based method (including the energy minimization multi-scale model, i.e. EMMS model) (Li Reference Li1994) are two typical methods accounting for the effects of unresolved mesoscale structure on the drag force (Wang Reference Wang2020).
The basic idea of the filtered model is to establish the drag model based on the data from highly resolved simulations, including the fine-grid two-fluid model (TFM) (Igci et al. Reference Igci, Andrews, Sundaresan, Pannala and O'Brien2008; Igci & Sundaresan Reference Igci and Sundaresan2011), discrete element method–computational fluid dynamics (DEM-CFD) (Radl & Sundaresan Reference Radl and Sundaresan2014; Ozel et al. Reference Ozel, Gu, Milioli, Kolehmainen and Sundaresan2017; Beetham, Fox & Capecelatro Reference Beetham, Fox and Capecelatro2021) and interface-resolved simulations (Rubinstein et al. Reference Rubinstein, Ozel, Yin, Derksen and Sundaresan2017; Liu, Ge & Wang Reference Liu, Ge and Wang2020) with a filtering (averaging) procedure. There are two categories for the filtered drag models,depending on whether the drift velocity is used for the modelling. In the first category, drag models are modified by a mesoscale correction coefficient directly using available filtered quantities such as filtered volume fraction, filtered slip velocity and filter size (Milioli et al. Reference Milioli, Milioli, Holloway, Agrawal and Sundaresan2013; Radl & Sundaresan Reference Radl and Sundaresan2014; Sarkar et al. Reference Sarkar, Milioli, Ozarkar, Li, Sun and Sundaresan2016; Zhu, Liu & Luo Reference Zhu, Liu and Luo2018; Cloete et al. Reference Cloete, Cloete, Radl and Amini2019; Milioli & Milioli Reference Milioli and Milioli2023).
In the second category, the effects of the mesoscale structures on the drag are correlated with the subgrid quantities, including the drift velocity and the variance of the solid volume fraction, which also need to be modelled with the filtered quantities. The drift velocity is defined as the difference between the mean fluid velocity seen by the particles and the phase-averaged fluid velocity in the cell. Parmentier, Simonin & Delsart (Reference Parmentier, Simonin and Delsart2012) found that it is necessary to take the subgrid drift velocity into account to predict the significant drag decrease obtained from fine-grid TFM results. The variance of the solid volume fraction, which indicates the heterogeneity of particle distribution in the filter cell, has been found to be related with the drag force (Schneiderbauer Reference Schneiderbauer2017). Chen et al. (Reference Chen, Song, Jiang and Zhou2020) proposed an expression of the filtered drag force using the Taylor polynomial approximation of a microscopic drag coefficient, which reveals that the drift velocity and the variance of the solid volume fraction are two important subgrid quantities for the estimation of the drag force. The DEM-CFD simulations (Ozel et al. Reference Ozel, Gu, Milioli, Kolehmainen and Sundaresan2017) and interface-resolved simulations (Rubinstein et al. Reference Rubinstein, Ozel, Yin, Derksen and Sundaresan2017; Zhao, Chen & Zhou Reference Zhao, Chen and Zhou2021) demonstrated that the drift velocity and variance of the solid volume fraction are predominant markers in the modelling of local drag force. Schneiderbauer (Reference Schneiderbauer2017) employed the variance of the solid volume fraction and subgrid velocity fluctuations of the fluid and particle phases as markers in the drag closure. Furthermore, the anisotropy of the filtered drag was found to be crucial in the simulations (Cloete et al. Reference Cloete, Cloete, Municchi, Radl and Amini2018; Rauchenzauner & Schneiderbauer Reference Rauchenzauner and Schneiderbauer2020).
Although the subgrid markers can account for the contribution of the mesoscale structure on the drag force, they are not available in coarse-grid simulations. The drift velocity can be modelled via a scale-similarity approach (Parmentier et al. Reference Parmentier, Simonin and Delsart2012) and a gradient model (Ozel, Fede & Simonin Reference Ozel, Fede and Simonin2013). By performing momentum balance analysis, Jiang, Chen & Zhou (Reference Jiang, Chen and Zhou2020) proposed an explicit model of drift velocity by introducing a scaled filtered pressure gradient. Rauchenzauner & Schneiderbauer (Reference Rauchenzauner and Schneiderbauer2020) proposed a dynamic anisotropic model, where the drift velocity was modelled by components of the filtered fluid-phase velocity fluctuations. Schneiderbauer & Saeedipour (Reference Schneiderbauer and Saeedipour2018, Reference Schneiderbauer and Saeedipour2019) employed an approximate deconvolution model to reconstruct the unresolved flow field using the information around the local filtered cell, and then the approximate subgrid quantities were directly obtained by a deconvolution computation. Recently, the artificial neural network method has been shown to be a promising tool to construct the drift velocity implicitly (Zhang et al. Reference Zhang, Jiang, Chen, Yu and Zhou2020; Jiang et al. Reference Jiang, Chen, Kolehmainen, Kevrekidis, Ozel and Sundaresan2021; Zhu et al. Reference Zhu, Ouyang, Lei and Luo2021). Beetham et al. (Reference Beetham, Fox and Capecelatro2021) proposed models for the drift velocity and volume fraction variance using symbolic regression from Eulerian–Lagrangian simulation data.
In principle, the interface-resolved simulations are able to provide accurate drag forces on the particles, which is the advantage over the fine-grid two-fluid simulations and the Euler–Lagrange simulations for dense particle-laden flows. The drawback of the interface-resolved simulations is the huge computational cost. The interface-resolved simulations have been used to establish drag models for inhomogeneous systems. Wang, Liu & You (Reference Wang, Liu and You2011) proposed a drag model by introducing a non-uniformity coefficient. In some other structure-dependent models (Zhou et al. Reference Zhou, Xiong, Wang, Wang, Ren and Ge2014; Li et al. Reference Li, Wang, Rogers, Zhou and Ge2017), the drag force depends on the volume fraction gradient and the slip velocity. Zhao et al. (Reference Zhao, Zhou, Yang and Chen2022) proposed a drag model that considers the effect of the solid volume fraction in the surrounding cells on the drag force at low Reynolds numbers.
From the perspective of filtered drag modelling using subgrid quantities, Rubinstein et al. (Reference Rubinstein, Ozel, Yin, Derksen and Sundaresan2017) modelled the effects of drift velocity and variance of the solid volume fraction on the local drag on the basis of interface-resolved simulations for the filter size ranging from  $3d_p$ to
 $5d_p$. Following the methodology of Rubinstein et al. (Reference Rubinstein, Ozel, Yin, Derksen and Sundaresan2017), Zhao et al. (Reference Zhao, Chen and Zhou2021) proposed a drag model that depends on the solid drift flux and variance of the solid volume fraction that are available in DEM-CFD simulations. We note that these studies are limited to small-scale simulations of macroscopically homogeneous systems under low-Reynolds-number conditions.
Due to huge computational costs, there are very few works on mesoscale drag modelling based on large-scale DNS. Liu et al. (Reference Liu, Ge and Wang2020) proposed a scale-dependent drag model as a function of the grid Froude number from the results of large-scale interface-resolved simulations of heterogeneous gas–solid flows, but no subgrid markers were introduced. In the present study, we aim to check whether the existing mesoscale drag models can predict the drag in our large-scale interface-resolved simulations of inhomogeneous particle-laden flows, and also attempt to improve the mesoscale drag model with our DNS data. We first study the effects of the subgrid drift velocity and variance of the solid volume fraction on the filtered drag force and propose a model for mesoscale drag correction as a function of both filtered and subgrid quantities. Then the existing subgrid models and a new combined model for drift velocity and variance of the solid volume fraction are evaluated via a priori study. Finally, we assess the filtered drag models using the predicted subgrid quantities. To the best of our knowledge, this is the first work to employ the data of large-scale interface-resolved direct simulations of inhomogeneous particle-laden flows to develop a drag correlation for the two-fluid model via the filtering method or using the drift velocity.
The rest of the paper is organized as follows. In § 2 we describe the numerical method, simulation set-up and filtering method. In § 3 we present the results on the development of mesoscale drag correlations based on subgrid models and our DNS data. In § 4 we summarize the principal contributions of the present study.
2. Interface-resolved simulations of sedimentation suspensions
2.1. Direct-forcing/fictitious domain method
In the present study the simulations are conducted with the direct-forcing/fictitious domain (DF/FD) method (Yu & Shao Reference Yu and Shao2007; Yu et al. Reference Yu, Lin, Shao and Wang2016). The key idea of this method is to fill the interior domain of particles with fictitious fluids and rigid-body constraints on the fictitious fluid are enforced through a pseudo-body force (i.e. distributed Lagrange multiplier) in the particle domain (Glowinski et al. Reference Glowinski, Pan, Hesla and Joseph1999).
The dimensionless formulation of the fictitious domain method for incompressible fluid (written for simplicity for a system with a single particle) can be written as
 $$\begin{gather} \frac{\partial {\boldsymbol{u}}}{\partial t}+{\boldsymbol{u}} \boldsymbol{\cdot} \boldsymbol{\nabla} {\boldsymbol{u}}= \frac{\nabla^2 {\boldsymbol{u}}}{Re}-\boldsymbol{\nabla} p +{\boldsymbol{\lambda}} \quad \text{in} \ \varOmega, \end{gather}$$
 $$\begin{gather}{\boldsymbol{u}}={\boldsymbol{U}}+{\boldsymbol{\omega}_p} \times {\boldsymbol{r}}\quad \text{in} \ {P}, \end{gather}$$
 $$\begin{gather}\boldsymbol{\nabla} \boldsymbol{\cdot} {\boldsymbol{u}} =0 \quad \text{in} \ {\varOmega}, \end{gather}$$
 $$\begin{gather}(\rho_r -1)V_p^*\left(\frac{{\rm d} {\boldsymbol{U}}}{{\rm d} t}-Fr \frac{\boldsymbol{g}}{ g}\right)={-}\int_P {\boldsymbol{\lambda}}\, {\rm d}{\kern0.8pt}{\boldsymbol{x}}, \end{gather}$$
 $$\begin{gather}(\rho_r -1)\frac{{\rm d} ({\boldsymbol{J}}^* \boldsymbol{\cdot}{\boldsymbol{\omega }}_p)}{{\rm d} t}={-}\int_P\boldsymbol{r}\times{\boldsymbol{\lambda}}\,{\rm d}{\kern0.8pt}{\boldsymbol{x}}, \end{gather}$$
where  $\boldsymbol{u}$,
 $p$ and
 $\boldsymbol{\lambda}$,
 $\boldsymbol{r}$ represent the fluid velocity, pressure, pseudo-body force and position vector with respect to the mass centre of the particle, respectively. The particle domain and entire fluid/particle domain are denoted by
 $P$ and
 $\varOmega$. The viscosity and density of the fluid are
 $\mu$ and
 $\rho _f$. The particle density, volume and moment of inertia tensor, translational velocity and angular velocity are denoted by
 $\rho _s$,
 $V_p$,
 $\boldsymbol{J}$,
 $\boldsymbol{U}$ and
 $\boldsymbol{\omega}_p$, respectively. Here
 $\rho _r$ is the particle–fluid density ratio defined by
 $\rho _r=\rho _s/\rho _f$. The characteristic scales for the non-dimensionalization are as follows:
 $L_c$ for length,
 $U_c$ for velocity,
 $L_c/U_c$ for time,
 ${\rho _f}U_c^2/L_c$ for the body force. Here
 $Re$ is the Reynolds number defined by
 $Re=\rho _{f} U_c L_c/\mu$,
 $Fr$ is the Froude number defined by
 $Fr=gL_c/U_c^2$, with
 $g$ being the gravitational acceleration;
 $V_p^*$ and
 $\boldsymbol{J}^*$ are the dimensionless particle volume and moment of inertia tensor, defined by
 $V_p^*=V_p/L_c^3$ and
 $\boldsymbol{J}^*=\boldsymbol{J}/\rho _s L_c^5$.
A fractional-step temporal scheme is used to decouple the system (2.1)–(2.5) into two subproblems.
(1) Fluid subproblem for
 ${\boldsymbol {u}}^*$ and $p$ is given by
(2.6)$$\begin{gather} \frac{\boldsymbol{u}^*-\boldsymbol{u}^n}{\Delta t}-\frac{1}{2}\frac{\nabla^2\boldsymbol{u}^*}{Re}={-}\boldsymbol{\nabla} p-\frac{1}{2}[3(\boldsymbol{u} \boldsymbol{\cdot} \boldsymbol{\nabla} \boldsymbol{u})^n-(\boldsymbol{u} \boldsymbol{\cdot} \boldsymbol{\nabla} \boldsymbol{u})^{n+1}]+\frac{1}{2}\frac{\nabla^2\boldsymbol{u}^n}{Re}+\boldsymbol{\lambda}^n, \end{gather}$$(2.7)$$\begin{gather}\boldsymbol{\nabla} \boldsymbol{\cdot} \boldsymbol{u}^*=0. \end{gather}$$
A finite-difference-based projection method on a homogeneous half-staggered grid is used. All spatial derivatives are discretized with a second-order central difference scheme.
(2) Particle subproblem for
$\boldsymbol{U}^{n+1}$, $\boldsymbol{\omega }_p^{n+1}$, $\boldsymbol{\lambda }^{n+1}$ and $\boldsymbol{u}^{n+1}$ is given by
(2.8)$$\begin{gather} \rho_r V_p^* \frac{\boldsymbol{U}^{n+1}}{\Delta t}=(\rho_r-1) V_p^* \left(\frac {\boldsymbol{U}^n}{\Delta t}-Fr\frac{\boldsymbol{g}}{g}\right)+\int_P \left({\frac{\boldsymbol{u}^*}{\Delta t}- \boldsymbol{\lambda}^n}\right){\rm d}{\kern0.8pt}{\boldsymbol{x}}, \end{gather}$$(2.9)The pseudo-body force$$\begin{gather}\rho_r \frac{\boldsymbol{J}^{*}\boldsymbol{\cdot} \boldsymbol{\omega }_p^{n+1}}{\Delta t}=(\rho_r-1) \left[\frac{\boldsymbol{J}^{*} \boldsymbol{\cdot} \boldsymbol{\omega }_p^{n}}{\Delta t}-\boldsymbol{\omega }_p^{n} \times (\boldsymbol{J}^{*} \boldsymbol{\cdot} \boldsymbol{\omega }_p^{n})\right]+\int_P \boldsymbol{r} \times \left({\frac{\boldsymbol{u}^*}{\Delta t}- \boldsymbol{\lambda}^n}\right) {\rm d}{\kern0.8pt}\boldsymbol{{x}}. \end{gather}$$$\boldsymbol{\lambda}$ is then updated from
(2.10)The fluid–particle force acting on the particle can be directly obtained by integrating the pseudo-body force over the volume of each particle as\begin{equation} \boldsymbol{\lambda}^{n+1}=\frac{\boldsymbol{U}^{n+1}+\boldsymbol{\omega}_p^{n+1}\times \boldsymbol{r}-\boldsymbol{u}^*}{\Delta t}+\boldsymbol{\lambda}^n. \end{equation}(2.11)Finally, the fluid velocities\begin{equation} \boldsymbol{F}^H={-}\int_P \boldsymbol{\lambda} \,\mathrm{d}{\kern0.8pt}\boldsymbol{x}+\frac{M}{\rho_{r}} \frac{\mathrm{d} \boldsymbol{U}}{\mathrm{d} t}. \end{equation}$\boldsymbol{u}^{n+1}$ at the Eulerian nodes are corrected as
(2.12)\begin{equation} \boldsymbol{u}^{n+1}=\boldsymbol{u}^{*}+\Delta t (\boldsymbol{\lambda}^{n+1}-\boldsymbol{\lambda}^{n}). \end{equation}


In the above manipulations, a discrete  $\delta$ function in the form of a trilinear function is employed to transfer quantities between the Eulerian and Lagrangian nodes.
We implement a soft-sphere collision model with the lubrication correction to solve the short-ranged interparticle interaction. The soft-sphere collision model is a discrete element model based on a nonlinear soft-sphere approach. The lubrication force model is used to calculate the unresolved hydrodynamic forces exerted on the particles (Brändle de Motta et al. Reference Brändle de Motta, Breugem, Gazanion, Estivalezes, Vincent and Climent2013). The time step for the collision process is set to be one tenth of that for the flow solution (i.e.  $\Delta t_c = \Delta t/10$). Our collision model combined with the lubrication correction has been validated in our previous work (Xia et al. Reference Xia, Xiong, Yu and Zhu2020), and the reader is referred to this work for the details of our collision model.
2.2. Simulation set-up
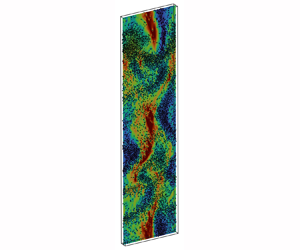
As shown in figure 1, particles freely settle in a fully periodic domain of dimensions  $( L_{x},L_{y},L_{z}) = (320d_p,10d_p,80d_p)$. The gravitational acceleration
 $\boldsymbol {g}$ points along the negative
 $x$ direction. Initially, particles are placed randomly in the computational box, and the mean flux of the suspension is kept to zero by instantaneously adjusting the pressure gradient. The number of particles is given by
 \begin{equation} {N_p} = \left[ {\frac{{6{\langle \phi \rangle}}}{{\rm \pi} }\frac{{{L_x}{L_y}{L_z}}}{{d_p^3}}} \right], \end{equation}
where  $[ ({\cdot } ) ]$ denotes the nearest integer and
 $\langle \phi \rangle$ denotes the domain-averaged solid volume fraction.
Snapshots for the large-scale IR-DNS of particle-laden flows for (a) case 1,  $\langle \phi \rangle =0.1$, (b) case 2,
 $\langle \phi \rangle =0.15$, (c) case 3,
 $\langle \phi \rangle =0.2$, (d) case H1,
 $\langle \phi \rangle =0.1$.

We take the sphere diameter  $d_p$ as the characteristic length, and the characteristic velocity
 $u_c$ is selected as
 \begin{equation} {u_c} = \sqrt {\frac{{4( {{\rho_r} - 1} )g{d_p}}}{{3}}}. \end{equation}
The Galileo number  $Ga = \sqrt {d_p^3( {{\rho _r} - 1} )g} /\nu$ and the single-particle settling Reynolds number
 $Re_p = {u_t}{d_p}/\nu$ are widely used to measure the particle settling effect, with
 $u_t$ being the terminal settling velocity of an isolated particle in the form
 \begin{equation} {u_t} = \sqrt {\frac{{4( {{\rho_r} - 1} )g{d_p}}}{{3{C_{D}}}}}, \end{equation}
where  $C_{D}$ is the standard drag coefficient
 \begin{equation} C_{D} = \frac{{24}}{{R{e_{{{p}}}}}}( {1 + 0.15Re_{{{p}}}^{0.687}} ). \end{equation}
Then, a relation between the single-particle settling Reynolds number and the Galileo number can be obtained as
 \begin{equation} G{a^2} = 18Re_p( {1 + 0.15Re_p^{0.687}}). \end{equation}
The particle Stokes number, which represents the ratio of the particle relaxation to the fluid relaxation time, is defined as
 \begin{equation} S{t_p} = \frac{{{\rho_s} {{{u}_t}} {d_p}}}{{18\mu }} = \frac{{{\rho_r}Re_p}}{{18}}. \end{equation}
The parameter settings for our simulations are listed in table 1. A large density ratio of  $\rho _r=100$ is chosen to generate the clustered flows. To address the difference between the homogeneous and clustered flows, two additional simulations with
 $\rho _r=2$ are performed to produce nearly homogeneous flows, as shown in figure 1(d).
Parameter settings for the cases studied.

The domain is discretized using a uniform Cartesian grid and the grid resolution with respect to the particle size is  $d_p/\Delta x = 12.8$, which was shown to have good accuracy for particle Reynolds numbers below 100 for the sedimentation of a single sphere (Yu & Shao Reference Yu and Shao2007; Xia et al. Reference Xia, Yu, Pan, Lin and Guo2022b). We examine the effects of grid resolution on the drag force of moderately dense suspensions in Appendix A, and show that this grid resolution can produce reasonably accurate results. The dimensionless time step is
 $\Delta t=0.01$ with
 ${\rm CFL}=u_c \Delta t / \Delta x$ (where CFL denotes Courant–Friedrichs–Lewy) is about 0.15, and we set the dimensionless Young's modulus
 $E/(\rho _f u_c^2)=3 \times 10^5$, the Poisson ratio
 $\sigma$ = 0.33 and the friction coefficient
 $f = 0.3$ in the collision model. The sampling data are obtained for the duration of around 400 non-dimensional time units (
 $d_p/u_c$) with the sampling interval being 10
 $d_p/u_c$, after the statistically steady state for the domain-averaged particle velocity is reached.
2.3. Filtering procedure
The goal of the present study is to analyse and model the local drag force for the filtered Euler–Euler approach with coarse fluid grids, based on interface-resolved simulation data. An efficient two-step filtering process (Capecelatro & Desjardins Reference Capecelatro and Desjardins2013) is employed. First of all, the Lagrangian particle variables are transferred onto Eulerian grids with a base cell size of  $\varDelta _b = d_p$ through a mollification kernel
 $g_{\mathcal {M}}(r)$ as
 \begin{equation} \left.\begin{array}{@{}c@{}} \displaystyle\phi = \sum_i^{{N_p}} {{g_{\mathcal{M}}}( {\boldsymbol{x} - {\boldsymbol{X}_i}} )V_p}, \\ \displaystyle{\boldsymbol{f}_p} = \sum_i^{{N_p}} {{g_{\mathcal{M}}}( {\boldsymbol{x} - {\boldsymbol{X}_i}} ){\boldsymbol{F}_i}}, \\ \displaystyle{\boldsymbol{u}_s} = \dfrac{1}{\phi}\sum_i^{{N_p}} {{g_{\mathcal{M}}}( {\boldsymbol{x} - {\boldsymbol{X}_i}} ){\boldsymbol{v}_i}}. \end{array}\right\} \end{equation}
Here,  $\phi$,
 $\boldsymbol {u}_s$ and
 $\boldsymbol {f}_p$ are the microscopic solid volume fraction, particle velocity and fluid–particle force per unit volume on the base grid. The mollification kernel
 $g_{\mathcal {M}}(r)$ is defined as
 \begin{equation} g_{\mathcal{M}}(r)=\frac{1}{\sigma \sqrt{2 {\rm \pi}}} \,{\rm e}^{-{r^2}/{2 \sigma^2}}, \end{equation}
where  $\sigma =\varDelta _b / 2 \sqrt {2 \ln 2}$ is the kernel width and
 $r$ is the distance between the particle and centre of the base cell. The resolved fluid variables are then coarsened to the base grid using the same mollification kernel (2.20) as
 \begin{equation} (1-\phi) {\boldsymbol{b}_{\mathcal{M}}}( {\boldsymbol{x}} ) = \iiint {\boldsymbol{b} {g_{\mathcal{M}}}} ( {{\boldsymbol{x}} - {\boldsymbol{x'}}} )\,{\rm{d}}\kern0.07em\boldsymbol{x'}. \end{equation}
Here  $\boldsymbol {b}$ is any quantity associated with the fluid phase at the DNS grid, while
 ${\boldsymbol {b}_{\mathcal {M}}}( {\boldsymbol {x}} )$ is the corresponding fluid variable coarsened to the base Eulerian grid.
Then, the Eulerian field at the base grid obtained from the first step is further filtered to obtain the filtered quantity at any given filtering length scale. The filtered solid volume fraction is computed by
 \begin{equation} \overline{{\phi}({\boldsymbol{x}},t)} = \iiint {\phi}( {{\boldsymbol{x'}},t} )G ( {{\boldsymbol{x}} - {\boldsymbol{x'}}} )\,{\rm{d}}\kern0.07em\boldsymbol{x'}, \end{equation}
where  $G ( {{\boldsymbol {x}} - {\boldsymbol {x'}}} )$ is a filter kernel that satisfies
 $\iiint G ( {{\boldsymbol {x}}} )\,\textrm {{d}}V = 1$ and a top-hat filter kernel is employed in this study. Due to the limitation of domain thickness in this work, we use a pseudo-two-dimensional (pseudo-2-D) filtering cell: the length of which along the limited direction (
 $y$ direction) is kept to be
 $L_y$ and the width of the filter cell in both remaining directions is
 $\varDelta _f$.
The filtered fluid and particle velocities are defined as
 $$\begin{gather} \widetilde{{{\boldsymbol{u}}_f}( {{\boldsymbol{x}},t} )} = \frac{1}{1-{\overline{{\phi}( {{\boldsymbol{x}},t} )} }}\iiint (1-{\phi} ( {{\boldsymbol{x'}},t} )){{\boldsymbol{u}}_f}( {{\boldsymbol{x'}},t} )G( {{\boldsymbol{x}} - {\boldsymbol{x'}}} )\,{\rm{d}}\kern0.07em{\boldsymbol{x'}}, \end{gather}$$
 $$\begin{gather}\widetilde{{{\boldsymbol{u}_s}}( {{\boldsymbol{x}},t} )} = \frac{1}{{\overline{{\phi}( {{\boldsymbol{x}},t} )} }}\iiint {\phi}( {{\boldsymbol{x'}},t} ){{\boldsymbol{u}}_s}( {{\boldsymbol{x'}},t} )G( {{\boldsymbol{x}} - {\boldsymbol{x'}}} )\,{\rm{d}}\kern0.07em{\boldsymbol{x'}}. \end{gather}$$
The filtered fluid–particle force is defined as
 \begin{equation} \overline{{\boldsymbol{f}}({\boldsymbol{x}},t)} = \iiint {\boldsymbol{f}_p}( {{\boldsymbol{x'}},t} )G ( {{\boldsymbol{x}} - {\boldsymbol{x'}}} )\,{\rm{d}}\kern0.07em\boldsymbol{x'}. \end{equation}
The pressure gradient force is excluded from the total hydrodynamic force, and the filtered fluid–particle force  $\bar {\boldsymbol {f}}$ includes the drag force
 $\overline {\boldsymbol {f}_d}$, lift force
 $\overline {\boldsymbol {f}_l}$, added-mass force
 $\overline {\boldsymbol {f}_{am}}$ and history force
 $\overline {\boldsymbol {f}_{bs}}$. The lift force can be neglected for the sedimentation system. The added-mass and history forces depend on the relative acceleration between the particle and the undisturbed flow. From a scaling analysis, Ling, Parmar & Balachandar (Reference Ling, Parmar and Balachandar2013) demonstrated that the added-mass and history forces are not important compared with the drag force for a large particle-to-fluid density ratio, and therefore, the added-mass and history forces are neglected in this work. For the homogeneous case when the density ratio is 2, the unsteady forces may be important for the instantaneous hydrodynamic force, however, only the average drag is studied for the homogeneous case and the contribution of the unsteady forces to the average drag should be unimportant, since the acceleration and deceleration of particles largely cancel each other after averaging.
We note that it is volume averaging (denoted by ‘ $\bar {X}$’) for the solid volume fraction and the drag force, whereas it is phase averaging(weighted with the volume fraction and denoted by ‘
 $\tilde {X}$’) for the fluid and solid velocities. The phase averaging was also called Favre averaging in some previous works (Rubinstein et al. Reference Rubinstein, Ozel, Yin, Derksen and Sundaresan2017; Liu et al. Reference Liu, Ge and Wang2020; Zhao et al. Reference Zhao, Chen and Zhou2021).
We define the force parallel to the filtered slip velocity as drag force and a dimensionless filtered drag force (actually drag correction coefficient) as
 \begin{equation} F = \frac{{( {{V_p}/\bar \phi } )\bar{\boldsymbol{f}} \boldsymbol{\cdot} \widetilde{{{\boldsymbol{u}}_{slip}}}}}{{3{\rm \pi} \mu {d_p} \widetilde{{{\boldsymbol{u}}_{slip}}} \boldsymbol{\cdot} \widetilde{{{\boldsymbol{u}}_{slip}}}}}, \end{equation}
where  $\widetilde {\boldsymbol {u}_{slip}}=\widetilde {\boldsymbol {u}_{f}}-\widetilde {\boldsymbol {u}_{s}}$ is the filtered slip velocity and a filtered Reynolds number based on the magnitude of the filtered slip velocity between the two phases is defined as
 \begin{equation} \widetilde{Re_m} = \frac{{(1 - \bar \phi )| { \widetilde{{{\boldsymbol{u}}_{slip}}}} |{d_p}}}{\nu }. \end{equation}
We note that the filter procedure is almost equivalent to the one employed in the post-process of both interface-resolved simulations (Rubinstein et al. Reference Rubinstein, Ozel, Yin, Derksen and Sundaresan2017; Liu et al. Reference Liu, Ge and Wang2020; Zhao et al. Reference Zhao, Chen and Zhou2021) and DEM-CFD simulations (Ozel et al. Reference Ozel, Gu, Milioli, Kolehmainen and Sundaresan2017). Figure 2 shows the instantaneous filtered fields of case 3 with  $\varDelta _f/d_p=8$ in a 2-D plane.
Snapshots of the filtered variable field along a slice obtained for case 3 and  $\varDelta _f/d_p = 8$ for (a) the particle volume fraction
 $\bar \phi$; (b) the non-dimensionalized vertical fluid velocity
 $\widetilde {{{u}_{f,1}}}/{u_t}$; (c) the non-dimensionalized vertical particle velocity
 $\widetilde {{{u}_{s,1}}}/{u_t}$; (d) the non-dimensionalized vertical slip velocity
 $\widetilde {{{u}_{slip,1}}}/{u_t}$.

To put domain-averaged analysis into context, we employ an averaging operator  $\langle {( {\cdot } )} \rangle$ throughout this work to denote a time averaging and spatial filtering over the entire time and space, which is not a function of either the spatial coordinate or time.
3. Results and discussion
The drag models obtained from small-scale systems with an homogeneous and isotropic microstructure are usually referred to as microscopic drag models. Some microscopic models are summarized in table 2, which can typically be expressed as functions of the microscopic solid volume fraction  $\phi$ and microscopic Reynolds number
 ${Re_m}$ that is defined as
 $Re_m = (1 - \phi )u_{slip}{d_p}/\nu$, where
 $u_{slip}$ represents the phase-averaged velocity difference (i.e. slip velocity).
Some previous drag correlations for the homogeneous system.

In figure 3 the conditionally averaged dimensionless drag force is plotted as a function of  $\varDelta _f/d_p$ at
 $(\bar \phi, \widetilde {Re_m})= (0.1,3)$ and
 $(0.1,15)$ for both inhomogeneous (cases 1 to 5) and homogeneous (cases H1 and H2) cases in table 1. The drag force
 $F$ is computed using a range of filter sizes (
 $\varDelta _f/d_p$ from 4 to 40) and bin averaged with both
 $\bar \phi$ and
 $\widetilde {Re_m}$. From figure 3, the averaged dimensionless drags for inhomogeneous flows (
 $\rho _r = 100$) and homogeneous flows (
 $\rho _r = 2$) are close to each other at a small filter size of
 $\varDelta _f = 4d_p$. There is a roughly 30 % reduction in averaged dimensionless drag at both
 $\widetilde {Re_m}=3$ and 15 when the filter size increases to
 $20d_p$ for the inhomogeneous flows, while the averaged
 $F$ is independent of the filter size for the homogeneous flows. The standard deviations of
 $F$ shown by error bars indicate that the fluctuations in
 $F$ at the same
 $\bar \phi$ and
 $\widetilde {Re_m}$ are much larger in the inhomogeneous systems. Thus, the homogeneous drag correlations are insufficient for capturing the actual drag in the inhomogeneous particle-laden flows and further drag correction is necessary. By comparing the microscopic drag models in table 2, the model of Xia et al. (Reference Xia, Yu, Lin and Guo2022a) agrees best with our results of the homogeneous cases, therefore, we take the microscopic model of Xia et al. (Reference Xia, Yu, Lin and Guo2022a) as the microscopic drag model in our work for further modelling of the filtered drag force.
Averaged dimensionless drag force  $F$ as a function of normalized filter sizes
 $\varDelta _f/d_p$, at
 $\widetilde {Re_m} = 3$, 15 and
 $\bar \phi = 0.1$. The error bars are given by measuring the standard deviation from the bin-averaged dimensionless drag force.

The variation of average drag force with filter size may be related to the size of the particle cluster, which can be quantified by the pair distribution function  $P(\boldsymbol {r})$. Due to the pseudo-2D particle cluster, we calculate the pair distribution function in a 2-D plane. In the cylindrical coordinate frame,
 $P(\boldsymbol {r})$ is defined as
 \begin{equation} P(\boldsymbol{r})=P(r, \theta)=\frac{H(r, \theta)}{n t_s \Delta S}, \end{equation}
where  $r$ is the distance from the centre of a reference particle to the centre of a neighbouring particle,
 $\theta$ is the polar angle (measured from the positive
 $x$ axis),
 $H(r,\theta )$ is the histogram of particle pairs,
 $\Delta S=r\Delta r \Delta \theta$ is the area of the sampling bin,
 $n$ is the average particle number density in the plane and
 $t_s$ is the total number of sampling points. By averaging
 $P(r,\theta )$ over
 $\theta$, one obtains the radial distribution function
 $g(r)$.
The specific goal here is to identify the cluster structure. Figure 4(a) shows the radial distribution functions  $g(r)$ as a function of normalized interparticle distance
 $r/d_p$. It is observed that
 $g(r)$ is greater than unity for
 $r/d_p < 20$ for clustered flows, whereas it becomes much more uniform for the cases of
 $\rho _r = 2$. In figure 4(b,c) the pair distribution function in the
 $x$ and
 $z$ directions are plotted respectively, and figure 4(d) shows the particle pair distributions for both the inhomogeneous and homogeneous systems. The relatively strong anisotropy in
 $P(r,\theta )$ is observed at a relatively small
 $Ga$ of 10 and
 $\rho _r=100$, and the anisotropy weakens as
 $Ga$ increases. The results in figure 4 show that the size of the clusters in the horizontal direction characterized by
 $P(r,0)>1$ is around
 $20d_p$ for all cases of clustered flows, corresponding to the filter size beyond which the average drag force does not change much, as shown in figure 3. From our results, the saturation in the average drag is correlated with the size of the clusters in the horizontal direction; however, further studies are needed to confirm this correlation.
Radial distribution function  $g(r)$ and pair distribution function
 $P(r,\theta )$ for cases of
 $\langle \phi \rangle = 0.1$.

The filtered drag force in coarse cells can be corrected from the microscopic drag force  $F_{mic}$ for the homogeneous system at the same filtered solid volume fraction and filtered Reynolds number by introducing a correction function or the mesoscale index
 $H$ (Igci & Sundaresan Reference Igci and Sundaresan2011; Milioli et al. Reference Milioli, Milioli, Holloway, Agrawal and Sundaresan2013; Sarkar et al. Reference Sarkar, Milioli, Ozarkar, Li, Sun and Sundaresan2016; Schneiderbauer Reference Schneiderbauer2017), i.e.
 \begin{equation} F = ( {1 + H} ){F_{mic}}, \end{equation}
namely,
 \begin{equation} H=\frac{F-F_{mic}(\bar{\phi}, \widetilde{R e_m})}{F_{mic}(\bar{\phi}, \widetilde{R e_m})}. \end{equation}
The mesoscale correction  $H$ is the ultimate closure that is required for the filtered drag force in the present study.
3.1. Effects of subgrid quantities on filtered drag
The drift velocity and variance of the solid volume fraction were found to be key subgrid quantities due to their ability to capture subgrid-scale structures (Parmentier et al. Reference Parmentier, Simonin and Delsart2012; Ozel et al. Reference Ozel, Fede and Simonin2013). The drift velocity is defined as
 \begin{equation} {{\boldsymbol{u}}_{drift}} = {( {\widetilde{{{\boldsymbol{u}}_f}}})_p} - { {\widetilde{{{\boldsymbol{u}}_f}}}}, \end{equation}
where  $(\widetilde {\boldsymbol {u}_f})_p = \overline {\phi {\boldsymbol {u}_f}} /\bar {\phi }$ denotes the filtered fluid velocity seen by the particles. The variance of the solid volume fraction is defined as
 \begin{equation} \overline {{{( {\phi '} )}^2}} = \overline {{\phi^2}} - {\bar \phi^2}. \end{equation}
The effect of subgrid quantities on the filtered drag can be derived via a series expansion to the microscopic drag force (Schneiderbauer Reference Schneiderbauer2017; Chen et al. Reference Chen, Song, Jiang and Zhou2020). The drift velocity and variance of the solids volume fraction were identified as crucial factors for the drag force modification in filtered two-fluid simulations.
A scaled drift flux is defined as the normalized component of the drift flux in the direction of the slip velocity (Rubinstein et al. Reference Rubinstein, Ozel, Yin, Derksen and Sundaresan2017):
 \begin{equation} {v_d} = \frac{{( {\bar \phi {u_{drift,\beta }}} ) \widetilde{{u_{slip,\beta }}}}}{{\widetilde{{u_{slip,\beta }}} \widetilde{{u_{slip,\beta }}}}}. \end{equation}
Following the work of Ozel et al. (Reference Ozel, Gu, Milioli, Kolehmainen and Sundaresan2017), a scaled variance of the solid volume fraction  $\overline {{{( {\phi '} )}^2}} /\bar \phi ( {1 - \bar \phi } )$ is employed as a second marker in the drag closure.
The conditionally averaged mesoscale correction  $H$ obtained from the IR-DNS data as a function of the scaled drift flux and variance of the solid volume fraction for
 $\varDelta _f/d_p = 24$ is shown in figure 5. The results in figure 5(a) show that
 $H$ has a strong positive correlation with the normalized drift velocity and is affected by the scaled variance of the solid volume fraction. From figure 5(b),
 $H$ increases with increasing scaled variance of the solid volume fraction, being consistent with the previous observations of Ozel et al. (Reference Ozel, Gu, Milioli, Kolehmainen and Sundaresan2017). For a large drift velocity,
 $H$ is largely independent of the fluctuation of the solid volume fraction. For a typical coarse grid, the ratio between the filtered drag force and microscale drag force (i.e.
 $1+H$) is in the range of 0 to 2. Such a result suggests that the combination of scaled drift flux and variance of the solid volume fraction provides a significant mesoscale drag correction.
Variation of the averaged mesoscale correction  $H$ with (a) the scaled drift flux
 $v_d/\bar \phi$, (b) the scaled variance of the solid volume fraction
 $\overline {{{( {\phi '} )}^2}} /\bar \phi ( {1 - \bar \phi } )$ at
 $\varDelta _f/d_p = 24$ for cases 1–5. The symbols represent the results obtained from our simulations and the lines denote the fitting function in (3.7).

3.2. Modelling the mesoscale correction coefficient
According to the observation in figure 5, we employ a function given as
 \begin{align} H &= f\left( {\frac{{{v_d}}}{{\bar \phi }},\frac{{\overline {{{( {\phi '} )}^2}} }}{{\bar \phi ( {1 - \bar \phi } )}}} \right)\nonumber\\ & = \frac{v_d}{\bar{\phi}}+A \frac{\overline{(\phi^{\prime})^2}}{\bar{\phi}(1-\bar{\phi})}\left(\frac{v_d}{\bar{\phi}}+1\right)^2\nonumber\\ &\quad +B\left(\frac{\overline{(\phi^{\prime})^2}}{ \bar{\phi}(1-\bar{\phi})}\right)^2\left(\frac{v_d}{\bar{\phi}}+1\right)+C \frac{\overline{(\phi^{\prime})^2}}{\bar{\phi}(1- \bar{\phi})}\left(\frac{v_d}{\bar{\phi}}+1\right). \end{align}
If we set  $A=B=C=0$, the simplest approximation of
 $H$ in terms of the scaled drift flux (Parmentier et al. Reference Parmentier, Simonin and Delsart2012) is given by
 \begin{equation} H_{{Par}}=\frac{v_d}{\bar{\phi}}. \end{equation}
The model of Ozel et al. (Reference Ozel, Gu, Milioli, Kolehmainen and Sundaresan2017) can be obtained if  $A=B=0$ and
 $C=2.25\pm 0.5$ as
 \begin{equation} H_{{Ozel}}=\frac{v_d}{\bar{\phi}}+C\frac{\overline{(\phi^{\prime})^2}}{\bar{\phi}(1-\bar{\phi})} \left(\frac{v_d}{\bar{\phi}}+1\right). \end{equation}
In the present study, the constants are obtained by fitting the data from cases 1 to 5 in table 1 at various filter sizes. Figure 6 shows that all constants are independent of filter size for  $\varDelta _f/d_p > 12$. We note that
 $H$ is insensitive to the coefficients at small filter sizes, with the dependence of drag force on the filter size being hidden in the subgrid quantities. We just employ
 $A = 7.3$,
 $B= 25.4$,
 $C = -3.3$ for all filter sizes and the corresponding mesoscale correction coefficient is denoted as
 $H_{{Present}}$.
Model coefficients  $A$,
 $B$ and
 $C$ in (3.7) as a function of filter size.

We first assess the accuracy of the proposed filtered drag model by parity plots between the exact drag force from the IR-DNS data and the predicted drag force using (3.2) and (3.7). The results in figure 7 show that the drag model with actual drift velocity and variance of the solid volume fraction computed from the IR-DNS data has a good performance in drag prediction.
The parity plots between the exact and predicted drag force  $F$ for (a)
 $\varDelta _f/d_p = 12$, (b)
 $\varDelta _f/d_p = 20$, (c)
 $\varDelta _f/d_p = 28$, (d)
 $\varDelta _f/d_p = 36$.

To further quantify the statistical error of the models, we define the relative error between the exact values and the predicted values as
 \begin{equation} {e}(y;\hat y) = \frac{{{{\hat y}_i} - {y_i}}}{{{y_i}}}, \end{equation}
where  $y$ and
 $\hat y$ are the exact and predicted data, respectively. The Pearson correlation coefficient
 $r$ between the exact value obtained from IR-DNS and that predicted by the proposed model is calculated to quantify the performance of the proposed model. The Pearson correlation coefficient is defined as
 \begin{equation} r(x ; y)=\frac{\displaystyle\sum_{i=1}^n(x_i-\bar{x})(y_i-\bar{y})}{\displaystyle\sqrt{\sum_{i=1}^n(x_i-\bar{x})^2} \sqrt{\sum_{i=1}^n(y_i-\bar{y})^2}}, \end{equation}
with  $x$ and
 $y$ being two sets of data, and
 $\bar {x}$ and
 $\bar {y}$ being their mean values. Higher
 $r(x;y)$ indicates a better linear correlation between two datasets. In Appendix B we evaluate the drag models by computing the probability distribution functions (p.d.f.s) of the relative error and Pearson correlation coefficients between the drag force obtained from mesoscale models and the homogeneous model of Xia et al. (Reference Xia, Yu, Pan, Lin and Guo2022b) and the exact forces obtained from the IR-DNS. The results indicate that our new correction yields the highest correlation coefficients.
The subgrid-quantity-dependent filtered drag correlation (3.7) may be affected by the computational domain size. In Appendix C we have studied the effect of domain size on the drag prediction and demonstrated that the present filtered drag model with actual subgrid quantities is applicable to different domain sizes.
3.3. Priori analysis for subgrid-scale quantities
3.3.1. Existing subgrid closures
In the two-fluid model the actual subgrid drift velocity  $\boldsymbol {u}_{drift}$ and variance of the solid volume fraction
 ${\overline {{{( {\phi '} )}^2}}}$ are not available and need to be modelled. One classical closure approach for the subgrid quantities is the dynamic scale-similarity model (Parmentier et al. Reference Parmentier, Simonin and Delsart2012; Rubinstein et al. Reference Rubinstein, Ozel, Yin, Derksen and Sundaresan2017), which approximates the subgrid quantities via available information at or above the filter grid length scale. Figure 8 shows the conditionally averaged drift flux
 $v_d$ and variance of the solid volume fraction
 $\overline {{{( {\phi '} )}^2}}$ as a function of
 ${\bar \phi /{\phi _{max}}}$ with
 ${\phi _{max}}=0.64$. The results show that the profiles of
 $v_d$ and
 $\overline {{{( {\phi '} )}^2}}$ are similar, and they can be modelled as a function of the filter solid volume fraction and filter size.
Averaged (a) drift flux  $v_d$ and (b) variance of the solid volume fraction
 $\overline {{{( {\phi '} )}^2}}$ as a function of the normalized filtered solid volume fraction
 ${\bar \phi /{\phi _{max}}}$ with
 ${\phi _{max}}=0.64$ for various filter sizes. The symbols correspond to results from the interface-resolved simulations and the lines correspond to the predictions of (3.12)–(3.15) with
 $\kappa _1=\kappa _2=1$.

Following the work of Rubinstein et al. (Reference Rubinstein, Ozel, Yin, Derksen and Sundaresan2017), the scale-similar forms for the drift flux and variance of the solid volume fraction are assumed to be
 $$\begin{gather} \bar \phi {u^{{Rub}}_{drift,\beta }} = {\kappa_{1}}{h_1}( {\bar \phi /{\phi_{max}} } ){f_1}( {{\varDelta_f/d_p}} )\widetilde{{u_{slip,\beta }}}, \end{gather}$$
 $$\begin{gather}{\overline {{{( {\phi '} )}^2}}}^{{Rub}} = {\kappa_2}{h_2}( {\bar \phi /{\phi_{max}}} ){f_2}( {{\varDelta_f/d_p}} ). \end{gather}$$
The functions  ${h}_i( {\bar \phi /{\phi _{max}} } )$ and
 $f_i( {{\varDelta _f/d_p}} )$ with
 $i=1,2$ have the following forms:
 $$\begin{gather} h_i( {\bar \phi /{\phi_{max}}} ) = {( {\bar \phi /{\phi_{max}}} )^{n_i}}{( {1 - \bar \phi /{\phi_{max}}})^{m_i}}, \end{gather}$$
 $$\begin{gather}f_i( {{\varDelta_f/d_p}} ) = \frac{{{(\varDelta_f/d_p})^2}}{{k_i + {(\varDelta_f/d_p)^2}}}. \end{gather}$$
Based on our data from the simulations in table 1, we obtain  $m_1 = 4.84$,
 $n_1 = 2.59$,
 $m_2 = 4.88$,
 $n_2 = 2.32$,
 $k_1 = 235.5$ and
 $k_2 = 269.7$. We note that the model constants
 $\kappa _1$ and
 $\kappa _2$ are computed dynamically through the surrounding resolved flow field (see Rubinstein et al. Reference Rubinstein, Ozel, Yin, Derksen and Sundaresan2017 for details). From figure 8, the above model can predict very well the averaged drift velocity
 $v_d$ and variance of the solid volume fraction
 $\overline {{{( {\phi '} )}^2}}$ for a given particle volume fraction and a given filter size, simply with
 $\kappa _1=\kappa _2=1$.
Another widely used closure for the subgrid quantities is the gradient approach based on a Taylor expansion (Ozel et al. Reference Ozel, Fede and Simonin2013) as
 $$\begin{gather} {\bar \phi u^{{Grad}}_{drift,\beta }} = {D}\varDelta_f^2\frac{{\partial \bar \phi }}{{\partial {x_j}}}\frac{{\partial \widetilde{{u_{f,\beta }}}}}{{\partial {x_j}}}, \end{gather}$$
 $$\begin{gather}{\overline {{{( {\phi '} )}^2}}}^{{Grad}} = E{\varDelta_f^2}\frac{{\partial \bar \phi }}{{\partial {x_j}}}\frac{{\partial \bar \phi }}{{\partial {x_j}}}, \end{gather}$$
where  $D$ and
 $E$ are the model coefficients that can be determined from a linear regression of the IR-DNS data. It should be noted that the local gradient in the filtered particle volume fraction and fluid velocity used in the gradient-based models can be computed at different scales using the IR-DNS data. In this study, all gradient values are computed at both fine-grid (i.e. particle-size) and coarse-grid (i.e. filter-size) scales using the second-order central difference scheme, as shown in figure 9. We use the superscripts ‘fine’ and ‘coarse’ to denote fine-grid (particle-size) and coarse-grid (filter-size) scale discretization on the computation of gradient quantities, respectively.
Schemes for the computation of the gradient of filtered quantities by the central difference scheme. (a) Fine-grid (i.e. particle-size) scale discretization, (b) coarse-grid (i.e. filter-size) scale discretization.

Figure 10 shows the average drift flux  $v_d$ and variance of the solid volume fraction
 ${\overline {{{( {\phi '} )}^2}}}$ as a function of
 $G_{v_d}$ and
 $G_{{\overline {{{( {\phi '} )}^2}}}}$, which are defined by
 \begin{equation} G_{v_d} = { \varDelta_f^2}\frac{{\partial \bar \phi }}{{\partial {x_j}}}\frac{{\partial \widetilde{u_{f,\beta }}}}{{\partial {x_j}}}\frac{{ \widetilde{u_{slip,\beta }}}}{{\widetilde{u_{slip,\beta }} \widetilde{u_{slip,\beta }}}}\quad {\rm{and}}\quad G_{{\overline {{{( {\phi '} )}^2}}}} = \varDelta_f^2 \frac{{\partial \bar \phi }}{{\partial {x_j}}}\frac{{\partial \bar \phi }}{{\partial {x_j}}}. \end{equation}
The gradient model ((3.16)–(3.17)) can be written as  $v^{{Grad}}_d = D G_{v_d}$ and
 ${\overline {{{( {\phi '} )}^2}}}^{{Grad}} = E G_{{\overline {{{( {\phi '} )}^2}}}}$. The results in figure 10 indicate a robust positive correlation between the averaged drift flux
 $v_d$ (or variance of the solid volume fraction
 ${\overline {{{( {\phi '} )}^2}}}$) with
 $G_{v_d}$ (or
 $G_{{\overline {{{( {\phi '} )}^2}}}}$). The subgrid-scale quantities can be effectively modelled using the closures (3.16)–(3.17). The model coefficients mainly depend on the filter size. Explicit functions are obtained by data fitting as
 \begin{equation} \left.\begin{array}{@{}c@{}} D_{{fine}} ={-} 0.094 + 0.23\exp ( { 0.023{\varDelta_f}/{d_p}} ), \\ D_{{coarse}} ={-} 0.094 + 0.04\exp ( { 0.14{\varDelta_f}/{d_p}} ), \\ E_{{fine}} = 0.27 + 0.07\exp ( { 0.048{\varDelta_f}/{d_p}} ),\\ E_{{coarse}} ={-}0.75 + 0.93\exp ( { 0.055{\varDelta_f}/{d_p}} ). \end{array}\right\} \end{equation}
The model coefficients increase with increasing filter size and are larger than the theoretical value of 1/12 derived by Taylor expansion (Parmentier et al. Reference Parmentier, Simonin and Delsart2012), especially for the coarse-grid scale.
Averaged (a,b) drift flux  $v_d$ and (c,d) variance of the solid volume fraction
 $\overline {{{( {\phi '} )}^2}}$ as a function of
 $G_{v_d}$ or
 $G_{{\overline {{{( {\phi '} )}^2}}}}$ for various filter sizes, using (a,c) the fine grid (particle size) and (b,d) the coarse grid (filter size) for the gradient computation.

The drift velocity can also be expressed as a function of the covariance of the solid volume fraction and the fluid-phase velocity (Cloete et al. Reference Cloete, Cloete, Radl and Amini2019), which can be further modelled as a function of the filtered fluid-phase velocity fluctuation and the variance of the solid volume fraction (Schneiderbauer Reference Schneiderbauer2017; Rauchenzauner & Schneiderbauer Reference Rauchenzauner and Schneiderbauer2020) as
 \begin{equation} {\bar \phi u^{{Sch}}_{drift,\beta }} = {\zeta_\phi }\frac{{\sqrt {2{k_{f,\beta }}\overline {{({\phi '}^2)}} } }}{{ {1 - \bar \phi }}}. \end{equation}
In the above equation,  $2{k_{f,\beta }} = \widetilde {{u'_\beta }{u'_\beta }}$ is the Reynolds normal stress (here no summation for
 ${\beta }$). The correlation coefficient
 ${\zeta _\phi }$ can be obtained via data fitting or dynamically computing (Rauchenzauner & Schneiderbauer Reference Rauchenzauner and Schneiderbauer2020). In the work of Schneiderbauer (Reference Schneiderbauer2017), an algebraic expression for
 $\overline {({{\phi '}^2})}$ is derived as
 \begin{equation} {\overline {{{( {\phi '} )}^2}}}^{{Sch}} = \frac{{8\xi_\phi^2{k_f}}}{{{{\left( {\dfrac{{\partial \widetilde{{u_{f,k}}}}}{{\partial {x_k}}} + {C_\phi }{C_\varepsilon }\dfrac{{k_f^{1/2}}}{{{l_{mf}}}}} \right)}^2}}}\frac{{\partial \bar \phi }}{{\partial {x_i}}}\frac{{\partial \bar \phi }}{{\partial {x_i}}}, \end{equation}
where  $l_{mf}=C_\nu \varDelta _f$ denotes the mixing length of the fluid phase;
 $C_\phi = 0.4$,
 $C_\nu = 0.4$ and
 $C_\varepsilon = 1$ are model constants suggested by Schneiderbauer (Reference Schneiderbauer2017). We note that (3.21) can be regarded as a gradient-based model for the variance of the solid volume fraction. Explicit functions for the coefficients
 $\xi _\phi$ and
 $\zeta _\phi$ appearing in (3.20) and (3.21) are obtained by data fitting:
 \begin{equation} \left.\begin{array}{@{}c@{}} \zeta_\phi ={-} 0.43 + 0.26\exp ( { - 0.09{\varDelta_f}/{d_p}}), \\ \xi_{\phi,{fine}} = 0.48+0.1 \exp ( { 0.024{\varDelta_f}/{d_p}}), \\ \xi_{\phi,{coarse}} ={-}1.14+1.83 \exp ( { 0.02{\varDelta_f}/{d_p}}). \end{array}\right\} \end{equation}
As shown in figure 11, the function (3.20) is a good approximation of the drift flux. The coefficient  $\zeta _\phi$ is found to be negative, with its magnitude reaching up to 0.43 as the filter size increases.


The performance of existing models for subgrid quantities is evaluated in Appendix B, which shows that the model proposed by Schneiderbauer (Reference Schneiderbauer2017) for the drift velocity is desirable at relatively large filter sizes, while the gradient model yields the lowest correlation coefficient at large filter sizes with coarse-grid discretization.
One drawback of the gradient model is that when the gradient of the particle volume fraction is close to zero, it predicts a very small  $| {v_d} |$ and
 ${\overline {{{( {\phi '} )}^2}}}$, but the actual
 $| {v_d} |$ and
 ${\overline {{{( {\phi '} )}^2}}}$ may not be so small, particularly at large filter sizes (see figure 10). In figure 12 we depict the conditionally averaged variance of the solid volume fraction
 $\overline {{{( {\phi '} )}^2}}$ as a function of
 ${\bar \phi /{\phi _{max}}}$ in the limit of
 $( {\partial \bar \phi /\partial {x_j}} )( {\partial \bar \phi /\partial {x_j}} ) \to 0$. Interestingly, the profiles of
 $\overline {{{( {\phi '} )}^2}}$ are similar to those for all gradients of the solid volume fraction shown in figure 8(b). Based on present simulation data, we propose the following model for the variance of the solid volume fraction
 $\overline {{{( {\phi '} )}^2}}$:
 \begin{equation} {\overline {{{( {\phi '})}^2}}}^{{Present}} = E'{\varDelta_f^2}\frac{{\partial \bar \phi }}{{\partial {x_j}}}\frac{{\partial \bar \phi }}{{\partial {x_j}}}+{( {\bar \phi /{\phi_{max}}} )^{{n_2}}}{( {1 - \bar \phi /{\phi_{max}}} )^{{m_2}}}\frac{{{{({\varDelta_f}/{d_p})}^2}}}{{{k_2} + {{({\varDelta_f}/{d_p})}^2}}}. \end{equation}
Here the values of  $n_2$,
 $m_2$,
 $k_2$ are the same as those in the scale-similarity model of Rubinstein et al. (Reference Rubinstein, Ozel, Yin, Derksen and Sundaresan2017) presented earlier (3.13), and
 $E' = 0.05+0.17 \exp ( { -0.05{\varDelta _f}/{d_p}} )$. The value of
 $E'$ is weakly dependent of filter size and close to the theoretical value 1/12 as derived from Taylor expansion (Parmentier et al. Reference Parmentier, Simonin and Delsart2012) for
 $\varDelta _f/d_p$ greater than 24. Note that the gradient of the solid volume fraction in our model above is calculated with the filter size (i.e. coarse grid). Our model for
 $\overline {{{( {\phi '} )}^2}}$ is essentially a combination of the gradient model and the scale-similarity model.
Averaged variance of the solid volume fraction  $\overline {{{( {\phi '} )}^2}}$ as a function of
 ${\bar \phi /{\phi _{max}}}$ with
 ${\phi _{max}}=0.64$ for various filter sizes when
 $( {\partial \bar \phi /\partial {x_j}} )( {\partial \bar \phi /\partial {x_j}} ) \to 0$. The symbols correspond to results from the interface-resolved simulations and the lines correspond to the predictions of
 $( {\bar \phi /{\phi _{max}}} )^{{n_2}}( {1 - \bar \phi /{\phi _{max}}} )^{{m_2}}({\varDelta _f}/{d_p})^2/[ {k_2} + {{({\varDelta _f}/{d_p})}^2} ]$.

Due to the great performance of the model of Schneiderbauer (Reference Schneiderbauer2017) for the prediction of the drift velocity, we choose this closure to compute the drift velocity:
 \begin{equation} {\bar \phi u^{{Present}}_{drift,\beta }} = {\zeta_\phi }\sqrt {2{k_{f,\beta }}{{\overline {({{\phi '}^2})} }^{{{Present}}}}} /( {1 - \bar \phi } ). \end{equation}
Here  $\overline {{{( {\phi '} )}^2}}$ is computed with (3.23).
Figure 13(a,b) presents the predictions of the drift velocity and the variance of the solid volume fraction using the present model (3.23)–(3.24) with a coarse-grid scale discretization at  $\varDelta _f/d_p = 20$. Figure 13(c,d) shows the relative error at different filter sizes. It can be seen that the predictions are in good agreement with the actual values and the performance of the model on the relative error is even better for a larger filter size.
Parity plots between the exact and predicted (a) drift flux  $v_d$ and (b) variance of the solid volume fraction
 $\overline {{{( {\phi '} )}^2}}$ for
 $\varDelta _f/d_p = 20$. Probability density functions of the relative error between the actual and predicted (c) drift flux
 $v_d$ and (d) variance of the solid volume fraction
 $\overline {{{( {\phi '} )}^2}}$ using model (3.23)–(3.24) at different filter sizes.

The predicted  $v_d$ and
 $\overline {{{( {\phi '} )}^2}}$ and the actual quantities conditionally averaged for
 $\bar \phi =0.1$ and 0.2 are compared in figure 14. The superscripts ‘fine’ and ‘coarse’ refer to fine-grid (particle-size) and coarse-grid (filter-size) scale discretization on the computation of gradient quantities, respectively, while ‘actual’ in the model of Schneiderbauer (Reference Schneiderbauer2017) indicates that the actual
 ${\overline {{{( {\phi '} )}^2}}}$ obtained from the interface-resolved simulations is employed. The results show that all mesoscale drag models can predict well the average
 $v_d$ and
 $\overline {{{( {\phi '} )}^2}}$ for different filter sizes and different solid volume fractions. The present subgrid closure agrees best with our DNS results. The error analysis in Appendix B shows that the present model exhibits a better performance on the correlation coefficient and relative error than the other models using the resolved quantities at a coarse-grid scale. In addition, our model can be utilized without dynamic adjustment of the model constant, unlike the dynamic scale-similarity model.
Comparison of  $v_d$ and
 $\overline {{{( {\phi '} )}^2}}$ averaged for the solid volume fraction (a,c)
 $\bar \phi = 0.1$ and (b,d)
 $\bar \phi = 0.2$. The lines correspond to the actual
 $v_d$ and
 $\overline {{{( {\phi '} )}^2}}$ from the interface-resolved simulations, and the symbols correspond to the predictions.

It is difficult to predict the subgrid quantities using the resolved filtered quantities at a coarse-grid scale accurately because the resolved filtered quantities are insufficient for intrinsically characterizing the feature of subgrid-scale heterogeneous structures. It is possible to improve the prediction of the subgrid quantities by using additional transport equations or developing neural-network-based models for the subgrid quantities (Zhang et al. Reference Zhang, Jiang, Chen, Yu and Zhou2020; Zhu et al. Reference Zhu, Ouyang, Lei and Luo2021), which is outside the scope of the present study.
3.3.2. Evaluation of filtered drag models with models for subgrid quantities
We have evaluated the performance of filtered drag models with the actual subgrid quantities as well as the closure models for the subgrid quantities. In this part, further assessment of the filtered drag models with the closures of subgrid quantities is conducted. A coarse grid is normally used in the simulations of industrial-scale particle-laden flows with the two-fluid model, therefore, we only consider the models using the filter size to compute the gradient, i.e. the ‘coarse’ gradient model.
We plot the conditionally averaged dimensionless drag force (both the actual drag and predicted drag) as a function of  $\varDelta _f/d_p$ at
 $(\bar \phi, \widetilde {Re_m}) = (0.1,15)$ and
 $(\bar \phi, \widetilde {Re_m}) = (0.2,2.0)$ in figure 15(a,b). The results show that all mesoscale drag models using the resolved filtered quantities at a coarse-grid scale can predict well the averaged drag and are superior to the homogeneous drag model. Figure 15(c,d) presents the comparisons between the predicted and actual drag forces at
 $\varDelta _f/d_p=16$ and
 $\varDelta _f/d_p=28$. Our model agrees best with our DNS results, although the improvement over the previous mesoscale drag models is not so significant.
Averaged dimensionless drag force  $F$ as a function of normalized filter sizes
 $\varDelta _f/d_p$ at (a)
 $(\bar \phi, \widetilde {Re_m}) = (0.1,15)$ and (b)
 $(\bar \phi, \widetilde {Re_m}) = (0.2,2.0)$. Predictions of the drag force
 $F$ from subgrid-quantity-dependent drag models at (c)
 $\varDelta _f/d_p = 16$ and (d)
 $\varDelta _f/d_p = 28$. The error bars are given by measuring the standard deviation from the bin-averaged dimensionless drag force. In (a) and (b) the green dashed lines represent the prediction of the homogeneous drag model of Xia et al. (Reference Xia, Yu, Lin and Guo2022a) and the black solid lines correspond to the exact
 $F$ from the interface-resolved simulations.

In Appendix D we further assess the filtered drag models for small fluidized beds and the results show that all mesoscale models are applicable to small-scale systems.
4. Concluding remarks
In the present work, we have investigated the mesoscale drag models for clustered particle-laden flows based on the data from large-scale interfaced-resolved simulations. The main conclusions are drawn as follows.
(i) For the homogeneous system, the filtered drag is independent of the filter size, whereas for the clustered particle-laden flows, the averaged drag becomes smaller than the homogeneous drag at the filter size above 4 particle diameters. The drag reduction saturates at the filter size being comparable to the cluster size in the horizontal direction in our simulations. The dimensionless averaged drag force decreases as the drift velocity decreases at the same variance of the solid volume fraction, or as the variance of the solid volume fraction decreases at the same drift velocity.
(ii) A new correlation (3.7) for the mesoscale drag correction is proposed as a function of the drift flux and the variance of the solid volume fraction, based on the modification of the existing correlations. The new correlation with the actual drift flux and variance of the solid volume fraction is in excellent agreement with the DNS results.
(iii) The existing models of the subgrid drift velocity and variance of the solid volume fraction have been assessed in an a priori manner. A new model for the variance of the solid volume fraction (3.23) is proposed by combining the gradient model and the scale-similarity model. The good performances of this model for the variance of the solid volume fraction (3.23) and the model of Schneiderbauer (Reference Schneiderbauer2017) for the drift velocity (3.24) with the variance of the solid volume fraction computed with our model have been demonstrated.
(iv) All mesoscale models considered (i.e. scale-similarity model, gradient model, Schneiderbauer model and our model) can predict well the filtered drag with comparable accuracy (our model is slightly better), and are superior to the homogeneous drag model for the inhomogeneous system.
In addition, in the appendices, we show that our correlation for the mesoscale drag correction using the actual subgrid quantities with the same parameter values is applicable to the different computational domain sizes. All mesoscale drag models can predict well the filtered drag and are superior to the homogeneous drag model for a small-scale system. Nevertheless, since the cluster structure in this small-scale fluidization system is significantly different from the large system studied, the values of the constants in the scale-similarity model need to be adjusted for better agreement with the DNS data. For the other models, the same parameter values obtained from the large-scale system are used for the small-scale system, and thus, this may be deemed as a posteriori evaluation. Nevertheless, more a posteriori evaluations are certainly necessary to fully evaluate the models. We plan to conduct further a posteriori tests by comparing to the experiments on the clustered particle-laden flows, after the complete filtered two-fluid models (including the turbulence models and particle stress models) are established.
We believe that the present study provides important insights on the modelling of the drag force of the clustered particle-laden flows and the new model is a useful complement to existing mesoscale drag models.
In the present work we were only concerned with the effects of particle distribution heterogeneity on the drag, but the effects of heterogeneity on particle collision stress and Reynolds stresses are also important for the accurate simulation of clustered particle-laden flows, which are good subjects of future studies.
Funding
The work was supported by the National Natural Science Foundation of China (grant nos 12332015, 12302340 and 12072319), and the Natural Science Foundation of Zhejiang Province (LZ23A020006).
Declaration of interests
The authors report no conflict of interest.
Appendix A. Numerical validations
The accuracy of our DF/FD method for various particle-laden flows has been validated in our previous works (Yu & Shao Reference Yu and Shao2007; Yu et al. Reference Yu, Lin, Shao and Wang2016; Xia et al. Reference Xia, Yu, Pan, Lin and Guo2022b). For example, Xia et al. (Reference Xia, Yu, Pan, Lin and Guo2022b) demonstrated that the drag for a settling sphere and the average drag for the flow past a fixed bed of randomly distributed spheres at  $\langle \phi \rangle )=0.1$ could be computed with reasonable accuracy using
 $d_p / \Delta x=12.8$. Here, we provide further validations on the sedimentation of dense suspensions. As proposed by Yu & Shao (Reference Yu and Shao2007), the Lagrangian points are retracted slightly from the particle surface in order to improve the accuracy of the prediction of the drag force on the particles. We first conduct a mesh convergence test for sedimentation of particles in a periodic domain of
 $[ {20{d_p},10{d_p},10{d_p}} ]$ with different retraction distances. Then, we compare the normalized drag force obtained from our simulation for a simple cubic (SC) arrangement of spheres to other results in literature.
A.1. Mesh dependence for suspension
Table 3 displays the dependence of drag force on the retraction distance  $\Delta h$ for two typical cases:
 $(Ga, \langle \phi \rangle )=(10,0.1)$ and
 $(Ga, \langle \phi \rangle )=(50,0.3)$. The relative errors
 $\varepsilon _F$ are evaluated with the reference data for
 $d_p / \Delta x=51.2$ and
 $\Delta h / \Delta x=0.5$. Our numerical tests indicate that a slight retraction of Lagrangian points can reduce the grid dependence of the drag force. The optimal retraction distance is case dependent and our numerical tests show that the computed drag force is weakly dependent on the grid resolution for
 $\Delta h = 0.5\Delta x$, which is therefore chosen in the present study. For
 $\Delta h = 0.5\Delta x$, the relative error between the average drags for
 $d_p / \Delta x=51.2$ and 12.8 is around 2
 $\%$ in case of
 $(Ga, \langle \phi \rangle )=(10,0.1)$ and around 6
 $\%$ in case of
 $(Ga, \langle \phi \rangle )=(50,0.3)$, respectively. Considering that for our large-scale simulations the maximum
 $Ga$ is 50 and the maximum
 $\langle \phi \rangle )$ is 0.2, the relative error would be less than 6
 $\%$ for most simulation cases. As pointed out by Wang (Reference Wang2020), the drags predicted from the different correlations in literature can differ by orders in magnitude, and thus, we think that the accuracy for
 $d_p / \Delta x=12.8$ with
 $\Delta h = 0.5\Delta x$ is acceptable, which is much better than that for
 $d_p / \Delta x=25.6$ without retraction of the Lagrangian points. In addition, we find that the drag computed with
 $d_p / \Delta x=12.8$ with
 $\Delta h = 0.5\Delta x$ is always overestimated compared with the fine-mesh results for the cases here and our previous simulations for high particle Reynolds numbers or high particle volume fractions, therefore, the computational error for the difference between the drags for the homogeneous and inhomogeneous cases can be reduced.
Effects of grid resolution and retraction distance on the domain-averaged drag  $\langle F \rangle$. The relative errors
 $\varepsilon _F$ are evaluated with the reference data for
 $d_p / \Delta x=51.2$ and
 $\Delta h / \Delta x=0.5$.

Besides the accuracy for the drag force, it is also important to verify that the grid resolution is adequate for capturing the fluid-phase statistics. The two-point autocorrelation function for the vertical component of the fluid fluctuating velocity as a function of the vertical separation distance can be computed from
 \begin{equation} {R_{uu}}( {{r_x}} ) = \frac{{\langle {\overline {u'(x,y,z,t)u'( {x + {r_x},y,z,t} )} } \rangle }}{{\langle {\overline {u'{{(x,y,z,t)}^2}} } \rangle }}, \end{equation}
where the angle bracket  $\langle {\cdot } \rangle$ represents time averaging and the overbar denotes spatial averaging, excluding grid points lying in the solid domain. Figure 16 shows the fluid-phase velocity autocorrelation functions for different grid resolutions with
 $\Delta h/\Delta x = 0.5$. It can be seen that the results are mesh-size independent for
 $d_p / \Delta x=12.8-51.2$. Limited by our computational resource, the mesh resolution of
 $d_p/\Delta x=12.8$ is chosen for our large-scale simulations.
Convergence of the fluid-phase velocity autocorrelation function with the grid resolution.

A.2. Drag force for SC arrangement of spheres
We then validate the accuracy of our method via the normalized drag force acting on a sphere for SC arrangement by comparing our results to independent data in the literature. The flow over a SC arrangement of spheres is simulated using the present FD method with two mesh resolutions ( $d_p /\Delta x$ = 12.8 and 25.6) and
 $d_p /\Delta x$ = 0.5. Periodic boundary conditions are applied in all directions for a cubic domain of size
 $L_x=L_y=L_z=d_p ({\rm \pi} /6\phi )^{1/3}$, with one sphere fixed at the domain centre. Two particle volume fractions of
 $\phi = 0.2$ and 0.408 are considered. The Reynolds number
 $Re_f$ is defined by
 \begin{equation} Re_f=\frac{\rho_f(1-\phi) d_p u_f}{\mu}, \end{equation}
where  $u_f$ is the magnitude of the mean fluid velocity. The forces in figure 17 are normalized by the Stokes drag
 $F_{St}=3 {\rm \pi}\mu (1-\phi ) d_p u_f$. The present results with lower resolutions are compared with data reported by Hill et al. (Reference Hill, Koch and Ladd2001), Tenneti et al. (Reference Tenneti, Garg and Subramaniam2011) and Akiki, Jackson & Balachandar (Reference Akiki, Jackson and Balachandar2016) with much finer meshes in figure 17, and good agreement can be seen.
Normalized drag force versus Reynolds number for a SC arrangement of spheres.

Appendix B. Comparison of drag models and subgrid models
In this appendix we assess the performance of both existing models and newly proposed models for the mesoscale drag force and subgrid quantities.
B.1. Drag models with actual subgrid quantities
Figure 18 shows the p.d.f.s of the relative error between the actual and predicted drag force using the homogeneous model of Xia et al. (Reference Xia, Yu, Lin and Guo2022a) and mesoscale models by using actual drift velocity and variance of the solid volume fraction (3.7)–(3.9) from the interface-resolved simulations at four filter sizes. It can be seen that the homogeneous drag model has the largest spread in the relative error compared with the mesoscale models, especially at a larger filter size. The subgrid model of Parmentier et al. (Reference Parmentier, Simonin and Delsart2012) leads to a significant under-prediction of the filtered drag, indicating that the simple subgrid model with the drift velocity alone can not account for the drag enhancement. The present model and the mesoscale model of Ozel et al. (Reference Ozel, Gu, Milioli, Kolehmainen and Sundaresan2017) have a small difference ( $\pm$3 %) for the small filter size of
 $\varDelta _f/d_p = 4$, while the present model has a better performance compared with the model of Ozel et al. (Reference Ozel, Gu, Milioli, Kolehmainen and Sundaresan2017) for large filter sizes.
Probability density functions of the relative error between the exact and predicted drag force using different mesoscale drag models with actual subgrid quantities (3.7)–(3.9) and homogeneous drag model of Xia et al. (Reference Xia, Yu, Lin and Guo2022a) for a filter size of (a)  $\varDelta _f/d_p = 4$, (b)
 $\varDelta _f/d_p = 16$, (c)
 $\varDelta _f/d_p = 28$ and (d)
 $\varDelta _f/d_p = 40$.

Pearson correlation coefficients between the actual (DNS) and predicted drag force are presented in figure 19. The homogeneous drag models have a correlation coefficient of around 0.60 to 0.75, while the mesoscale drag models exhibit better prediction, with the correlation coefficient being over 0.9 for relatively large filter sizes.
Pearson correlation coefficients between the exact and predicted drag force using mesoscale drag models with actual subgrid quantities and microscale drag models at various filter sizes.

B.2. Models for subgrid quantities
Figure 20 shows the Pearson correlation coefficients between the actual and predicted drift flux  $v_d$ and variance of the solid volume fraction
 $\overline {{{(\phi '})^2}}$ versus the dimensionless filter size for the scale-similarity model of Rubinstein et al. (Reference Rubinstein, Ozel, Yin, Derksen and Sundaresan2017), the gradient model of Ozel et al. (Reference Ozel, Fede and Simonin2013), the Schneiderbauer model and our model. The superscripts ‘fine’ and ‘coarse’ refer to fine-grid (particle-size) and coarse-grid (filter-size) scale discretization on the computation of gradient quantities, respectively, while ‘actual’ in the model of Schneiderbauer (Reference Schneiderbauer2017) indicates that the actual
 ${\overline {{{( {\phi '} )}^2}}}$ obtained from the interface-resolved simulations is employed. We also use the superscripts ‘
 $M$’ and ‘
 $A$’ to denote the quantities obtained from the models and the interface-resolved simulations, such as
 $v^{{A}}_{d}$ and
 $v^{{M}}_{d}$. From figure 20(a), the coefficients
 $r(v^{{Rub}}_{d}; v^{{A}}_{d})$,
 $r(v^{{Grad}}_{d}; v^{{A}}_{d})$ and
 $r(v^{{Sch,coarse}}_{d}; v^{{A}}_{d})$ decrease dramatically with increasing filter size, while
 $r(v^{{Sch,actual}}_{d}; v^{{A}}_{d})$ reaches to a value larger than 0.85, as the filter size increases. Therefore, the model proposed by Schneiderbauer (Reference Schneiderbauer2017) for the drift velocity is desirable for relatively large filter sizes, if the variance of the particle volume fraction
 ${\overline {{{( {\phi '} )}^2}}}$ can be obtained accurately. Although the scale-similarity model proposed by Rubinstein et al. (Reference Rubinstein, Ozel, Yin, Derksen and Sundaresan2017) can predict the averaged drift velocity for a given particle volume fraction and a given filter size remarkably well (as shown in figure 8), its predictions of the drift velocity in a specific domain at an instantaneous time are not so good, as evidenced by a relatively low correlation coefficient in figure 20(a). The gradient model can yield a high correlation coefficient for
 ${\overline {{{( {\phi '} )}^2}}}$ if the gradient of the particle volume fraction is calculated with the particle-size grid, however, it yields the lowest correlation coefficient at large filter sizes if the gradient is computed with the filter-size grid. The model proposed by Schneiderbauer (Reference Schneiderbauer2017) for
 ${\overline {{{( {\phi '} )}^2}}}$ is actually a gradient-based model, and produces similar results as the gradient model of Ozel et al. (Reference Ozel, Fede and Simonin2013) for both fine-grid (not shown here) and coarse-grid discretizations.
Pearson correlation coefficients between the the actual and predicted (a) drift flux  $v_d$ and (b) variance of the solid volume fraction
 $\overline {{{(\phi '})^2}}$ for various filter sizes. The superscripts ‘fine’ and ‘coarse’ refer to fine-grid (particle-size) and coarse-grid (filter-size) scale discretization on the computation of gradient quantities. The ‘actual’ in the model of Schneiderbauer (Reference Schneiderbauer2017) indicates that the actual
 ${\overline {{{( {\phi '} )}^2}}}$ obtained from the interface-resolved simulations is employed. The present model corresponds to (3.23) and (3.24), with the solid particle volume fraction gradient computed with the filter-size grid.

In figure 20 the newly proposed model (green pentagram) exhibits a better performance on the correlation coefficient than the other models using the resolved quantities at a coarse-grid scale. In figure 21 we plot the p.d.f.s of the relative error between the actual and predicted  $v_d$ and
 $\overline {{{( {\phi '} )}^2}}$ obtained with different models using the resolved quantities at
 $\varDelta _f/d_p = 20$. As mentioned earlier, one drawback of the gradient model is that when the gradient of the particle volume fraction is close to zero, it predicts a very small
 $\overline {{{( {\phi '} )}^2}}$, but the actual
 $\overline {{{( {\phi '} )}^2}}$ may not be small, which is the reason why the p.d.f. of the relative error being around
 $-$1 for the gradient model is large in figure 21(b).
Probability density functions of the relative error between the actual and predicted (a) drift flux  $v_d$ and (b) variance of the solid volume fraction
 $\overline {{{( {\phi '} )}^2}}$ at
 $\varDelta _f/d_p = 20$.

Appendix C. The effect of domain size on the drag force correlation
The flow structure and particle distribution are significantly affected by the domain size. Previous studies have shown that the cluster size and fluctuations in the local solid volume fraction increase as the domain size increases (Capecelatro, Desjardins & Fox Reference Capecelatro, Desjardins and Fox2016; Ozel et al. Reference Ozel, Gu, Milioli, Kolehmainen and Sundaresan2017; Liu et al. Reference Liu, Ge and Wang2020). As a consequence, the drag model may depend on the domain size. To investigate the effects of the domain size on the domain-averaged statistics, as well as the relationship between subgrid quantities and filtered drag forces, we conduct simulations with two additional domain sizes (see table 4).
Simulation set-up and domain-averaged results for various domain sizes at  $Ga=50$,
 $\langle \phi \rangle = 0.1$ and
 $\rho _r = 100$.

As shown in table 4, the domain-averaged drag force for case B1 is about ten percent greater than that of case B2 and case L due to larger domain-averaged drift flux and variance of the solid volume fraction. The domain-averaged drag force for case L is smallest mainly due to the smallest (or largest in magnitude) drift flux.
Figure 22 compares the p.d.f. of the relative error and Pearson correlation coefficients in drag force predictions using the present filtered drag model ((3.2) and (3.7) with  $A = 7.3$,
 $B= 25.4$,
 $C = -3.3$) for three different domain sizes. The results show that the present model can provide excellent predictions for all domain sizes, indicating that the subgrid-quantity-dependent drag model is applicable to different domain sizes, which can be applied as a constitutive closure for industrial-scale simulations.
(a) The p.d.f. of the relative error between the exact and predicted drag force using model (3.7) and actual subgrid quantities from the IR-DNS data. (b) Pearson correlation coefficients between the exact and predicted drag force at different filter sizes.

Appendix D. Assessment of subgrid models for small-scale fluidized beds
In this appendix, interface-resolved simulations of small-scale fluidized beds of spheres in low-Reynolds-number (low- $Re$) and finite-Reynolds-number (finite-
 $Re$) systems with fully periodic boundary conditions are performed. The key parameters for the simulations are provided in table 5. The same flow geometry is employed as in the studies of Rubinstein et al. (Reference Rubinstein, Ozel, Yin, Derksen and Sundaresan2017) and Zhao et al. (Reference Zhao, Chen and Zhou2021) for low-
 $Re$ drag modelling based on subgrid quantities, while the flow configuration for finite-
 $Re$ simulations is similar to the work of Fullmer et al. (Reference Fullmer, Liu, Yin and Hrenya2017). Unlike the pseudo-2-D filtering cell used in large-scale cases, we employ a cubic filtering cell with the width of
 $\varDelta _f$ and the present subgrid-quantity-dependent drag model using modelled subgrid quantities is evaluated here.
Computational set-up for subgrid modelling used in a small-scale fluidized bed.

The particle distribution feature of the present small-scale system is significantly different from that of the large-scale system studied. Therefore, the model constants in the scale-similarity model are adjusted, as show in table 6, while the values of the other model constants remain the same as for the large-scale case.
Model constants for the scale-similarity model used in a small-scale fluidized bed.

D.1. Low-Reynolds-number system
For the low- $Re$ case, the low-
 $Re$ homogeneous (or microscopic) drag model developed by Rubinstein et al. (Reference Rubinstein, Derksen and Sundaresan2016) is adopted for comparison, i.e.
 \begin{align} F_{{Rub}}(\bar{\phi}, \widetilde{St})&=\alpha ( {\widetilde{St}} )\left( {10\frac{{\bar \phi }}{{(1 - \bar \phi )}} + {{(1 - \bar \phi )}^3}( {1 + 1.5\sqrt {\bar \phi } } )} \right)\nonumber\\ &\quad + ( {1 - \alpha ( { \widetilde{St}} )} ){( {1 - \bar \phi } )^{ - ( {n(\bar \phi ) - 2} )}}, \end{align}
with  $n(\bar \phi ) = 6.2 - 2.5 \bar \phi$, and the filtered Stokes number is defined as
 \begin{equation} \widetilde{St} = \frac{{{\rho_p} | {\widetilde{\boldsymbol{u}_{slip}}} |{d_p}}}{{18\mu (1 - \bar \phi )}}. \end{equation}
The parameter  $\alpha$ is given by
 \begin{equation} \alpha ( \widetilde{St}) = \frac{1}{2}\left( {1 + \frac{{ \widetilde{St} - 10}}{{ \widetilde{St} + 10}}} \right). \end{equation}
Figure 23 shows the p.d.f.s of the relative error in the drag prediction (3.2) and (3.7) with subgrid models at two filter sizes. The homogeneous drag model of Rubinstein et al. (Reference Rubinstein, Derksen and Sundaresan2016), on average, over-predicts our DNS drag with a large p.d.f. of positive relative error. In contrast, subgrid-quantity-dependent drag models achieve a better performance by considering the effects of the subgrid-scale structure, especially for  $\varDelta _f/d_p=5$ with the subgrid model of Schneiderbauer (Reference Schneiderbauer2017) and the present model.
The p.d.f. of the relative error between the actual and predicted drag force using different drag models at low- $Re$ regimes. Results are shown for (a)
 $\varDelta _f/d_p = 3$ and (b)
 $\varDelta _f/d_p = 5$.

D.2. Finite-Reynolds-number systems
For the finite- $Re$ system, three Galileo numbers and two density ratios are considered. As illustrated in figure 24, the particle distribution is nearly homogeneous for
 $\rho _r = 2$, while it transits to a plug-flow-like state at
 $\rho _r = 100$, which is expected to enhance the drag. Figure 25(a) displays the domain-averaged drag force versus the domain-averaged Reynolds number, in which the lines present the corresponding homogeneous drag prediction of Xia et al. (Reference Xia, Yu, Lin and Guo2022a). For the cases of
 $\rho _r=2$, the drag prediction is consistent with the actual drag force. Unlike the observation for the clustered flow at a large scale, the domain-averaged drag force at
 $\rho _r=100$ is much larger than the drag force at
 $\rho _r=2$ for the small-scale system.
Instantaneous particle distribution. Results are shown for (a)  $(Ga,\langle \phi \rangle,\rho _r) = (50,0.1,2)$, (b)
 $(Ga,\langle \phi \rangle,\rho _r) = (50,0.2,2)$, (c)
 $(Ga,\langle \phi \rangle,\rho _r) = (50,0.1,100)$, (d)
 $(Ga,\langle \phi \rangle,\rho _r) = (50,0.2,100)$.

(a) Domain-averaged drag force  $\langle F \rangle$ as a function of
 $\langle Re_m \rangle$. (b) Contributions of the domain-averaged drag correction; at the same
 $Ga$, the left column represents
 $\rho _r=2$ and the right one represents
 $\rho _r=100$. The lines in (a) represent the predictions from the homogeneous drag model of Xia et al. (Reference Xia, Yu, Lin and Guo2022a).

The ratio of the domain-averaged drag force to the drag predicted by a microscopic drag model can be decomposed into two parts as
 \begin{align} &\frac{\langle F\rangle}{F_{{mic}}}=1+\langle H\rangle =\underbrace{\frac{\langle v_d\rangle}{\langle\phi\rangle}+1}_{{I}}\nonumber\\ &\quad + \underbrace {A\frac{{\langle {{{( {\phi '} )}^2}} \rangle }}{{\langle \phi \rangle (1 - \langle \phi \rangle )}}{{\left( {\frac{{\langle {{v_d}} \rangle }}{{\langle \phi \rangle }} + 1} \right)}^2} + B{{\left( {\frac{{\langle {{{( {\phi '} )}^2}} \rangle }}{{\langle \phi \rangle (1 - \langle \phi \rangle )}}} \right)}^2}\left( {\frac{{\langle {{v_d}} \rangle }}{{\langle \phi \rangle }} + 1} \right) + C\frac{{\langle {{{( {\phi '} )}^2}} \rangle }}{{\langle \phi \rangle (1 - \langle \phi \rangle )}}\left( {\frac{{\langle {{v_d}} \rangle }}{{\langle \phi \rangle }} + 1} \right)}_{{{II}}}. \end{align}
The first part represents the contribution of drift flux to the drag modification and the second part represents the contribution of the variance of the solid volume fraction. Figure 25(b) shows the contributions of the two parts. The contribution of part I is slightly less than unity for each case, indicating that the drift velocity reduces the drag insignificantly even for  $\rho _r=100$ where the particle cluster or the plug flow occurs. The contribution of part II becomes significant for
 $Ga \ge 25$, particularly for
 $\phi =0.2$. The results indicate that the significant enhancement in the domain-averaged drag force in figure 25(a) at
 $\rho _r = 100$ is caused by the enhanced fluctuation of the solid volume fraction.
Figure 26 plots the p.d.f.s of the relative error between the actual and predicted filtered drag force at  $\varDelta _f/d_p=3$ and
 $\varDelta _f/d_p=5$ for
 $\rho _r=2$. The results show that for the homogeneous system, the gradient-based mesoscale models can still have slightly improved performances for the prediction of instantaneous drags, compared with the homogeneous drag model. Somehow, the scale-similarity model is not as good as the homogeneous drag model.
Probability density functions of the relative error between the exact and predicted drag force using different subgrid models for the homogeneous system at  $\rho _r = 2$ for (a)
 $\varDelta _f/d_p = 3$ and (b)
 $\varDelta _f/d_p = 5$.

In figure 27(a,b) we depict the conditionally averaged dimensionless drag force (both the actual drag and predicted drag) as a function of  $\bar \phi$ for
 $\varDelta _f/d_p=5$ and 9 at
 $\widetilde {Re_m} = 8$ and 10, in the case of the inhomogeneous system at
 $\rho _r = 100$ (see table 5). For the inhomogeneous system considered, the dependence of the drag on the particle volume fraction, the particle Reynolds number and the filter size can be complex. For example, the drag rises rapidly with increasing
 $\bar \phi$ at
 $\bar \phi$ between 0.15 and 0.2 for
 $\widetilde {Re_m} = 8.0$ and
 $\varDelta _f/d_p=9$, but does not for
 ${Re_m} = 10.0$ or
 $\varDelta _f/d_p=5$. Both drag enhancement and attenuation can be observed, as compared with the predictions from the homogeneous drag model. Despite the complex dependence, the drag can be well predicted by the subgrid drag models. The present model agrees best with the DNS results. Figure 27(c,d) presents the comparisons between the model predictions and the actual drags for
 $\varDelta _f/d_p=5$ and
 $\varDelta _f/d_p=9$, which also shows a higher accuracy of subgrid models compared with the homogeneous model. The results in this appendix confirm that the new subgrid drag model is also applicable to a smaller system with a different particle cluster structure.
Averaged dimensionless drag force  $F$ as a function of the solid volume fraction
 $\bar \phi$ at (a)
 $\widetilde {Re_m} = 8.0$ and (b)
 $\widetilde {Re_m} =10.0$ for the inhomogeneous systems at
 $\rho _r = 100$. The green dashed lines represent the predictions of the homogeneous drag model of Xia et al. (Reference Xia, Yu, Lin and Guo2022a) and the solid lines correspond to the actual
 $F$ from the interface-resolved simulations. Symbols represent drag predictions from the subgrid-quantity-dependent drag models (filled,
 $\varDelta _f/d_p=5$; empty,
 $\varDelta _f/d_p=9$). Predictions of the drag force
 $F$ from the subgrid-quantity-dependent drag models at (c)
 $\varDelta _f/d_p = 5$ and (d)
 $\varDelta _f/d_p = 9$. The error bars are given by measuring the standard deviation from the bin-averaged dimensionless drag force.



